All books

Professional

Apps About Coach Log in Start reading

Earth and Space Sciences · Glossary

What is Geological cross-section, topographic profile, vertical exaggeration?

Also known as: geological cross-section · topographic profile · vertical exaggeration

Definition 5.1 University Earth and Space Sciences — Year 1 · Chapter 5 — Cross-Sections

A geological cross-section is a drawing of the rock units and structures in a vertical plane through the ground, along a line drawn on the map. Its upper edge is the topographic profile, the curve of ground elevation along the line. The vertical exaggeration ee of a section is the ratio of its vertical scale to its horizontal scale; a section is true to scale when e=1e = 1.

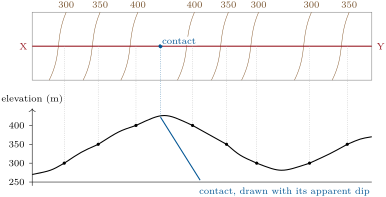
Building a section (schematic): the crossings of the contour lines with the line X–Y are carried down to their elevations to give the topographic profile; a contact crossing the line is carried down to the profile and drawn into the ground with its apparent dip.
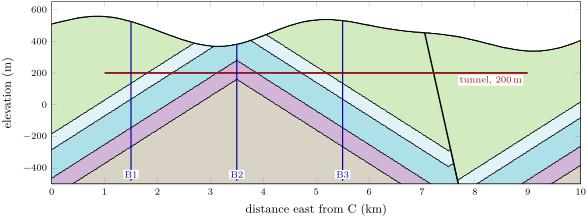
Section C–D across the Varden Hills, from the model of the region. Top: vertical exaggeration e = 3; bottom: the same section true to scale (e = 1), where the 12 limbs look as gentle as they are. Colours as in the geological map of ; the fault (thick line) is the normal fault, its eastern block downthrown. The red line is the tunnel of the problem; B1–B3 are boreholes. Section C–D across the Varden Hills, from the model of the region. Top: vertical exaggeration e = 3; bottom: the same section true to scale (e = 1), where the 12 limbs look as gentle as they are. Colours as in the geological map of ; the fault (thick line) is the normal fault, its eastern block downthrown. The red line is the tunnel of the problem; B1–B3 are boreholes.
Section C–D across the Varden Hills, from the model of the region. Top: vertical exaggeration e=3e = 3; bottom: the same section true to scale (e=1e = 1), where the 12∘12{}^{\circ} limbs look as gentle as they are. Colours as in the geological map of Chapter 4; the fault (thick line) is the normal fault, its eastern block downthrown. The red line is the tunnel of the problem; B1–B3 are boreholes.
Read in context →