
সব বই

পেশাদার

1 Markets I: The Ecosystem and Exchange-Traded Marketsবাজার অনলাইন 2 Markets II: Rates, FX and Creditবাজার অনলাইন 3 Markets III: Commodities, Energy and Cryptoবাজার অনলাইন 4 Quantitative Methodsপদ্ধতি অনলাইন 5 Derivatives and Volatilityডেরিভেটিভস অনলাইন 6 Rates, Credit, XVA and Riskসুদহার, ঋণ ও ঝুঁকি অনলাইন 7 Research Craft: Predictors, Backtests, Measurement, Portfoliosগবেষণা অনলাইন 8 Strategies I: Equities and Futuresকৌশল অনলাইন 9 Strategies II: Volatility, Relative Value, Macro and the Bank Desksকৌশল অনলাইন 10 Microstructure and Executionএক্সিকিউশন অনলাইন 11 Market Making and High-Frequency Tradingমার্কেট মেকিং অনলাইন 12 Machine Learning for Marketsমেশিন লার্নিং অনলাইন 13 Low-Latency Softwareপ্রযুক্তি অনলাইন 14 Networks, Hardware and Trading Infrastructureপ্রযুক্তি অনলাইন 15 Research, Data and Risk Platformsপ্রযুক্তি অনলাইন 16 The Desk and the Firmপ্রতিষ্ঠান অনলাইন 17 The Industry: Firms, Roles and Careersক্যারিয়ার অনলাইন 18 Interviews I: Maths, Probability and Speedক্যারিয়ার অনলাইন 19 Interviews II: Markets, Trading Games and the Final Roundক্যারিয়ার অনলাইন 20 Interviews III: Codeক্যারিয়ার অনলাইন
অ্যাপ পরিচিতি Coach সাইন ইন পড়া শুরু করো

বইগুলো এখনো বাংলা ভাষায় পাওয়া যায় না — ইংরেজি সংস্করণ দেখানো হচ্ছে।

Earth and Space Sciences · পরিভাষা

Palaeogeography; palaeogeographic map কী?

অন্য নাম: palaeogeography · palaeogeographic map

Definition 19.1 University Earth and Space Sciences — Year 2 · অধ্যায় 19 — The Phanerozoic Earth

Palaeogeography is the reconstruction of the geography of a past time: the positions of the continents and oceans, and of their shorelines, mountain belts and seas. A palaeogeographic map shows that geography at one time, on the grid of latitude and longitude of that time.
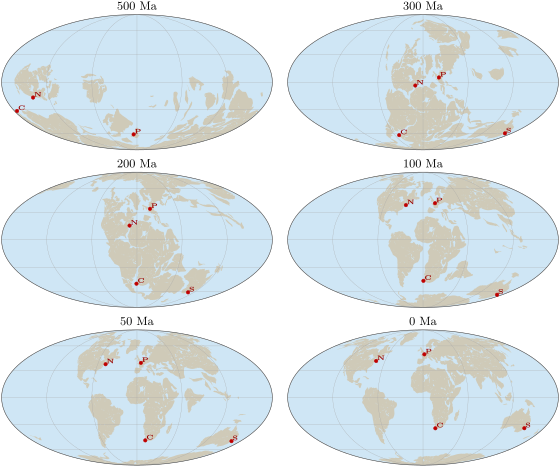
Today’s coastlines carried back to six times in the plate model of Merdith and others (2021), reconstructed by the GPlates Web Service, in an equal-area Mollweide projection; parallels every 30, meridians every 60. The red dots follow four cities: Paris (P), New York (N), Sydney (S) and Cape Town (C); at 500\, Ma the crust of Sydney is not yet in the model. The shapes are today’s shorelines moved, not the shorelines of those times, and in this palaeomagnetic frame the longitudes are arbitrary.
Today’s coastlines carried back to six times in the plate model of Merdith and others (2021), reconstructed by the GPlates Web Service, in an equal-area Mollweide projection; parallels every 30∘30{}^{\circ}, meridians every 60∘60{}^{\circ}. The red dots follow four cities: Paris (P), New York (N), Sydney (S) and Cape Town (C); at 500 Ma500\,\mathrm{Ma} the crust of Sydney is not yet in the model. The shapes are today’s shorelines moved, not the shorelines of those times, and in this palaeomagnetic frame the longitudes are arbitrary.

উদাহরণ

Example 19.2 (Paris drifts north)

In the model, Paris lay at 5.1∘5.1{}^{\circ} N 300 Ma300\,\mathrm{Ma} ago; it lies today at 48.9∘48.9{}^{\circ} N. Its latitude has grown by 43.8∘43.8{}^{\circ}, that is 43.8×111.2=4871 km43.8 \times 111.2 = 4871\,\mathrm{km} along a meridian (111.2 km111.2\,\mathrm{km} per degree on a sphere of radius 6371 km6371\,\mathrm{km}), at a mean rate of 4871/300=16 km4871/300 = 16\,\mathrm{km} per million years, or 1.6 cm1.6\,\mathrm{cm} a year. This is only the northward part of the motion: the palaeomagnetic frame leaves the longitude free, so the true distance travelled was at least this.

প্রসঙ্গসহ পড়ো →