
সব বই

পেশাদার

1 Markets I: The Ecosystem and Exchange-Traded Marketsবাজার অনলাইন 2 Markets II: Rates, FX and Creditবাজার অনলাইন 3 Markets III: Commodities, Energy and Cryptoবাজার অনলাইন 4 Quantitative Methodsপদ্ধতি অনলাইন 5 Derivatives and Volatilityডেরিভেটিভস অনলাইন 6 Rates, Credit, XVA and Riskসুদহার, ঋণ ও ঝুঁকি অনলাইন 7 Research Craft: Predictors, Backtests, Measurement, Portfoliosগবেষণা অনলাইন 8 Strategies I: Equities and Futuresকৌশল অনলাইন 9 Strategies II: Volatility, Relative Value, Macro and the Bank Desksকৌশল অনলাইন 10 Microstructure and Executionএক্সিকিউশন অনলাইন 11 Market Making and High-Frequency Tradingমার্কেট মেকিং অনলাইন 12 Machine Learning for Marketsমেশিন লার্নিং অনলাইন 13 Low-Latency Softwareপ্রযুক্তি অনলাইন 14 Networks, Hardware and Trading Infrastructureপ্রযুক্তি অনলাইন 15 Research, Data and Risk Platformsপ্রযুক্তি অনলাইন 16 The Desk and the Firmপ্রতিষ্ঠান অনলাইন 17 The Industry: Firms, Roles and Careersক্যারিয়ার অনলাইন 18 Interviews I: Maths, Probability and Speedক্যারিয়ার অনলাইন 19 Interviews II: Markets, Trading Games and the Final Roundক্যারিয়ার অনলাইন 20 Interviews III: Codeক্যারিয়ার অনলাইন
অ্যাপ পরিচিতি Coach সাইন ইন পড়া শুরু করো

বইগুলো এখনো বাংলা ভাষায় পাওয়া যায় না — ইংরেজি সংস্করণ দেখানো হচ্ছে।

Earth and Space Sciences · পরিভাষা

Travel-time table কী?

Definition 1.5 University Earth and Space Sciences — Year 3 · অধ্যায় 1 — Seismology and Earth Imaging

A travel-time table gives, for each seismic phase (P, S, PKP, PcP, …) and each source depth, the travel time as a function of epicentral distance, computed from a spherically symmetric reference model whose speeds were themselves adjusted to fit the times of a large set of well-located earthquakes. Its differences from an observed arrival are the starting point of earthquake location and of tomography.
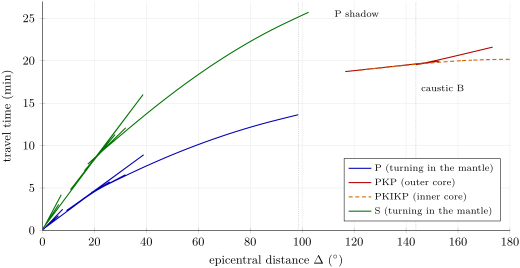
Travel times of P, S and the core phases from a surface source, computed through PREM by summing the integrals of  over 2-km shells. The P curve ends at 98.5; its slope, the ray parameter, decreases with distance. Below 40 it has several overlapping branches (triplications): rays turning in the weak gradient between the Moho and 220\, km travel far, out to about 39, before the rays turned back at the discontinuities of the model, at 220, 400 and 670\, km, take over; the first arrival is always the lowest branch. The PKP curve folds back at the caustic B, at 143.8, and its short branch also includes the rays turned back at the inner-core boundary. The S curve (rays turning in the mantle; the S waves reflected off the core are left out) ends near 102: S does not cross the liquid outer core.
Travel times of P, S and the core phases from a surface source, computed through PREM by summing the integrals of Proposition 1.4 over 2-km shells. The P curve ends at 98.5∘98.5{}^{\circ}; its slope, the ray parameter, decreases with distance. Below 40∘40{}^{\circ} it has several overlapping branches (triplications): rays turning in the weak gradient between the Moho and 220 km220\,\mathrm{km} travel far, out to about 39∘39{}^{\circ}, before the rays turned back at the discontinuities of the model, at 220, 400 and 670 km670\,\mathrm{km}, take over; the first arrival is always the lowest branch. The PKP curve folds back at the caustic B, at 143.8∘143.8{}^{\circ}, and its short branch also includes the rays turned back at the inner-core boundary. The S curve (rays turning in the mantle; the S waves reflected off the core are left out) ends near 102∘102{}^{\circ}: S does not cross the liquid outer core.
প্রসঙ্গসহ পড়ো →