Mathematics · Glossary

What is Statistical series?

Also known as: frequency

Definition 8.1 High School Mathematics · Chapter 8 — Descriptive Statistics

A statistical series is a list of values x1,x2,,xNx_1, x_2, \dots, x_N observed on a population of size NN. When a value xx appears nn times, nn is its count and the quotient

f=nNf = \frac{n}{N}

is its frequency (often expressed as a percentage). The frequencies of all values add up to 11.

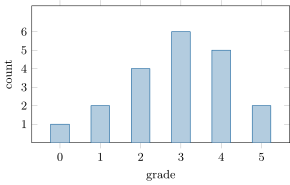
The bar chart of the quiz grades: one bar per value, with height equal to the count.

Examples

Example 8.2

The grades of 2020 students on a 55-point quiz:

grade xx001122334455
count nn112244665522
frequency ff0.050.050.100.100.200.200.300.300.250.250.100.10

Check: 1+2+4+6+5+2=201 + 2 + 4 + 6 + 5 + 2 = 20 and the frequencies sum to 11.

Read in context →