Research, Data and Risk Platforms · Technology
10Dataframes
Two researchers compute five-minute bars from the same trades and get different volumes. One library names a bar by its left edge and puts a trade stamped exactly on a boundary into the bar that starts there; the other names it by its right edge and puts the same trade into the bar that ends there; one of them drops the minutes in which nothing traded, the other does not. Both are right by their own conventions, and a signal that compares the two sets of bars finds a pattern that is nothing but the convention. The dataframe is the research platform’s working language; its idioms — bars, as-of joins, rolling windows, cross-sectional ranks, pivots — are where its silent bugs live, and its engines differ enormously in what they cost. This chapter writes the idioms once with explicit conventions for three engines (firm.marketdf), checks that the engines agree, and runs one research pipeline over a month of quotes and trades eagerly, lazily and out of core.
10.1 The dataframe model
Definition 10.1 (Dataframe)
A dataframe is a table of named, typed columns of equal length, with operations that act on whole columns and groups of rows: selection, filtering, computed columns, grouping and aggregation, joins, sorting, windows and reshaping.
The three engines of the chapter implement the same model differently. pandas holds each column as a numpy array (or an Arrow array) with a row index attached, and executes each operation when it is called. Polars holds columns in Arrow’s memory layout, has no row index, and can either execute each operation or build a plan and execute it later. DuckDB is a SQL engine: a query is a plan, executed when its result is asked for (chapter 5). The columnar layout of chapter 3 underlies all three.
Definition 10.2 (Long format, wide format)
A table in long format has one row per observation and a column for each variable, including the keys (symbol, time, value). The same data in wide format have one row per value of one key and one column per value of another (a row per minute, a column per symbol).
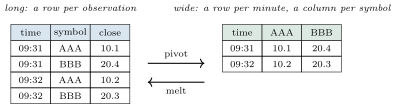
Market data are stored long (chapter 4’s partitions are long tables), and most transformations are clearer long: a rolling window is a window over the rows of one symbol, a cross-sectional rank a rank over the rows of one minute. The wide format serves the matrix operations of portfolio construction (One Quant Book 7, chapters 24–26), and the pivot between the two is where missing values appear: a minute in which one symbol did not trade is a missing cell in the wide table, never a row in the long one.
10.2 Eager and lazy evaluation
Definition 10.3 (Eager evaluation, lazy evaluation)
An engine with eager evaluation executes each operation when it is called and materialises its full result. An engine with lazy evaluation records the operations as a plan and executes the plan only when a result is requested, which lets it see the whole computation before running any of it.
Eager evaluation is easy to reason about and to debug step by step; every intermediate table exists, and every intermediate table costs memory. Lazy evaluation gives the engine the whole pipeline, which is what makes optimisation possible.
10.3 Query plans and optimisation
Definition 10.4 (Query optimiser)
A query optimiser rewrites a plan into an equivalent cheaper one before executing it: it pushes filters and projections toward the scans (so that fewer rows and columns are read, chapter 3), removes unused columns and operations, reorders joins and aggregations, and chooses algorithms.
A lazy query for one symbol’s prices on one day, written as a scan of every trade file followed by a filter and a selection, is optimised by Polars into a plan that reads one partition and four of six columns, and applies the filter while scanning (Figure 10.2).
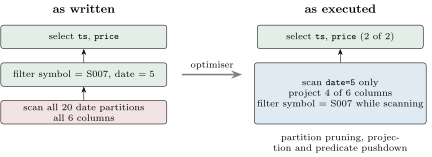
The partition pruning (only date=5 is scanned), the projection pushdown (four columns: the two asked for and the two the filter needs) and the predicate pushdown of chapter 3 are all the optimiser’s work; an eager version of the same code would read the month and filter it in memory.
10.4 Out-of-core and streaming execution
Definition 10.5 (Out-of-core processing, streaming execution)
Out-of-core processing computes a result over data larger than memory by reading it in pieces from storage. Streaming execution is the engine-level form of it: the plan’s operators pass batches to one another as they are produced, so that a scan, a filter and an aggregation hold one batch at a time, while operators that need all of their input (a global sort, some joins) buffer it.
Chapter 8 wrote out-of-core loops by hand; a lazy engine with a streaming executor does the same for a whole plan. It cannot do it for every operator: an as-of join needs both sides sorted, and a sort needs all its input, so a plan containing them buffers at those points. The pipeline below has both, which is why streaming saves memory here but does not make it constant.
10.5 Idioms for market data
Definition 10.6 (Window function)
A window function computes, for each row, a value over a set of related rows — the rows of the same group, ordered, possibly limited to a frame such as the last rows — without collapsing the rows as an aggregation does: a rolling mean per symbol, a rank within a minute, the previous row’s value (a lag).
Five idioms cover most of research on market data, and each has a convention that must be stated rather than inherited.
Method 10.7 (Market-data idioms with their conventions)
Bars: state the width, the label (left or right edge), the closed side, and whether empty bars are dropped or filled (with the previous close and zero volume). As-of joins: state the key (time or sequence number, chapter 4), the group, and whether an equal time matches. Rolling windows: state the frame (rows or time), the group and the minimum number of observations. Cross-sectional ranks: state the tie rule. Pivots: state what a missing cell means.
def bars(ticks: pd.DataFrame, width: int, label: str = "left", closed: str = "left",
         fill: bool = False, engine: str = "pandas") -> pd.DataFrame:
    shift = width if label == "right" else 0
    if engine == "pandas":
        t = ticks.sort_values(["symbol", "ts", "seq"], kind="stable")
        k = _bucket_pd(t["ts"], width, closed)
        g = t.assign(bar=k * width + shift).groupby(["symbol", "bar"], sort=True)
        b = g.agg(open=("price", "first"), high=("price", "max"), low=("price", "min"),
                  close=("price", "last"), volume=("qty", "sum"), trades=("qty", "size"))
        b = b.reset_index()
    elif engine == "polars":
        c = pl.col
        k = (c("ts") // width) if closed == "left" else ((c("ts") - 1) // width)
        b = (pl.from_pandas(ticks).lazy().sort(["symbol", "ts", "seq"], maintain_order=True)
             .with_columns((k * width + shift).alias("bar"))
             .group_by(["symbol", "bar"], maintain_order=True)
             .agg(c("price").first().alias("open"), c("price").max().alias("high"),
                  c("price").min().alias("low"), c("price").last().alias("close"),
                  c("qty").sum().alias("volume"), pl.len().alias("trades"))
             .sort(["symbol", "bar"]).collect().to_pandas())
    elif engine == "duckdb":
        x = "ts" if closed == "left" else "(ts - 1)"   # floor division, whatever `//` does
        k = f"(({x} - ((({x}) % {width}) + {width}) % {width}) // {width})"
        con = duckdb.connect()
        con.register("ticks", ticks)
        b = con.execute(f"""
            SELECT symbol, {k} * {width} + {shift} AS bar,
                   first(price ORDER BY ts, seq) AS open, max(price) AS high,
                   min(price) AS low, last(price ORDER BY ts, seq) AS close,
                   sum(qty) AS volume, count(*) AS trades
            FROM ticks GROUP BY ALL ORDER BY symbol, bar""").df()
    else:
        raise ValueError(engine)
    b = b[COLS].astype({c: "int64" for c in COLS[1:]}).reset_index(drop=True)
    return _fill(b, width) if fill else b
Listing 10.1 is the bars idiom in the three engines. Two details are the kind that breaks equivalence silently: the first and last price of a bar must be taken in time order with a tie-breaker (the feed’s sequence number), and the index of a right-closed bar is for integer times, which each engine must compute with floor division — DuckDB’s integer division truncates toward zero, and the SQL version computes the floor explicitly. The acceptance tests compare the three engines on trades stamped to the whole second, so that boundaries and ties occur.
Example 10.8 (Two sets of bars)
On one symbol-day of synthetic trades (375 trades, stamped to the second as some vendors deliver them), five-minute bars labelled and closed on the left and on the right differ in volume in 4 of the 74 intervals: two trades fall exactly on a five-minute boundary, and each moves its volume, 600 shares in all, from one bar to the next. The two sets also carry labels five minutes apart for the same interval. Filling empty bars adds 4 bars to the 74, and the day’s bar returns become 77 instead of 73: a return computed across a dropped bar spans ten minutes and is compared, in a rolling window, with five-minute returns.
![A trade stamped exactly 10:05:00 under two bar conventions. Closed on the left, it belongs to the bar [10\!:\!05, 10\!:\!10), labelled 10:05; closed on the right, to (10\!:\!00, 10\!:\!05], also labelled 10:05 because that convention names bars by their right edge. Filled dots mark closed ends, open dots open ends; the thick bar holds the trade. The same label names two different intervals, and the trade’s volume changes interval.](/images/onecourse/chapters/quant-15/pl-dataframes/fig-616c4670e796.svg)
10.6 Joins, windows and ranks: where ties hide
Bars are the most visible convention; three others hide in the joins and windows. An as-of join on the timestamp matches each trade with the last quote at or before its time: when a trade and the quote change it caused share a timestamp, the inclusive join returns the quote after the trade. Chapter 4 found this on 223 of 17 281 trades and made the join strict on the feed’s sequence number; firm_marketdf.asof takes strict as an argument in all three engines (pandas allow_exact_matches, Polars the same, DuckDB the inequality > instead of >=).
A rolling window has a frame in rows or in time, and a minimum number of observations below which it returns nothing or a partial value: the idiom’s rolling mean averages whatever rows exist, one at the start of each symbol, which must be known to the code that uses it. A cross-sectional rank has a tie rule, and engines differ in their default.
Example 10.9 (Tied returns)
In one minute, four symbols have returns , , and (in basis points). The average rule gives ranks 1, 2.5, 2.5 and 4, the rank sum whatever the ties. SQL’s rank() gives 1, 2, 2, 4 (the minimum rule), which lowers the tied symbols’ average rank; with rows tied at rank() , the average rank is , the expression the SQL of Listing 10.3 uses. Returns of prices on a tick grid tie often: in the smaller month of the tests, 10.8% of the 222 621 one-minute returns are exactly zero, and 6 467 groups of tied returns occur in 7 808 minutes.
10.7 One pipeline, five ways
The chapter’s research pipeline runs over the chapter-3 month of quotes (now 3 million, three thousand per symbol per day) and a month of 1.2 million trades, stored as date partitions of Parquet: one-minute bars, their log returns, the cross-sectional rank of each return within its minute, each symbol’s average rank over the month; and, in parallel, every trade joined as of its prevailing quote and each symbol’s mean effective spread in basis points. Listing 10.2 is the Polars version, a lazy plan that the three Polars modes share.
def _polars_plan(t: pl.LazyFrame, q: pl.LazyFrame):
    c = pl.col
    b = (t.with_columns((c("ts") // MIN).alias("bar")).sort(["symbol", "ts", "seq"])
         .group_by(["symbol", "bar"]).agg(c("price").last().alias("close"))
         .sort(["symbol", "bar"])
         .with_columns(c("close").log().diff().over("symbol").alias("ret")).drop_nulls("ret")
         .with_columns(c("ret").rank("average").over("bar").alias("rank")))
    ranks = b.group_by("symbol").agg(c("rank").mean().alias("avg_rank"))
    quote = q.select(["symbol", "ts", "bid", "ask"]).sort("ts")
    j = (t.sort("ts").join_asof(quote, on="ts", by="symbol", check_sortedness=False)
         .with_columns(((c("bid") + c("ask")) / 2.0).alias("mid"))
         .with_columns((2e4 * (c("price") - c("mid")).abs() / c("mid")).alias("spread_bp")))
    spreads = j.group_by("symbol").agg(c("spread_bp").mean())
return ranks, spreadsdef pipeline_duckdb(root: pathlib.Path) -> dict:
con = duckdb.connect()
con.execute("SET threads = 1")
for name in ("trades", "quotes"):
con.execute(f"CREATE VIEW {name[0]} AS SELECT * FROM "
f"read_parquet('{root}/{name}/*/*.parquet', hive_partitioning = true)")
ranks = con.execute(f"""
WITH b AS (SELECT symbol, ts // {MIN} AS bar, last(price ORDER BY ts, seq) AS close
FROM t GROUP BY ALL),
r AS (SELECT symbol, bar, ln(close) - lag(ln(close))
OVER (PARTITION BY symbol ORDER BY bar) AS ret FROM b),
k AS (SELECT symbol, bar,
(2 * rank() OVER w + count(*) OVER (PARTITION BY bar, ret) - 1)
/ 2.0 AS rank
FROM r WHERE ret IS NOT NULL WINDOW w AS (PARTITION BY bar ORDER BY ret))
SELECT symbol, avg(rank) AS avg_rank FROM k GROUP BY symbol""").df()
spreads = con.execute("""
WITH j AS (SELECT t.symbol, t.price, (q.bid + q.ask) / 2 AS mid
FROM t ASOF LEFT JOIN q ON t.symbol = q.symbol AND t.ts >= q.ts)
SELECT symbol, avg(2e4 * abs(price - mid) / mid) AS spread_bp
FROM j GROUP BY symbol""").df()
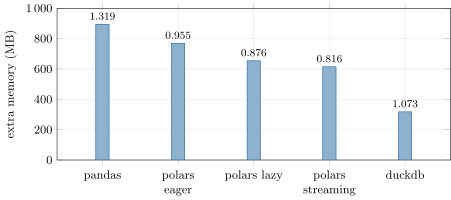
return _finish(ranks, spreads)All five modes return the same fifty average ranks and fifty mean spreads to nine decimals. Figure 10.4 measures them, each in its own process with one thread, memory counted as the process’s high-water mark minus that of a process that only imports the libraries (155 MB). pandas, eager and with a row index, reads the whole month into memory and holds every intermediate table: it needs 895 MB more than the imports and 1.3 s. Polars eager holds the same tables in Arrow form: 769 MB. Lazily, it needs 654 MB, and with the streaming engine 614 MB; the as-of join and the sorts keep the saving modest. DuckDB, executing the SQL over the files with its own streaming operators, needs 317 MB, a third of pandas.
bench_dataframes.py.Remark 10.10 (Measuring memory of a child process)
The first version of the measurement read the child’s peak resident set from getrusage, and every engine seemed to need about the same memory: on Linux, resource usage is preserved across exec, so the figure can include the memory of the process the child was started from. The high-water mark in /proc/self/status belongs to the process’s own address space; it is what the chapter reports.
As of September 2026 — Engine versions
The chapter’s measurements and plans use pandas 2.3.3, Polars 1.44.2, DuckDB 1.5.5 and PyArrow 25.0.1, the versions pinned in the series’ requirements. Plans, defaults and memory use change between versions: the plan of Figure 10.2 is what this Polars version prints, and Polars falls back to its in-memory engine for operations not yet implemented in streaming.
10.8 Tutorial: bars, conventions and five engines
Goal. Compute bars under stated conventions in three engines, see what the conventions change, and run one pipeline in five modes with identical answers. End state: Example 10.8, Figure 10.4 and the optimised plan of the chapter.
- Idioms:
firm_marketdf.bars,asof,rolling_mean,xs_rank,to_wide,to_long; the acceptance tests check that the three engines agree. - Conventions:
pl_dataframes.conventions()for the symbol-day of Example 10.8. - Plan:
plan_text()prints the optimised lazy plan of a narrow query. - Pipeline:
write_month(**BIG), thenbench_dataframes.pyruns the five modes, each in its own process, checks the answers and records time and memory.
What to change next. Replace the as-of join in the Polars plan by a join on the previous second and see what the streaming engine then saves; add a filled-bar option to the pipeline and measure how the average ranks change.
10.9 Build: market-data idioms
Purpose. The platform’s shared implementation of the idioms every researcher rewrites: one contract, three engines, the conventions as arguments, the equivalence as tests. The backtest engine of chapter 11 and the feature code of the research environment (chapter 15) use it.
Interface. ENGINES; bars(ticks, width, label, closed, fill, engine); asof(left, right, by, on, engine, strict); rolling_mean(df, by, order, column, window, engine); xs_rank(df, time, column, engine); to_wide, to_long.
Rules. Conventions are arguments with no hidden default beyond the documented one; every idiom has the same result in every engine, to the row; ties are broken by the sequence number; integer times are bucketed by floor division in every engine.
Acceptance tests. code/firm/marketdf/tests/: bars under four conventions equal across engines on second-stamped trades, with volume conserved; the conventions worked by hand on four trades; as-of joins (inclusive and strict), rolling means and ranks equal across engines; a pivot round trip.
Stretch. Time-based rolling windows; bars with volume-weighted prices; the idioms for Arrow tables without pandas.
Sources and further reading
- H. Wickham, “Tidy data”, Journal of Statistical Software 59(10), 2014.
- pandas documentation,
DataFrame.resample; Polars user guide, “Streaming”; DuckDB documentation, “AsOf join”. - Linux man-pages,
getrusage(2).
10.10 Exercises
Exercise 10.1 ★
A trade is stamped 10:05:00 exactly. In which five-minute bar, and under which label, does it fall under each of the two conventions of Figure 10.3?
Solution
Solution of Exercise 10.1.
Closed and labelled on the left: in the bar , labelled 10:05. Closed and labelled on the right: in the bar , also labelled 10:05. Same label, different intervals, five minutes apart.
Exercise 10.2 ★
Convert the long table of Figure 10.1 to wide and back. What does the wide table hold for a minute in which BBB did not trade?
Solution
Solution of Exercise 10.2.
Wide: a row per minute (09:31, 09:32), columns AAA and BBB. A minute in which BBB did not trade has a missing value in the BBB column; melting back and dropping missing values returns the original four rows. A missing cell means no observation, not a price of zero, and code that fills it must say with what.
Exercise 10.3 ★
Which columns and partitions does the optimised plan of the narrow query read, and why four columns rather than two?
Solution
Solution of Exercise 10.3.
One partition, date=5, and four of the six columns: ts and price, which the query returns, and symbol and date, which the filter needs.
Exercise 10.4 ★★
Why is the index of a right-closed bar for integer , and what goes wrong in an engine whose integer division truncates toward zero, for negative times?
Solution
Solution of Exercise 10.4.
The right-closed bar is . For integers, is , so . Truncation toward zero agrees with the floor for non-negative numbers only: for and the floor is and the truncation , so the times just below zero are put into the bar just above it, which becomes twice as wide. Negative times appear as soon as times are measured from a reference such as the session open.
Exercise 10.5 ★★
In Example 10.8, dropping the empty bars gives 73 returns and filling them 77. Which returns differ, and what does a 20-bar rolling volatility of the dropped series overstate?
Solution
Solution of Exercise 10.5.
The filled series has four more returns, each zero, for the empty bars; the return after each gap is the same in both series, but in the dropped series it spans ten minutes and is treated as a five-minute return. A 20-bar rolling volatility of the dropped series then mixes five- and ten-minute returns: it overstates the five-minute volatility around the gaps, and its window covers more than 100 minutes of time.
Exercise 10.6 ★★
Why does streaming execution save less memory on the chapter’s pipeline than on a pipeline of scans, filters and aggregations?
Solution
Solution of Exercise 10.6.
Scans, filters and aggregations can each process one batch and pass it on, holding a bounded state. The chapter’s pipeline sorts the trades and joins them as of the quotes, which needs both sides sorted: those operators hold all of their input, and the streaming engine falls back to the in-memory engine where an operator is not implemented in streaming.
Exercise 10.7 ★★★
Coding. With firm_marketdf.bars, compute one-minute bars of the chapter’s month for one symbol in the three engines and under the four conventions of the acceptance tests. Do the engines agree, and does the total volume depend on the convention?
Solution
Solution of Exercise 10.7.
On the month of the tests, symbol S003 (7 960 trades stamped to the second): the three engines return identical bars under each of the four conventions, and the total volume is the same under all four — each trade belongs to exactly one bar; the conventions move volume between bars and rename the bars, they do not create or lose any.
Exercise 10.8 ★★★
Find the flaw. “We resample trades to bars with the library default, compute returns with pct_change on the bar table sorted by time, and rank them across symbols each minute.”
Solution
Solution of Exercise 10.8.
Three flaws. The conventions are the library’s defaults and unstated: pandas closes and labels bars on the left for most frequencies but on the right for month, quarter, year and week ends. The returns are computed on a table sorted by time and not grouped by symbol, so each return compares the bar of one symbol with the previous row, another symbol’s bar. And empty bars are either dropped or missing, so returns span unequal intervals, and the ranks compare them. Compute returns per symbol, state and fix the bar conventions, and decide what an empty bar is before ranking.
10.11 Problem: Two Sets of Bars
Problem 10.1
Weekend problem — a month through five engines
The chapter’s month of quotes and trades, its bar conventions and the five engine modes of Figure 10.4.
Part I — Conventions.
- How many trades of the symbol-day fall exactly on a five-minute boundary, and why can that happen?
- How many of the 74 intervals differ in volume between the two conventions, and how many shares move?
- How far apart are the labels of the same interval under the two conventions?
- How many bars and returns does the day have with empty bars dropped, and with them filled?
- Which convention would you choose for a research store, and what must be written down?
Part II — Plans.
- What does an eager engine materialise that a lazy one need not?
- What three optimisations does the narrow query’s plan show?
- Why is a lazy plan easier to optimise than eager code?
- Which operators of the pipeline cannot stream, and why?
- Why must the SQL compute floor division explicitly?
Part III — The five modes.
- What does the pipeline compute, and how are the five answers compared?
- How much memory beyond the imports does each mode need?
- Which mode is fastest, and which uses least memory?
- Why is pandas the most expensive in memory?
- Why did a first measurement show about the same memory for every engine?
Part IV — The verdict.
- State the named result: the volume and return discrepancies of the conventions, and the time and memory of the pipeline in the five modes.
- Which engine would you use for a month, and which for five years of the same data?
- What would you standardise across a research team so that two researchers’ bars agree?
- What does an equivalence test across engines protect against?
- In one sentence: what makes a dataframe pipeline trustworthy?
Solution
Solution of Problem 10.1.
- Two; the timestamps are truncated to the second, and one second in 300 is a five-minute boundary, so about 375/300 trades are expected on edges.
- Four intervals; 600 shares move (each edge trade leaves one bar and enters its neighbour).
- Five minutes: the left convention names an interval by its start, the right by its end.
- Dropped: 74 bars and 73 returns; filled: 78 bars and 77 returns.
- Either, applied everywhere and recorded with the data: width, closed side, label, the treatment of empty bars and the tie rule. With left labels, the bar’s close is known only at label plus width: joining a bar to other data at its label is a look-ahead.
- Every intermediate table, in full, at each step.
- Partition pruning, projection pushdown and predicate pushdown.
- The engine sees the whole computation before running any of it: it can drop unused columns, move filters to the scan and choose algorithms.
- The sorts and the as-of join, which need all of their input in order.
- DuckDB’s integer division truncates toward zero; the bar index needs the floor, which differs for negative numbers.
- One-minute bars, returns, cross-sectional ranks and each symbol’s average rank; as-of joined trades and each symbol’s mean effective spread. The answers are rounded to nine decimals and compared for equality before any time is recorded.
- pandas 895 MB, Polars eager 769, lazy 654, streaming 614, DuckDB 317.
- Polars streaming is the fastest (0.82 s), DuckDB uses least memory (317 MB).
- It reads the whole month into memory, turns string columns into Python objects, and each step materialises a new table.
- Resource usage is preserved across
execon Linux, so the child’sgetrusagepeak can include the memory of the process it was started from. - Named result. Two bar conventions on the same trades differ in 4 of 74 five-minute volumes (600 shares) and label the same interval five minutes apart, and filling empty bars turns 73 returns into 77; the same research pipeline over a month needs 895 MB beyond the imports in pandas, 769, 654 and 614 MB in Polars eager, lazy and streaming, and 317 MB in DuckDB, at 0.8 to 1.3 s, with identical answers.
- For a month, any of them. For five years (sixty times the data), a lazy engine over the partitions, DuckDB or Polars streaming, or the pipeline run per day or month where the computation allows it (returns across days need the previous day’s last bar).
- One shared library of idioms (bars, as-of joins, windows, ranks, pivots) with the conventions as arguments and recorded in the datasets’ metadata: width, closed side, label, empty bars, tie rule, units and time zone.
- Against an engine’s default silently changing a result — a tie rule, a bucketing, a rounding, the treatment of missing values — and against a change of behaviour in a new version of an engine.
- Stated conventions, one implementation tested across engines, and a measured cost.
10.12 Interview questions
Interview question 10.1 ★ researcher
Your five-minute bars do not match a colleague’s. What do you check?
Solution
Solution of Interview question 10.1.
The width, the closed side, the label, the time zone and session times, the treatment of empty bars, the timestamps’ resolution (trades on edges), the tie order for first and last prices, and which trades are included (condition codes, off-exchange prints). Then compare the two sets bar by bar on the same trades.
What the interviewer is looking for: Conventions first, then a bar-by-bar comparison.
Interview question 10.2 ★★ researcher, developer
What is the difference between eager and lazy dataframe evaluation, and when does it matter?
Solution
Solution of Interview question 10.2.
Eager execution runs each operation at once and materialises every intermediate table; lazy execution records a plan and runs it when a result is requested, after optimisation (pushdowns, pruning, dropping unused columns) and possibly by streaming. It matters when the data are large compared with memory or read from many files, and when a pipeline computes much it does not return.
What the interviewer is looking for: Materialisation and optimisation.
Interview question 10.3 ★★ researcher
How would you compute a cross-sectional rank of one-minute returns across 3 000 symbols for a year?
Solution
Solution of Interview question 10.3.
Bars per symbol (a partition by date and symbol), returns per symbol, then a window rank partitioned by minute with a stated tie rule, in a lazy or SQL engine over date partitions, one day at a time, keeping each symbol’s last bar of the previous day for the first return. About rows: a size for an engine that streams, not for an eager in-memory table.
What the interviewer is looking for: Partitioned, streamed, conventions and ties stated.
Interview question 10.4 ★★ developer
Your pandas job runs out of memory on a month of trades. What do you change?
Solution
Solution of Interview question 10.4.
Read only the columns and partitions needed (a lazy scan), use compact types (categorical symbols, integer prices and times), process by day where the computation allows it, and move the pipeline to a lazy or SQL engine that streams; measure the peak before and after.
What the interviewer is looking for: Projection, types, chunking, a lazy engine, a measurement.
Interview question 10.5 ★★★ developer, researcher
Design a shared library of market-data transformations for a research team using several dataframe engines.
Solution
Solution of Interview question 10.5.
A contract per idiom (bars, as-of joins, rolling windows, ranks, pivots) with the conventions as required arguments; one implementation per engine behind it; equivalence tests on data built to hit boundaries and ties, run in continuous integration for every engine version; the conventions written into each dataset’s metadata; benchmarks of time and memory per engine to guide the choice.
What the interviewer is looking for: Explicit conventions and tested equivalence across engines.