Research, Data and Risk Platforms · Technology
23Market-Data Distribution and Entitlements
An exchange’s auditor asks a firm for the list of every person and every program that used the exchange’s depth data in the past three years. The firm can name forty screens: it pays for forty. It cannot name, at first, the eleven applications that read the same feed from the firm’s distribution platform — strategies, a risk service, a tick recorder, a surveillance system, a research dashboard — and each of them is a use the exchange charges for. The firm in this chapter is a model, but the documents it is audited against are real: one exchange’s price list, data policies and subscriber agreement. The chapter builds the platform that distributes market data inside a firm and the part of it that is usually missing: the record of who used what, for which purpose, counted the way the venue counts.
23.1 Distributing data inside the firm
A direct feed (Book 1, chapter 9) arrives once at the firm’s feed handlers. From there it must reach dozens of consumers with very different needs: a strategy that wants every message within microseconds, a risk service that wants current prices, a trader’s screen that cannot show more than a few updates a second, a research job that records everything. Connecting each of them to the feed would multiply the network load, the licences and the points of failure; the firm puts one platform in between.
Definition 23.1 (Market-data distribution platform)
A market-data distribution platform receives normalised market data once and delivers it inside the firm to subscribers by topic (an instrument, a venue, a data type), with a delivery policy per subscriber — every message in order, or conflated — and with an entitlement check on every subscription.
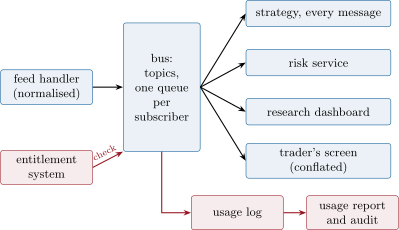
The chapter’s bus (firm.entitle) is simulated in virtual time. Ten minutes of depth updates for twenty instruments — 240 267 messages, from Book 7’s tape generator, the order flow that Book 10’s simulator replays — go to four subscribers: a strategy that takes 20 microseconds per message, a risk service that takes 2 milliseconds, a research dashboard that takes 10, and a trader’s screen following five instruments at 50 milliseconds a refresh. Each subscriber has its own queue, so that a slow one cannot delay the others: the publish–subscribe design of chapter 24, and the slow-consumer problem of Book 13, chapter 12, one level up.
    def _enqueue(self, s: _Sub, ts: float, topic: str, value) -> None:
        if s.policy == "conflate":
            s.queue.pop(topic, None)             # keep only the latest per topic
            s.queue[topic] = (ts, value)
        else:
            s.queue.append((ts, topic, value))
        s.stats.max_depth = max(s.stats.max_depth, len(s.queue))

    def _pop(self, s: _Sub):
        if s.policy == "conflate":
            _topic, (ts, value) = s.queue.popitem(last=False)
            return ts, value
        ts, _topic, value = s.queue.popleft()
return ts, value| policy | subscriber | delivered | largest queue | mean age | largest age |
|---|---|---|---|---|---|
| every message | strategy | 240 267 | 1 199 | 0.1 ms | 24 ms |
| risk service | 240 267 | 1 203 | 58 ms | 2.4 s | |
| research dashboard | 240 267 | 180 267 | 891 s | 1 803 s | |
| conflated | strategy | 238 870 | 20 | 0.0 ms | 0.4 ms |
| risk service | 221 364 | 20 | 4.0 ms | 32 ms | |
| research dashboard | 60 012 | 20 | 67 ms | 134 ms |
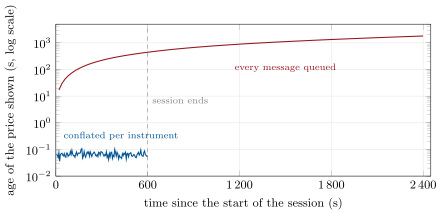
The research dashboard is the lesson of Table 23.1. It can process 100 messages a second and the feed brings about 400: with every message queued, its queue grows through the whole session to 180 267 messages, it shows prices fifteen minutes old on average, and it is still working through the session half an hour after it ended (Figure 23.2). Conflated, it processes a quarter of the messages and never shows a price older than 134 ms. The risk service can keep up on average but not in bursts; conflation takes its worst age from 2.4 seconds to 32 ms. A screen or a risk service wants the current state, not the history, and should be conflated; a strategy or a recorder needs every message and must be fast enough not to need it.
fig_entitle.py.23.2 Licences, uses and units of count
What the firm pays for is not the feed: it is each use of it. Venues distinguish display use, by a person looking at a screen, from non-display use by a machine, which Book 1, chapter 29, introduced with the non-display fee; and they count each in a stated unit.
Definition 23.2 (Unit of count)
A unit of count is what a venue’s licence counts to charge for its data: for display use typically each device or each unique user identification, so that one person with two logins counts twice; for non-display use typically each device (usually a server) that receives and benefits from the data, or each person who can change the application in real time.
The definition is the venue’s, and it is where firms lose money. The chapter’s venue — Nasdaq, whose documents are in the ledger — counts a display subscriber as "a device, computer terminal, automated service, or unique user identification and password combination", and non-display use by the servers that receive and benefit from the data, including those that compute on it or create derived data from it. Servers that only transport, normalise or store the data are not necessarily fee-liable, but the firm must be able to show which they are. A firm that counts people instead of identifiers, or applications instead of servers, undercounts by construction.
23.3 Entitlements
Definition 23.3 (Entitlement, entitlement system)
An entitlement is a permission for a subject — a user identifier or an application — to receive one source of data for one use. An entitlement system holds the entitlements with their grant and revocation times, answers whether a subject is entitled at a given time, and is checked by the distribution platform before any data is delivered.
The question is when to check. Checking at subscription is cheap and enough while nothing changes; but a trader who leaves the desk, or an application whose licence lapses, keeps receiving until it next subscribes. In the chapter’s run the screen user’s entitlement is revoked five minutes into the session. With the check made only at subscription, the screen receives another 6 005 updates it was not entitled to; checked at every delivery, none.
    def _serve(self, s: _Sub, t: float, ready: list, i: int) -> None:
        if not s.queue:
            return
        ts, _value = self._pop(s)
        if self.check_on_delivery and not self.ents.check(s.subject, s.source, s.use, t):
            s.stats.denied += 1
        else:
            s.stats.delivered += 1
            s.ages.append(t + s.service - ts)
            s.stats.max_age = max(s.stats.max_age, t + s.service - ts)
            if self.trace_every and s.stats.delivered % self.trace_every == 0:
                s.stats.trace.append((t + s.service, t + s.service - ts))
        s.busy_until = t + s.service
        if s.queue:
heapq.heappush(ready, (s.busy_until, i))A real platform does not call the entitlement system for each of millions of messages: it caches the answer per subscription and invalidates the cache when an entitlement changes, which has the same effect at almost no cost. What matters is that revocation is pushed to the platform rather than discovered at the next login.
23.4 Usage reporting and exchange audits
Definition 23.4 (Usage report)
A usage report is the periodic declaration a firm makes to a data source of how many units of count used its data, by product and by use, from which the source bills its fees.
Definition 23.5 (Market-data audit)
A market-data audit is a venue’s or vendor’s review of a firm’s actual use of its data over a past period, reconciled with what the firm reported; the difference is billed back, usually with interest and, above a threshold, the audit’s costs.
The chapter’s firm reported 40 display subscribers every month for three years and no non-display use. Its usage log — which the platform writes on every subscription — tells a different story (Figure 23.3). Traders grew from 38 to 47, and six of them have a second login, so display identifiers went from 43 to 53; the eleven applications came into use one after another and by the end ran on 22 servers.
def usage_report(log: UsageLog, month: int, source: str) -> dict:
    """The monthly count a venue asks for: distinct units of count by use."""
    units = {u: set() for u in USES}
    for r in log.rows:
        if r.month == month and r.source == source:
            units[r.use].add(r.unit_id)
    return {u: len(v) for u, v in units.items()}


@dataclass
class AuditRow:
    month: int
    used: dict
    licensed: dict
    shortfall: dict
    owed: float


def audit(log: UsageLog, source: str, months, licensed: dict, fees: dict) -> list[AuditRow]:
    """Reconcile each month's usage with the licences held; the amount owed is the fee for
    what was used minus the fee for what was licensed, by use."""
    out = []
    for m in months:
        used = usage_report(log, m, source)
        short = {u: max(0, used[u] - licensed.get(u, 0)) for u in USES}
        owed = sum(max(0.0, fees[u](used[u]) - fees[u](licensed.get(u, 0))) for u in USES)
        out.append(AuditRow(m, used, dict(licensed), short, owed))
    return out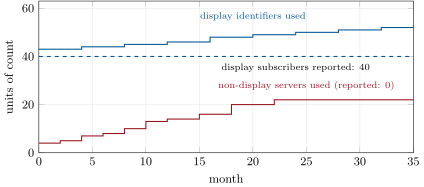
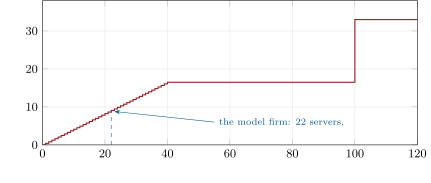
fig_entitle.py.Priced with the venue’s 2026 fees for its depth product — $84 a month per professional display subscriber, and for non-display use $412 a month per subscriber up to 39, then a flat $16 490 a firm from 40 to 99 (Figure 23.4) — the shortfall is $1 900 in the first month and $10 156 in the last, $258 596 over the three years: $22 932 for display and $235 664 for non-display. The unreported units reach 87.5% of those reported, far above the 10% at which the venue’s subscriber agreement adds the audit’s costs; interest comes on top, at a rate the model does not price. The display shortfall is the smaller part. The firm’s real mistake was believing that data it had paid to receive could be used by any program.
fig_entitle.py.The remedy is technical as much as contractual. The platform’s usage log is the evidence an audit asks for, and it must record the unit of count the venue uses — identifiers, not people; servers, not applications — for as long as the look-back. The chapter’s venue limits liability for a good-faith error to three years before the underreporting was found, so three years of logs is the minimum. A monthly reconciliation of the log against the licences, run by the firm before any auditor does, turns a back-bill into a licence purchase.
23.5 Derived data
Definition 23.6 (Derived data)
Derived data is information computed in whole or in part from a venue’s data that cannot be reverse-engineered to recreate it or used as a reasonable substitute for it: an index, a signal, a model’s fair value. What is and is not derived data is decided by each venue’s policy.
A conflated quote is not derived data: it is the venue’s data, delivered less often, and needs the same licence. A mid-price published every second may be a substitute for the quote; a volatility estimate or a basket’s fair value usually is not. The distinction matters in two directions: derived data may be redistributed under terms that the raw data does not allow, and the servers that create it are, for the chapter’s venue, among the non-display units that count. The entitlement model should therefore carry the use — display, non-display, derived — and not only the source, and the tick store of chapter 4 should record which licence each dataset was captured under, since the licence follows the data into research.
As of September 2026 — One venue’s data policies and fees
Nasdaq’s US equities price list sets, from 1 January 2026, monthly fees for Nasdaq TotalView of $84.00 per professional subscriber ($80.50 in 2025) and $15.00 per non-professional; for non-display use of its depth data with direct access, $412.00 per subscriber from 1 to 39, $16 490 per firm from 40 to 99, $32 990 from 100 to 249 and $75 000 from 250; and distributor fees of $1 690 per firm for internal distribution and $3 340 for direct access. Its US Equities and Options Data Policies (version 2.6) define the subscriber, non-display use and derived data as quoted in this chapter, and state that undeclared usage of a system cannot be netted over the audit period. Its subscriber agreement limits liability for a good-faith error to three years of unpaid fees with interest, and adds the audit’s costs when underreporting reaches 10% of the reported units.
23.6 Tutorial: distribute, entitle, report, audit
Goal. Distribute a feed to subscribers of different speeds, enforce entitlements, and reconcile three years of usage with the licences held. End state: Table 23.1 and the audit’s $258 596.
- Feed:
pl_entitle.updates(), ten minutes of twenty instruments. - Distribution:
distribute(ups, "all")anddistribute(ups, "conflate"); compare queues and ages. - Entitlements: rerun with
check_on_delivery=Falseand count the screen’s deliveries after the revocation. - Usage:
usage_log()andfirm_entitle.usage_reportfor any month. - Audit:
audit(), the months, the shortfalls and the amount owed.
What to change next. Move the research dashboard onto the servers of a distribution tier and see what the non-display count becomes; price the audit with each year’s fees instead of 2026’s.
23.7 Build: entitlements
Purpose. Deliver market data inside the firm to each subscriber in the form it can use, only to those entitled, with the evidence of every use counted as the venue counts it.
Interface. Entitlement, EntitlementSystem (grant, revoke, check), Bus (subscribe, run), UsageLog, usage_report, audit.
Rules. One queue per subscriber; conflation for subscribers that want state; entitlement checked at subscription and enforced at delivery; every use logged in the venue’s unit of count; logs kept at least as long as the look-back; a monthly reconciliation before any audit.
Acceptance tests. code/firm/entitle/tests/: checks by subject, source, use and time; queued and conflated delivery; a busy subscriber scheduled correctly; revocation at delivery against at subscription; usage counts by identifier and device, and an audit’s shortfall and amount.
Stretch. Tiered fees with enterprise licences; a derived-data register; a usage report in a venue’s file format.
Sources and further reading
- Nasdaq, U.S. Equities Price List, fees effective 2025, 2026 and 2027.
- Nasdaq, US Equities and Options Data Policies, version 2.6.
- Nasdaq, Global Subscriber Agreement, sections 5(g) and 5(h).
- One Quant Book 1, chapters 9 and 29 (direct feeds, non-display fees); Book 13, chapter 12 (slow consumers and conflation).
23.8 Exercises
Exercise 23.1 ★
Why does the platform keep one queue per subscriber rather than one per topic?
Solution
Solution of Exercise 23.1.
Because subscribers consume at different speeds: with a queue per subscriber a slow one only delays itself, and each can have its own policy (every message or conflated) and its own entitlement check. A shared queue per topic would hold every subscriber to the pace of the slowest.
Exercise 23.2 ★
A trader uses the same depth data on a desktop and, with a second login, on a laptop. How many display subscribers is that for the chapter’s venue?
Solution
Solution of Exercise 23.2.
Two: the venue counts each unique user identification and password combination (or each device), not each person.
Exercise 23.3 ★
What is the model firm’s non-display fee in the last month, and what would it be with 45 servers?
Solution
Solution of Exercise 23.3.
22 servers at $412 each, $9 064 a month; 45 servers fall in the 40 to 99 tier, a flat $16 490.
Exercise 23.4 ★★
Which of the four subscribers should be conflated, and why not the strategy?
Solution
Solution of Exercise 23.4.
The screen, the risk service and the research dashboard: each wants the current state of each instrument, not its history. The strategy reacts to every change of the book and may need the sequence (queue position, trades); it must be fast enough to keep up instead.
Exercise 23.5 ★★
Why does the research dashboard, queued, show prices fifteen minutes old on average when it takes 10 milliseconds per message?
Solution
Solution of Exercise 23.5.
The feed brings about 400 messages a second and it can process 100: its queue grows by about 300 a second for the whole session, to 180 267, and a message published late in the session waits behind all of them. The age is set by the backlog, not by the 10 ms of work.
Exercise 23.6 ★★
The firm wants to check entitlements at every delivery without calling the entitlement system millions of times a minute. How?
Solution
Solution of Exercise 23.6.
Cache the entitlement decision per subscription on the platform, have the entitlement system push each grant and revocation to the platform, and invalidate or cut the subscription on a revocation; the check at delivery is then a flag lookup.
Exercise 23.7 ★★★
Coding. Rerun audit with the firm reporting its display identifiers correctly every month but still no non-display use. How much is owed?
Solution
Solution of Exercise 23.7.
$235 664: the whole non-display shortfall remains, since display use was only $22 932 of the $258 596.
Exercise 23.8 ★★★
Find the flaw. "We pay the distributor fee for internal distribution, so any application inside the firm may use the data."
Solution
Solution of Exercise 23.8.
The distributor fee pays for the right to receive and distribute the data inside the firm; each use is licensed separately, by display subscriber and by non-display subscriber or server. Every application that computes on the data is a non-display use to be counted and paid.
23.9 Problem: Eleven Applications
Problem 23.1
Weekend problem — eleven applications
The chapter’s platform, its four subscribers, and the model firm’s three years of usage.
Part I — Distribution.
- What does the distribution platform do that connecting each consumer to the feed does not?
- How fast does each subscriber process messages, and how fast does the feed arrive?
- What happens to the research dashboard with every message queued?
- What does conflation change for the risk service and the dashboard?
- What is the strategy’s largest queue, and why?
Part II — Entitlements.
- What does an entitlement name?
- What happens after a revocation when entitlements are checked only at subscription?
- How does a platform enforce entitlements at every delivery cheaply?
- What is the unit of count for display and for non-display use at the chapter’s venue?
- Which servers are not necessarily fee-liable?
Part III — The audit.
- What did the firm report, and what does its usage log show in the first and last months?
- What are the monthly fees used to price the shortfall?
- What is owed in the first and last months?
- What is owed over the three years, for display and for non-display?
- Why does the audit cost the firm more than the back-billed fees?
Part IV — The verdict.
- State the named result: the licence shortfall in display users and non-display applications found by reconciling three years of usage logs, and its back-billed cost under the venue’s 2026 fees.
- How long must usage logs be kept, and in what unit?
- Is a conflated quote derived data?
- What would you change first in the firm’s platform?
- In one sentence: what does a market-data licence pay for?
Solution
Solution of Problem 23.1.
- It receives the feed once, gives each consumer its own queue and policy, checks entitlements, and logs every use.
- Strategy 20 s, risk service 2 ms, research dashboard 10 ms per message, the screen 50 ms per refresh; the feed brings about 400 messages a second (240 267 in ten minutes).
- Its queue grows to 180 267 messages, the mean age is 891 seconds, and it finishes half an hour after the session.
- The risk service’s largest age falls from 2.4 s to 32 ms; the dashboard’s mean age from 891 s to 67 ms, processing 60 012 messages instead of 240 267.
- 1 199 messages: the opening snapshot of every instrument’s book, published at one instant.
- A subject (user identifier or application), a source, and a use.
- The subject keeps receiving until it next subscribes: 6 005 updates to the revoked screen in the chapter.
- By caching the decision per subscription and invalidating it when the entitlement system pushes a change.
- Display: each device or unique user identification; non-display: each device (usually a server) that receives and benefits from the data, or each person who can modify the application in real time.
- Servers that only transport, disseminate, aggregate, normalise or store the data — provided the firm can identify them.
- 40 display subscribers and no non-display use every month; the log shows 43 display identifiers and 4 servers in the first month, 53 and 22 in the last.
- $84 per professional display subscriber; non-display $412 per subscriber up to 39, then $16 490 per firm up to 99.
- $1 900 and $10 156.
- $258 596: $22 932 for display and $235 664 for non-display.
- Interest is added, and the underreporting (87.5% of the reported units) is far above the 10% at which the subscriber agreement adds the audit’s costs.
- Named result. Reconciling three years of usage logs with the licences held finds a display shortfall of 3 to 13 user identifiers and a non-display shortfall of 4 to 22 servers a month; back-billed at the venue’s 2026 fees, $258 596, of which $235 664 for the non-display use of the eleven applications.
- At least as long as the look-back (three years here), in the venue’s unit of count: identifiers and servers.
- No: it is the venue’s data delivered less often, and needs the same licence.
- Log every subscription in the venue’s units, check entitlements by use, and reconcile the log with the licences every month.
- Each use of the data, counted in the venue’s unit, not the data’s arrival at the firm.
23.10 Interview questions
Interview question 23.1 ★ developer
What is conflation, and when would you use it?
Solution
Solution of Interview question 23.1.
Keeping only the latest update per key (instrument) in a consumer’s queue, so that a consumer that cannot process every message sees current state with bounded delay. Use it for screens, risk and monitoring; not for consumers that need the sequence.
What the interviewer is looking for: Latest value per key; bounded age.
Interview question 23.2 ★★ developer
A slow consumer is holding up your market-data bus. What do you do?
Solution
Solution of Interview question 23.2.
Give each consumer its own queue so it only delays itself; conflate it if it wants state; otherwise bound its queue, measure its lag, and disconnect or alert when it falls too far behind rather than applying back-pressure to the feed.
What the interviewer is looking for: Isolate, conflate, bound.
Interview question 23.3 ★★ developer
What is the difference between display and non-display use of market data, and why does it matter to a developer?
Solution
Solution of Interview question 23.3.
Display is a person viewing the data, non-display a machine using it; venues license and count them separately, so every program a developer connects to a feed is a licensed use that must be registered and counted.
What the interviewer is looking for: Every program is a use.
Interview question 23.4 ★★ developer
An exchange announces an audit of your data usage over the past three years. What do you need to have?
Solution
Solution of Interview question 23.4.
Three years of usage logs in the venue’s units of count, the list of entitlements with grants and revocations, the list of servers by role (distribution against use), the reports filed, and the licences held.
What the interviewer is looking for: Logs in the venue’s units, for the look-back.
Interview question 23.5 ★★★ developer
Design the market-data distribution and entitlement platform of a firm with a thousand users and a hundred applications.
Solution
Solution of Interview question 23.5.
Feed handlers into a bus with topics and per-subscriber queues and policies; an entitlement system with grants, revocations and uses, pushed to the bus; a usage log in each venue’s units; monthly reports and a reconciliation with licences; a derived-data register; capacity per subscriber monitored.
What the interviewer is looking for: Distribution, entitlement and evidence together.