Research, Data and Risk Platforms · Technology
28Observability and Incident Response
On 22 August 2013 the system that disseminates consolidated quotes for Nasdaq-listed stocks began to fail at 11:48 in the morning, with intermittent outages on some of its channels. At 12:03 it stopped disseminating quotes altogether; a regulatory halt stopped trading in those stocks on every venue; the technical fault was fixed by 12:24, and quoting and trading resumed at 15:25. A firm’s monitoring that morning could look perfect: every process up, every queue empty, every heartbeat on time — because nothing was arriving. This chapter builds the monitoring that would have noticed: signals about what users of the platform receive rather than about the processes that serve them, objectives with error budgets, alerts that page only when a person should act, and the incident practice that follows the page.
28.1 Metrics, logs and traces
Definition 28.1 (Observability)
Observability is the degree to which the internal state of a running system can be inferred from what it emits — its metrics, logs and traces — without deploying new code to ask a new question.
Definition 28.2 (Metric, structured logging)
A metric is a named numeric measurement with labels, sampled or aggregated over time: a counter (messages received), a gauge (queue depth), a histogram (latency, as in Book 13, chapter 5). Structured logging writes each log event as a record of named fields — time, level, service, event, identifiers, values — rather than a sentence, so that logs can be queried like data.
Definition 28.3 (Distributed tracing, span)
Distributed tracing follows one unit of work — a request, a market-data message, an order — across the services it passes through. Each step is a span, a unit of work with a start, an end, a trace identifier shared by all the steps and the identifier of the step that caused it, so that the path can be rebuilt as a tree.
The chapter’s chain is the platform’s own: capture (chapter 2), the tick store, the position service (chapter 17) and real-time risk (chapter 18). firm.observe gives each a metric registry, structured log records and spans in the OpenTelemetry sense, carried from one service to the next. A traced message shows where its time goes (Figure 28.1): a fraction of a millisecond in capture, storage and positions, then the wait in the risk service’s queue — 50 milliseconds on a normal day, a minute when the risk service falls behind.
class Tracer:
    def __init__(self, prefix: str = ""):
        self.spans: list[Span] = []
        self._ids = itertools.count(1)
        self.prefix = prefix

    def start(self, name: str, service: str, ts: float, parent: Span | None = None,
              **attrs) -> Span:
        n = next(self._ids)
        trace = parent.trace_id if parent else f"{self.prefix}t{n:06d}"  # a root: new trace
        parent_id = parent.span_id if parent else None
        s = Span(trace, f"{self.prefix}s{n:06d}", parent_id, name, service, ts, None, attrs)
        self.spans.append(s)
        return s

    def finish(self, span: Span, ts: float) -> None:
        span.end = ts

    def trace(self, trace_id: str) -> list[Span]:
        mine = (s for s in self.spans if s.trace_id == trace_id)
        return sorted(mine, key=lambda s: s.start)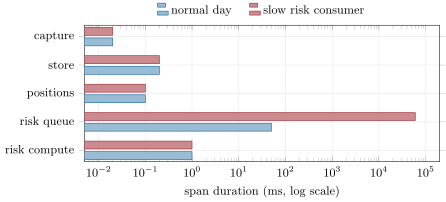
fig_observe.py.Each of the three answers a different question. Metrics say that something is wrong, cheaply, for everything, all the time. Logs say what happened in one service. Traces say where the time went across services, for the sampled units of work. Most trading firms have the first two and not the third, and learn where a message spent its minute only by reading the logs of four services side by side, with four clocks.
28.2 Service levels and error budgets
Definition 28.4 (Service-level indicator, service-level objective)
A service-level indicator (SLI) is a carefully defined measure of some aspect of the service a user receives: here, the share of seconds in which the market data the risk service uses is at most five seconds old. A service-level objective (SLO) is a target for an SLI over a period: here, 99.9% of the trading seconds of a 30-day month.
The indicator is chosen from the user’s side. A heartbeat from the risk service says the process is alive; the age of its data says whether it is doing its job. On the hook’s morning every heartbeat was on time and every age grew by one second per second. An SLO differs from Book 14’s service-level agreement in whom it binds: an agreement is a promise to a customer with penalties, an objective is the firm’s own target, set tighter than any promise it makes.
Definition 28.5 (Error budget)
The error budget of an SLO is the amount of bad service it allows over its period — one minus the target, times the events — which the service spends on incidents, maintenance and risky changes; when it is spent, reliability work takes priority over features.
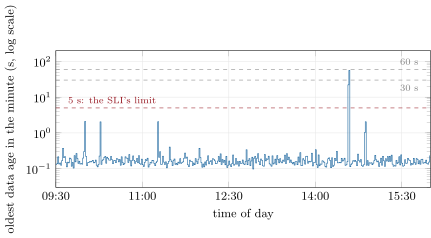
A 99.9% objective on 30 trading days of 23 400 seconds allows 702 bad seconds a month. The chapter’s quiet days — the chain’s normal latency of tens of milliseconds, plus pauses (a burst, a collection, a slow disk) that arrive 0.8 times an hour and during which the age grows one second a second — spend 115 of them, 16% of the budget, in 18 pauses of more than five seconds (Figure 28.2).
fig_observe.py.28.3 Alerting that people act on
A page wakes a person. It should mean that a person must act now, and it should come early enough for the action to matter. Static thresholds on the data’s age trade the two against each other; a rule on the error budget does not have to.
Definition 28.6 (Burn-rate alert)
A burn-rate alert pages when the error budget is being spent faster than a stated multiple of the rate that would exactly exhaust it over the SLO’s period, measured over a long window and confirmed over a short one: for a 99.9% objective, Google’s SRE workbook recommends paging at 14.4 times over an hour (confirmed over five minutes) or 6 times over six hours (over thirty minutes).
def _window_share(bad: np.ndarray, w: int) -> np.ndarray:
    c = np.concatenate(([0], np.cumsum(bad)))
    t = np.arange(1, len(bad) + 1)
    lo = np.maximum(0, t - w)
    return (c[t] - c[lo]) / w           # share of bad seconds; the missing past counts good


def burn_rate_pages(bad, target: float, rules, min_gap_s: float = 3600) -> list[int]:
    """Multi-window burn-rate alerting: page when, for some rule (long, short, rate), the
    bad share over both the last `long` and `short` seconds exceeds rate x (1 - target)."""
    b = np.asarray(bad, dtype=float)
    fire = np.zeros(len(b), dtype=bool)
    for long_s, short_s, rate in rules:
        lim = rate * (1.0 - target)
        long_ok = _window_share(b, int(long_s)) > lim
        both = long_ok & (_window_share(b, int(short_s)) > lim)
        fire |= both
return _pages(fire, min_gap_s)Three incidents are replayed on a quiet day at the hook’s clock times: a feed stall from 12:03 lasting 21 minutes; intermittent stalls of 20 seconds every minute from 11:48 for a quarter of an hour; and a slow consumer from 14:00, a risk service whose lag grows by 0.05 seconds each second. Five rules watch them (Table 28.1).
| rule | feed stall | intermittent stalls | slow consumer | false pages a month |
|---|---|---|---|---|
| process heartbeat | never | never | never | 0 |
| data age above 5 s | 5 s | 5 s | 100 s | 18 |
| data age above 30 s | 30 s | never | 600 s | 1 |
| data age above 60 s | 60 s | never | 1 200 s | 0 |
| burn rate, 1 h and 6 h rules | 56 s | 191 s | 151 s | 1 |
Definition 28.7 (Time to detect, time to restore)
The time to detect of an incident is the time from its start to the first alert or report that a person acts on; its time to restore is the time from its start to the moment the service users receive is back within its objective.
Time to restore is measured on the service a user receives, from the incident’s start; Book 14’s mean time to repair is a property of a component such as a circuit, averaged over its failures, from failure to repair.
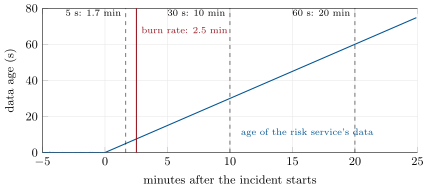
The static thresholds show the trade-off (Table 28.1). At five seconds they detect everything at once and page 18 times a month on pauses that heal by themselves; within a few weeks nobody answers them. At thirty or sixty seconds the false pages disappear, but the intermittent stalls — the 11:48 phase of the hook — never reach the threshold, and a slow consumer takes ten or twenty minutes to be noticed. The burn-rate rules page 56 seconds into the stall, three minutes into the intermittent stalls and two and a half into the slow consumer (Figure 28.3), with one page a month on quiet days: the 56-second pause, which does spend a real share of the budget and deserves a look.
fig_observe.py.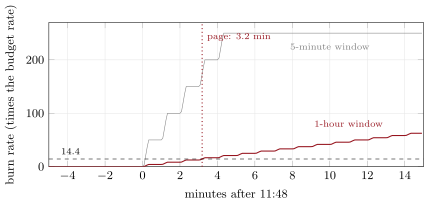
fig_observe.py.28.4 On call and incident command
Definition 28.8 (On-call rotation, runbook)
An on-call rotation assigns, by a published schedule, the people who answer pages for a service at each hour, with a secondary behind the primary. A runbook is the written procedure for a known alert or failure: what it means, how to confirm it, what to do first, whom to call.
Definition 28.9 (Incident commander)
The incident commander holds the overall state of an incident and structures the response — assigning who changes the system, who communicates, who plans — without doing the technical work themselves.
In a trading firm the first minutes of an incident are about exposure, not diagnosis: is the firm trading on stale data, and should strategies stop? The runbook for a data-age page therefore starts with the kill switches of Book 13 and the risk limits of Book 11, then the diagnosis, and the incident commander’s first question to the trading desk is what the firm holds. Only one group changes the system during an incident, so that fixes do not collide; one person communicates, so that the desk, risk and compliance hear the same thing.
| time | source | event |
|---|---|---|
| 12:03:00 | log | tickcap: last message on the quote channels |
| 12:03:05 | alert | data age above 5 s: page |
| 12:03:30 | alert | data age above 30 s: page |
| 12:03:56 | alert | burn rate: page |
| 12:04:00 | alert | data age above 60 s: page |
| 12:24:00 | log | tickcap: quote channels resume |
| 12:24:00 | log | rtrisk: data age back under 5 s |
firm.observe.timeline. Time to detect: 56 seconds under the burn-rate rule; time to restore: 21 minutes.28.5 An incident replayed, and the review that follows
Definition 28.10 (Blameless review)
A blameless review (post-incident review, postmortem) reconstructs an incident’s timeline and contributing causes without indicting any individual or team, on the assumption that everyone acted in good faith with the information they had, and ends with actions that change the system rather than exhortations to be careful.
The replayed stall’s review writes itself from Table 28.2. The data stopped at 12:03; the burn-rate page came at 12:03:56; the feed returned at 12:24 and the risk service’s data was fresh again the same second. The questions it asks are not who failed but what the system let happen: why the firm’s dashboards showed green (they measured processes, not data); what the strategies did with stale prices for the first minute (the kill switch’s trigger was on process health, not data age); why the intermittent phase from 11:48 went unnoticed (thresholds above its twenty seconds). Its actions are changes: an SLI on data age for every consumer, burn-rate paging, a kill switch on stale data, and the replay itself kept as a test (chapter 27) so that the next change to the alerting is checked against it. An incident that becomes an operational loss event (Book 6, chapter 28) enters the firm’s loss data as well; the review is what makes the loss data useful.
As of September 2026 — The 2013 SIP outage and the SRE practices
Nasdaq’s vendor alert on the UTP SIP issue of 22 August 2013 gives the timeline: intermittent outages across multiple quote channels from 11:48, an outage on all quote channels at 12:03, the issue resolved and the environment stable at 12:24, connectivity re-established from 14:00, and all quoting and trading in Nasdaq-listed securities resumed at 15:25; the trade feeds were not affected, and a regulatory halt was issued for all trading in those securities. Google’s Site Reliability Engineering defines SLIs, SLOs and the error budget and describes incident command and blameless postmortems; its workbook recommends, for a 99.9% objective, paging on burn rates of 14.4 over one hour and 6 over six hours, each confirmed on a window one twelfth as long. OpenTelemetry defines a span as a unit of work carrying trace, span and parent identifiers.
28.6 Tutorial: three hours of silence
Goal. Instrument the chain, define its SLO, replay three incidents, compare alerting rules, and build the incident’s timeline. End state: Tables 28.1 and 28.2.
- Traces:
pl_observe.traced(ts, lag)on a normal day and during the slow consumer. - Quiet days:
quiet_day(seed)andbudget(), the error budget used in a month. - Incidents:
incident(kind)for the three kinds. - Rules:
compare(): time to detect and false pages for each rule. - Timeline:
stall_timeline()and the review.
What to change next. Add a ticket rule (burn rate 1 over three days) and count what it catches that the pages do not; make the pauses twice as frequent and see which rules survive.
28.7 Build: observability
Purpose. Know what the platform’s users receive, page a person only when one must act, and reconstruct any incident from what the platform emitted.
Interface. Registry (counter, gauge, histogram), log, Tracer (start, finish, trace), SLO, error_budget_used, threshold_pages, burn_rate_pages, timeline.
Rules. SLIs measured from the user’s side; every service emits metrics, structured logs and spans with propagated identifiers; pages from burn rates on SLOs, tickets from slow burns; every page has a runbook; every incident has a commander and a blameless review with changes.
Acceptance tests. code/firm/observe/tests/: registry kinds and labels, a structured log line; a trace rebuilt from parent links; budgets and burn rates; threshold pages with a minimum gap; a burn-rate page at the 52nd bad second of an outage and none before; a merged timeline.
Stretch. Exemplars linking a histogram bucket to a trace; tail-based trace sampling; alerts on the CUSUM of an SLI (Book 7, chapter 13).
Sources and further reading
- Nasdaq, UTP Vendor Alert #2013-9: UTP SIP Issue on Thursday, August 22, 2013.
- B. Beyer, C. Jones, J. Petoff and N. R. Murphy (eds.), Site Reliability Engineering, O’Reilly, 2016 (chapters 3, 4, 14, 15); The Site Reliability Workbook, 2018 (Alerting on SLOs).
- OpenTelemetry documentation, Traces.
- One Quant Book 13, chapters 5 and 24 (latency histograms, kill switches); Book 14, chapter 15 (service-level agreements, mean time to repair).
28.8 Exercises
Exercise 28.1 ★
How many bad seconds does a 99.9% objective allow over thirty days of 23 400 seconds, and how many did the quiet month spend?
Solution
Solution of Exercise 28.1.
bad seconds; the quiet month spent 115, 16.4% of the budget, in 18 pauses of more than five seconds.
Exercise 28.2 ★
Why does the process heartbeat never fire in any of the three incidents?
Solution
Solution of Exercise 28.2.
Because no process stops: in the stall the processes wait for data that does not come, in the intermittent stalls they wait twenty seconds a minute, in the slow consumer the risk service is busy. A heartbeat measures the process, not the service the users receive.
Exercise 28.3 ★
How long does the burn-rate rule take to page on a complete stall, and where does the number come from?
Solution
Solution of Exercise 28.3.
56 seconds: the first five seconds are still good (data at most five seconds old); the hour window must then hold 1.44% of 3 600 seconds bad, 51.8, so the page comes at the 52nd bad second, with the five-minute window long since past its own limit.
Exercise 28.4 ★★
Why do the thirty- and sixty-second thresholds never see the intermittent stalls?
Solution
Solution of Exercise 28.4.
Each stall lasts twenty seconds and the data then refreshes, so the age never exceeds twenty seconds. A third of the seconds are bad, which spends the budget quickly, but no single second crosses thirty.
Exercise 28.5 ★★
What does the short window of a burn-rate rule add to the long one?
Solution
Solution of Exercise 28.5.
It requires the problem to be happening now: without it, an hour-long window keeps firing for up to an hour after an incident has ended, and a burst early in the window keeps paging after recovery. The short window makes the alert stop soon after the service recovers.
Exercise 28.6 ★★
What is the replayed stall’s time to restore, and why is it not a mean time to repair?
Solution
Solution of Exercise 28.6.
21 minutes, from the last quote at 12:03 to fresh data at 12:24, measured on the service the risk system receives. A mean time to repair (Book 14, chapter 15) is a component’s average from failure to repair over many failures; this is one incident of one service.
Exercise 28.7 ★★★
Coding. Make the pauses twice as frequent (pauses_per_hour=1.6) and recount the false pages of the five-second threshold and of the burn-rate rules over thirty days.
Solution
Solution of Exercise 28.7.
The five-second threshold doubles to 36 false pages a month and the 30-second one triples to 3; the burn-rate rules stay at one, because the pauses are still short and spend little budget each.
Exercise 28.8 ★★★
Find the flaw. "Our monitoring was fine: every service reported healthy throughout the outage."
Solution
Solution of Exercise 28.8.
The services were healthy and idle: they reported on themselves, not on what they delivered. Health checks must be complemented by SLIs from the users’ side — here the age of the data — or an outage upstream looks like a quiet day.
28.9 Problem: Three Hours of Silence
Problem 28.1
Weekend problem — three hours of silence
The chapter’s chain, SLO, quiet days, incidents and rules.
Part I — Signals.
- What do metrics, logs and traces each answer?
- Where does a traced message spend its time on a normal day and during the slow consumer?
- Why is the SLI the data’s age and not the process’s health?
- What does the SLO allow, and what do quiet days spend?
- How does an SLO differ from a service-level agreement?
Part II — Rules.
- What are the three replayed incidents?
- What does each static threshold detect, and how fast?
- How many false pages a month does each rule send?
- What do the burn-rate rules detect, and how fast?
- Why is the burn-rate rule’s one false page a month acceptable?
Part III — Response.
- What does the incident commander do and not do?
- What comes first in the runbook for a data-age page in a trading firm?
- What is the replayed stall’s timeline?
- What are its time to detect and time to restore?
- What does a blameless review produce?
Part IV — The verdict.
- State the named result: the time to detect a feed stall and a slow consumer under a static threshold and under burn-rate alerts, and the false pages a month each costs, on the replayed incident and on thirty quiet days.
- Which rule would you deploy, and with what ticket rule behind it?
- What would have made the firm’s dashboards turn red on the hook’s morning?
- What changes would the review of the replayed stall require?
- In one sentence: what should a page mean?
Solution
Solution of Problem 28.1.
- Metrics: is something wrong, everywhere, cheaply. Logs: what happened in one service. Traces: where the time went across services for one unit of work.
- Fractions of a millisecond in capture, store and positions, then the risk queue: 50 ms normally, 60 s during the slow consumer; risk computes in 1 ms.
- Because a service can be alive and useless: the users need fresh data, not live processes.
- 702 bad seconds a month; quiet days spend 115.
- An SLO is the firm’s own target, set tighter; an SLA is a promise to a customer with penalties.
- A feed stall from 12:03 for 21 minutes, 20-second stalls every minute from 11:48 for 15 minutes, a slow consumer from 14:00.
- Five seconds: all three, in 5, 5 and 100 s; thirty: the stall in 30 s and the slow consumer in 600 s, not the intermittent stalls; sixty: the stall in 60 s, the slow consumer in 1 200 s, not the intermittent stalls.
- 18, 1 and 0 for the three thresholds, none for the heartbeat, one for the burn-rate rules.
- All three, in 56, 191 and 151 seconds.
- It is the 56-second pause, which spends a real share of the budget and deserves a look.
- Holds the incident’s state and assigns the roles; does not do the technical work.
- Exposure: is the firm trading on stale data, and should strategies stop — kill switches and limits before diagnosis.
- 12:03:00 last quote; 12:03:05, 12:03:30, 12:03:56 and 12:04:00 the four pages; 12:24:00 the feed resumes and the data is fresh.
- 56 seconds to detect under the burn-rate rule, 21 minutes to restore.
- A timeline, contributing causes without blame, and changes to the system.
- Named result. A complete feed stall is detected in 5, 30 and 60 seconds by static thresholds at those ages and in 56 seconds by the burn-rate rules; a slow consumer in 100, 600 and 1 200 seconds against 151; intermittent stalls only by the five-second threshold (5 seconds) and the burn-rate rules (191). On thirty quiet days the thresholds send 18, 1 and 0 false pages a month, the burn-rate rules one; a process heartbeat detects nothing.
- The burn-rate rules for pages, with a ticket on a burn rate of 1 over three days for slow degradation.
- An SLI on the age of the data each consumer uses.
- Data-age SLIs everywhere, burn-rate paging, a kill switch on stale data, and the replay kept as a test of the alerting.
- That a person must act now, on something the users of the service can feel.
28.10 Interview questions
Interview question 28.1 ★ developer
What is the difference between monitoring a process and monitoring a service?
Solution
Solution of Interview question 28.1.
A process check asks whether a program runs; a service check asks whether its users get what they need, measured from their side (data age, error rate, latency). Only the second sees an upstream failure or a silent slowdown.
What the interviewer is looking for: User-side indicators.
Interview question 28.2 ★★ developer
What are an SLI, an SLO and an error budget? Give one for a market-data platform.
Solution
Solution of Interview question 28.2.
An SLI measures the service (the share of seconds with market data at most five seconds old); the SLO is its target (99.9% over 30 trading days); the error budget is what the target allows (702 bad seconds a month), spent on incidents and risky changes.
What the interviewer is looking for: A concrete indicator, target and budget.
Interview question 28.3 ★★ developer
Your team gets thirty pages a week and ignores most of them. What do you change?
Solution
Solution of Interview question 28.3.
Delete or demote every page that did not need a person now; page on SLO burn rates instead of raw thresholds; put a runbook behind every page; review the pages each week.
What the interviewer is looking for: Pages mean action.
Interview question 28.4 ★★ developer
A message takes a minute to go from the feed to the risk system. How do you find out where?
Solution
Solution of Interview question 28.4.
Trace it: propagate a trace identifier with the message through every service, record a span per step, and read the tree; a queue wait shows up as one long span.
What the interviewer is looking for: Distributed tracing.
Interview question 28.5 ★★★ developer
Design the observability and incident process for a trading firm’s data and risk platform.
Solution
Solution of Interview question 28.5.
User-side SLIs and SLOs per service (data age, completeness, latency); metrics, structured logs and traces with propagated identifiers; burn-rate pages and slow-burn tickets; on-call rotations with runbooks that start with exposure; incident command; blameless reviews with tracked actions; replayed incidents as tests.
What the interviewer is looking for: SLOs, burn rates, incident practice.