The Interview Book · Careers
20Research Case Studies and Take-Homes
The e-mail arrives at nine: a file of 156 040 minute records of quotes and trades for twenty stocks, one sentence (“Is there anything predictable here?”) and a four-hour deadline. The submission that wins is not the one with the most models. It is the one whose first page says what was checked, what was found, how sure the author is, and what she would do with another week. A research case study is the closest an interview comes to the job itself, and it is scored the way a research review scores a result (One Quant Book 7, chapter 1): on the question asked, the honesty of the test and the clarity of the conclusion.
20.1 What a reviewer reads first: the memo
Definition 20.1 (Take-home assignment, research case study)
A take-home assignment is an interview task done by the candidate outside the interview, under a deadline of hours or days, with a dataset or a specification and a written deliverable. A research case study is a take-home or in-person exercise in which the candidate investigates an open question on supplied data and presents a conclusion, and is assessed on the investigation as much as on the result.
Reviewers read the first page and decide how much of the rest to read. The first page must stand alone.
Method 20.2 (The one-page memo)
- Question: the one precise question investigated, and why it was chosen.
- Data: what was checked and fixed (duplicates, crossed quotes, corporate actions, gaps, time zones), with counts.
- Result: the estimate with its standard error, and one chart.
- Robustness: the two or three checks that could have killed it, and what they showed.
- So what: whether it is economically meaningful after costs, and what you would do next.
- Limits: what you did not do and why. Code in an appendix that runs from a clean checkout.
20.2 The four hours
Most candidates spend the time on models; most failures come from data. A plan that works: thirty minutes on data checks, thirty on choosing one clean question, ninety on one honest test with its robustness checks, forty-five on the memo, fifteen on re-running the code from scratch. A second question is started only if the first is finished.
Example 20.3 (The data checks on the hook’s file)
The chapter’s generated dataset (iv_case.py) contains three planted defects that the standard checks find: 40 duplicated (stock, day, minute) records, 15 rows with the bid above the ask (swapped fields), and a jump of about 50% in one stock’s price between two days that is a 2-for-1 split not adjusted in the data. Each is fixed and counted in the memo. A candidate who computes daily returns without finding the split reports a day.
20.3 Two worked case studies with a reviewer’s comments
Case one: does order-book imbalance predict the next minute? The question chosen from “anything predictable”: the slope of the next minute’s mid-price return on the current imbalance, pooled over stocks. On the cleaned data the slope is 0.48 basis points per unit of imbalance with a standard error of 0.022 clustered by stock-day, a -statistic near 22, and the decile means line up with it (Figure 20.1). The memo then asks what the effect is worth: the strongest decile predicts about 0.45 basis points, against a round trip of 6 basis points of spread.
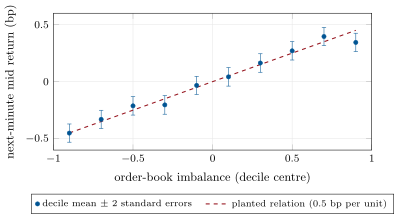
fig_iv_case.py.Remark 20.4 (Reviewer’s comments on case one)
Strong: the data section counts and fixes the three defects; the returns are computed from mid prices, not trades, and the memo explains why (trade prices bounce between bid and ask, which gives trade-price returns a lag-one autocorrelation of about here, against zero for mid prices; Roll’s model of the bounce, One Quant Book 4, chapter 21); the standard error is clustered. Strongest of all: the “so what” paragraph says the effect cannot pay a crossing strategy and asks whether it could improve the timing of passive orders instead. Missing: a split of the sample in time, and a check that the effect is not driven by one stock.
Case two: a calendar effect. A second candidate tests mean returns by weekday and month, 60 cells, finds one cell with and writes a memo about “the March-Tuesday effect”. With 60 independent null cells the chance that at least one reaches is about 11%, and a Bonferroni threshold for 60 cells at 5% is .
Remark 20.5 (Reviewer’s comments on case two)
The analysis is competent and the conclusion is wrong: the memo reports the best of 60 tests as if it were the only one. A good memo says “I tested 60 cells; one exceeded the nominal threshold, as expected by chance about one time in nine; nothing survives a multiple-testing correction; I found no calendar effect.” A null result stated with its power is a good result (One Quant Book 4, chapter 12).
20.4 Presenting and defending the result
A take-home is often followed by a presentation in which reviewers challenge the result. The questions are predictable: is it the bid-ask bounce, is it one stock or one day, is it there out of sample, what does it cost to trade, how many things did you try. The best defence is to have asked them first and to put the answers on the memo’s first page. When a challenge is right, concede it and quantify its effect; a candidate who revises a conclusion under good questioning scores better than one who defends a weak one.
20.5 Worked answers
Example 20.6 (How much data the question needs)
“Before you start: if the effect you are looking for is 0.2 basis points of next-minute return per unit of signal, the signal has unit variance and the residual standard deviation is 5 basis points, how many independent minutes do you need to see it at ?” The slope’s standard error is about , so needs : minutes, about fourteen and a half days of one stock’s 390-minute sessions if the minutes were independent. They are not (minutes of one day share news and liquidity), so the file of twenty stocks and one week is borderline, and the memo should say so before it reports anything. Computing the sample the question needs, in the first ten minutes, decides what question the four hours can answer.
20.6 Question bank
Interview question 20.1 ★ researcher, mle • systematic fund
You receive a file of minute quotes and trades for twenty stocks. List the data checks you run in the first thirty minutes, in order.
Solution
Solution of Interview question 20.1.
Row counts per stock and day (gaps, a short day); duplicated keys; bid above ask and zero or negative spreads; trade prices outside the quotes; jumps in the daily close that match split ratios or dividends; time zone and session boundaries; the distribution of each field for outliers. Count what each check finds, fix it or drop it, and record the decision.
What the interviewer is looking for: a systematic, counted checklist before any analysis.
Interview question 20.2 ★ researcher • any
What goes on the first page of a take-home memo, and what goes in the appendix?
Solution
Solution of Interview question 20.2.
First page: the question, the data checks and fixes with counts, the result with its standard error and one chart, the robustness checks, the economic significance, the limits and next steps. Appendix: code that runs from a clean checkout, further tables, the models that were tried and discarded (listed, so the reviewer can judge multiple testing).
What the interviewer is looking for: a first page that stands alone and an appendix that makes the work reproducible.
Interview question 20.3 ★ researcher, trader • market maker
The prompt is “Is there anything predictable here?”. Turn it into one clean question you can answer in four hours, and say why you chose it.
Solution
Solution of Interview question 20.3.
“Does the order-book imbalance at the end of a minute predict the mid-price return over the next minute, pooled across the twenty stocks?” It uses the data’s richest field, has a clear economic mechanism (pressure on one side of the book), a testable sign, and an obvious economic check (the size of the effect against the spread). A vaguer question (“fit a model to everything”) cannot be finished honestly in four hours.
What the interviewer is looking for: a precise, falsifiable question with a mechanism and a cost check.
Interview question 20.4 ★ researcher, mle • systematic fund
Your four hours produced no significant effect. How do you write it up?
Solution
Solution of Interview question 20.4.
As a result: the question, the test, its power (the smallest effect it could have detected), the checks that were run, and the conclusion that no effect larger than that bound exists in this sample. Then what you would try next and why. A clean null with its power is more useful to a reviewer than a weak positive with no robustness.
What the interviewer is looking for: reporting a null with its power, not apologising for it.
Interview question 20.5 ★★ researcher, developer • systematic fund
In the chapter’s dataset, what do the three standard checks find, and how do you fix each defect? What goes wrong if you miss the split?
Solution
Solution of Interview question 20.5.
40 duplicated (stock, day, minute) records: drop the duplicates. 15 rows with the bid above the ask: swap the fields (or drop them if the cause is unclear). One stock whose price halves between two days: an unadjusted 2-for-1 split; multiply earlier prices by one half, or later ones by two, consistently. Missing the split does not affect within-day minute returns, but any daily return, rolling feature or volatility estimate across the split date shows a spurious 50% fall.
What the interviewer is looking for: finding each defect by a check, fixing it, and knowing which analyses it would corrupt.
Interview question 20.6 ★★ researcher • market maker
You regress the next minute’s mid return on imbalance and get 0.48 basis points per unit with a clustered standard error of 0.022. Why cluster, and by what? Is the effect real?
Solution
Solution of Interview question 20.6.
Returns within a stock-day share shocks and the regressor is persistent within the day, so the errors are not independent; cluster by stock-day (or by day across stocks if there are common shocks). : the effect is real in the statistical sense, and on the chapter’s data it matches the planted 0.5 within its error. Whether it matters is a separate question (Interview question 20.10).
What the interviewer is looking for: the clustering rationale and the separation of statistical from economic significance.
Interview question 20.7 ★★ researcher, trader • market maker
Returns computed from trade prices show a lag-one autocorrelation of ; from mid prices, zero. Explain, and give the formula that predicts from a half-spread of 3 basis points and a minute volatility of 5.
Solution
Solution of Interview question 20.7.
Trades alternate at random between bid and ask, so a trade-price return contains the change in the side, which reverses: the bid-ask bounce. With half-spread and mid-return volatility , the trade-price return is with independent random sides, so the lag-one covariance is and the correlation . Mid prices have no bounce, so their autocorrelation is zero. A reversal “signal” built from trade prices would be this artefact.
What the interviewer is looking for: Roll’s model and the formula, and the practical lesson.
Interview question 20.8 ★★ researcher, mle • any
How do you split four hours between data, analysis and writing, and what do you leave out?
Solution
Solution of Interview question 20.8.
About 30 minutes of data checks, 30 of choosing the question, 90 of one test with its robustness checks, 45 of writing and 15 of re-running the code from scratch. Leave out: a second model family, hyperparameter searches, and any analysis you could not finish and check. State what was left out in the memo.
What the interviewer is looking for: a plan weighted towards data and writing, and discipline about scope.
Interview question 20.9 ★★ researcher • multi-manager fund
A reviewer reads two memos on the same data: one fits five models and reports the best ; one tests one hypothesis with robustness checks and finds a small effect. Which scores higher, and what would you write in the margin of each?
Solution
Solution of Interview question 20.9.
The second. Margin of the first: “best of five, no out-of-sample test, no costs, what was the data check?”. Margin of the second: “clear question, honest test, small effect correctly sized; next, split in time and by stock”. Reviewers hire for judgement, and the first memo shows none.
What the interviewer is looking for: the reviewer’s perspective: judgement over model count.
Interview question 20.10 ★★★ researcher, trader • market maker
The imbalance effect is 0.5 basis points per unit of imbalance and the spread is 6 basis points. Can a strategy that crosses the spread trade it? If not, how could the effect still be worth money?
Solution
Solution of Interview question 20.10.
No: even in the top decile the expected move is about basis points, less than a tenth of the 6 basis points a round trip crossing the spread costs. It can still be worth money as an input: to decide when to post passive orders (post on the side the imbalance favours), to skew a market maker’s quotes, or to time the execution of trades made for other reasons; the value is then measured in execution cost saved, not in standalone P&L.
What the interviewer is looking for: comparing the effect with costs, and finding where a small effect is useful.
Interview question 20.11 ★★★ researcher • systematic fund
A candidate reports a “March-Tuesday effect” with after testing 60 weekday-month cells. What is the chance of such a result with no effect at all, and what threshold would Bonferroni use?
Solution
Solution of Interview question 20.11.
Each null cell exceeds with probability about 0.0019; over 60 independent cells, . Bonferroni at 5% requires , that is , which 3.1 does not reach. There is no evidence of a calendar effect.
What the interviewer is looking for: the family-wise chance and the corrected threshold.
Interview question 20.12 ★★★ researcher, mle • multi-manager fund
In the presentation, a reviewer says: “It is one stock and one week.” How do you answer with data in five minutes, and what do you concede if the reviewer is right?
Solution
Solution of Interview question 20.12.
Show the estimate by stock (a dot plot with standard errors) and by week or day (a rolling estimate), and the pooled estimate with each stock left out in turn. If the effect is spread across stocks and time, say so with the chart. If the reviewer is right and one stock or one week drives it, concede, report the estimate without it, and reframe the conclusion as a finding about that stock or episode, with the smaller sample’s uncertainty.
What the interviewer is looking for: robustness shown with data, and a gracious, quantified concession.
Sources and further reading
- R. Roll, “A simple implicit measure of the effective bid-ask spread in an efficient market”, Journal of Finance 39(4), 1984.
- One Quant Book 7, chapters 1, 3 and 20 (the research process, point-in-time data, overfitting); One Quant Book 4, chapters 12 and 21 (multiple testing; high-frequency econometrics).