
সব বই

পেশাদার

1 Markets I: The Ecosystem and Exchange-Traded Marketsবাজার অনলাইন 2 Markets II: Rates, FX and Creditবাজার অনলাইন 3 Markets III: Commodities, Energy and Cryptoবাজার অনলাইন 4 Quantitative Methodsপদ্ধতি অনলাইন 5 Derivatives and Volatilityডেরিভেটিভস অনলাইন 6 Rates, Credit, XVA and Riskসুদহার, ঋণ ও ঝুঁকি অনলাইন 7 Research Craft: Predictors, Backtests, Measurement, Portfoliosগবেষণা অনলাইন 8 Strategies I: Equities and Futuresকৌশল অনলাইন 9 Strategies II: Volatility, Relative Value, Macro and the Bank Desksকৌশল অনলাইন 10 Microstructure and Executionএক্সিকিউশন অনলাইন 11 Market Making and High-Frequency Tradingমার্কেট মেকিং অনলাইন 12 Machine Learning for Marketsমেশিন লার্নিং অনলাইন 13 Low-Latency Softwareপ্রযুক্তি অনলাইন 14 Networks, Hardware and Trading Infrastructureপ্রযুক্তি অনলাইন 15 Research, Data and Risk Platformsপ্রযুক্তি অনলাইন 16 The Desk and the Firmপ্রতিষ্ঠান অনলাইন 17 The Industry: Firms, Roles and Careersক্যারিয়ার অনলাইন 18 Interviews I: Maths, Probability and Speedক্যারিয়ার অনলাইন 19 Interviews II: Markets, Trading Games and the Final Roundক্যারিয়ার অনলাইন 20 Interviews III: Codeক্যারিয়ার অনলাইন
অ্যাপ পরিচিতি Coach সাইন ইন পড়া শুরু করো

বইগুলো এখনো বাংলা ভাষায় পাওয়া যায় না — ইংরেজি সংস্করণ দেখানো হচ্ছে।

Earth and Space Sciences · পরিভাষা

Normalised diagram কী?

Definition 3.12 University Earth and Space Sciences — Year 2 · অধ্যায় 3 — Elements in the Earth

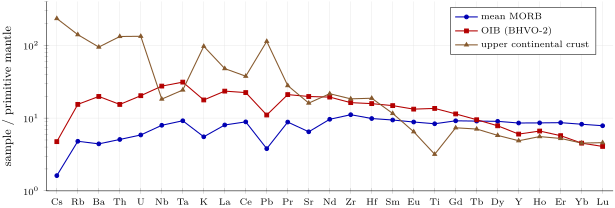
A normalised diagram plots, for a series of elements in a fixed order, the concentration in a sample divided by that in a reference, XN=CX/CXrefX_N = C_X/C_X^{\mathrm{ref}}, on a logarithmic scale. The rare earths are normalised to CI chondrites in the order of atomic number; a longer set of incompatible elements, often called a spider diagram, is normalised to the primitive mantle and ordered by decreasing incompatibility in mantle melting.
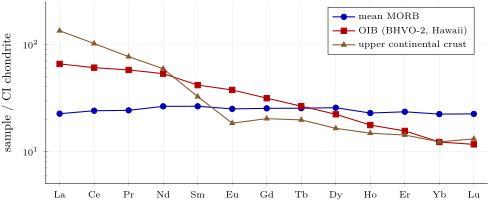
Rare earth patterns normalised to CI chondrites (thulium left out, for want of a MORB value). The mean MORB is flat, slightly poorer in the light rare earths; the Hawaiian basalt is enriched in them; the upper crust is strongly enriched in them, with a negative europium anomaly. Data: Gale and others (2013); USGS BHVO-2 sheet; Rudnick and Gao; Lodders (2003).
Incompatible elements normalised to the primitive mantle, from the most incompatible on the left. The continental crust shows the high LILE, the deep troughs at niobium, tantalum and titanium and the lead peak inherited from subduction-zone melting; the Hawaiian basalt shows a hump at niobium and tantalum. Potassium and titanium computed from the oxides. Data: as for the rare earth figure; McDonough and Sun (1995).
প্রসঙ্গসহ পড়ো →