All books

Professional

Apps About Coach Log in Start reading

Chemistry · Glossary

What is Wavenumber, transmittance, fingerprint region?

Also known as: wavenumber · transmittance · fingerprint region

Definition 17.3 University Chemistry — Year 1 · Chapter 17 — Spectroscopy for Structure

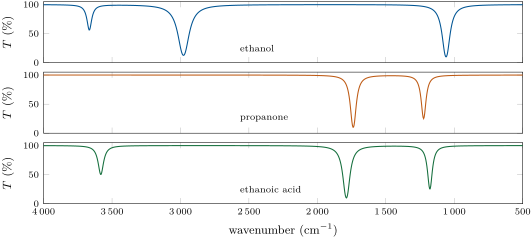
Infrared spectra are plotted against the wavenumber ν~=1/λ\tilde\nu = 1/\lambda, in cm−1\mathrm{cm}^{-1}, proportional to the energy of the photon. The ordinate is the transmittance T=I/I0T = I/I_0, in per cent, so that bands point downwards. Below about 1500 cm−11500\,\mathrm{cm}^{-1} many overlapping bands, characteristic of the whole molecule rather than of one bond, form the fingerprint region.

moleculebondν~\tilde\nu (cm−1\mathrm{cm}^{-1})
ethanolO–H3666
ethanolC–H2978
ethanolC–O1060
propanoneC=O1738
ethanoic acidO–H3582
ethanoic acidC=O1788
ethyl ethanoateC=O1764
ethyl ethanoateC–O1238
Band maxima in gas-phase infrared spectra. In liquids, hydrogen bonds broaden the O–H bands and move them to lower wavenumbers, and the C=O bands of acids move down as the acid pairs up.
Infrared spectra of ethanol, propanone and ethanoic acid, simulated from the measured band positions of the table (band heights and widths schematic). The C=O band near 1750\, cm-1 and the O–H band above 3500\, cm-1 tell the three functional groups apart at a glance.
Infrared spectra of ethanol, propanone and ethanoic acid, simulated from the measured band positions of the table (band heights and widths schematic). The C=O band near 1750 cm−11750\,\mathrm{cm}^{-1} and the O–H band above 3500 cm−13500\,\mathrm{cm}^{-1} tell the three functional groups apart at a glance.
Read in context →