
Physics · Glossary

What is The Hertzsprung–Russell diagram?

Definition 27.2 University Physics — Year 3 · Chapter 27 — Astrophysics

Plot stars by surface temperature (hot on the left, by convention) against luminosity, both from Chapter 20’s blackbody laws, and they refuse to scatter: ninety percent crowd onto the main sequence, the diagonal band of hydrogen-burners, ordered purely by mass — heavier means hotter and disproportionately brighter (LM3.5L \propto M^{3.5}), hence shorter-lived (tM/LM2.5t \propto M/L \propto M^{-2.5}: Exercise 27.4). Off the band live the plot’s exceptions and endings: cool but enormous giants (top right), and hot but tiny white dwarfs (bottom left) — because at fixed temperature, by L=4πR2σT4L = 4\pi R^2\sigma T^4, luminosity is a measure of size. The HR diagram is not a map of kinds but of ages: a star’s dot drifts across it as its fuel runs down.
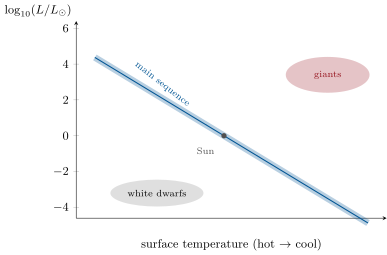
The Hertzsprung–Russell diagram. The main sequence is the hydrogen-burning band, a mass ladder read top-left (blue, profligate, dead in megayears) to bottom-right (red, frugal, outliving the universe so far). Giants and white dwarfs are not oddities but chapters: the same star visits all three regions.
Read in context →