
All books

Professional

Apps About Coach Log in Start reading

Chemistry · Glossary

What is Bubble and dew curves?

Also known as: bubble curve · dew curve · bubble point · dew point

Definition 7.2 University Chemistry — Year 2 · Chapter 7 — Binary Liquid–Vapour Diagrams and Distillation

On a liquid–vapour diagram, the bubble curve gives the composition of the liquid in equilibrium with vapour, the dew curve that of the vapour in equilibrium with liquid. For a mixture of given composition at fixed pressure, the bubble point is the temperature at which the first bubble of vapour appears on heating, the dew point the temperature at which the first drop of liquid appears on cooling the vapour.
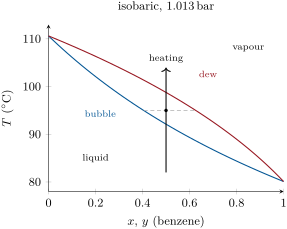
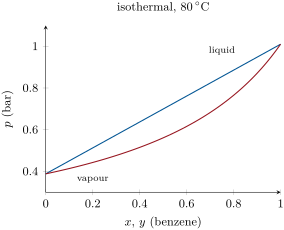
Benzene–toluene, computed from Raoult’s law and the Antoine equations. Left, at atmospheric pressure: bubble curve (blue) and dew curve (red); the liquid of composition 0.5 starts to boil at 92.1 C and is all vapour at 98.8 C; at 95 C (dashed tie line) it is split into a liquid of 0.405 and a vapour of 0.626. Right, at 80 C: the bubble curve is straight, the dew curve a hyperbola, the liquid now on top. Benzene–toluene, computed from Raoult’s law and the Antoine equations. Left, at atmospheric pressure: bubble curve (blue) and dew curve (red); the liquid of composition 0.5 starts to boil at 92.1 C and is all vapour at 98.8 C; at 95 C (dashed tie line) it is split into a liquid of 0.405 and a vapour of 0.626. Right, at 80 C: the bubble curve is straight, the dew curve a hyperbola, the liquid now on top.
Benzene–toluene, computed from Raoult’s law and the Antoine equations. Left, at atmospheric pressure: bubble curve (blue) and dew curve (red); the liquid of composition 0.5 starts to boil at 92.1∘C92.1{}^{\circ}\mathrm{C} and is all vapour at 98.8∘C98.8{}^{\circ}\mathrm{C}; at 95∘C95{}^{\circ}\mathrm{C} (dashed tie line) it is split into a liquid of 0.405 and a vapour of 0.626. Right, at 80∘C80{}^{\circ}\mathrm{C}: the bubble curve is straight, the dew curve a hyperbola, the liquid now on top.
Read in context →