University Chemistry — Year 2 · Bachelor Year 2
7Binary Liquid–Vapour Diagrams and Distillation
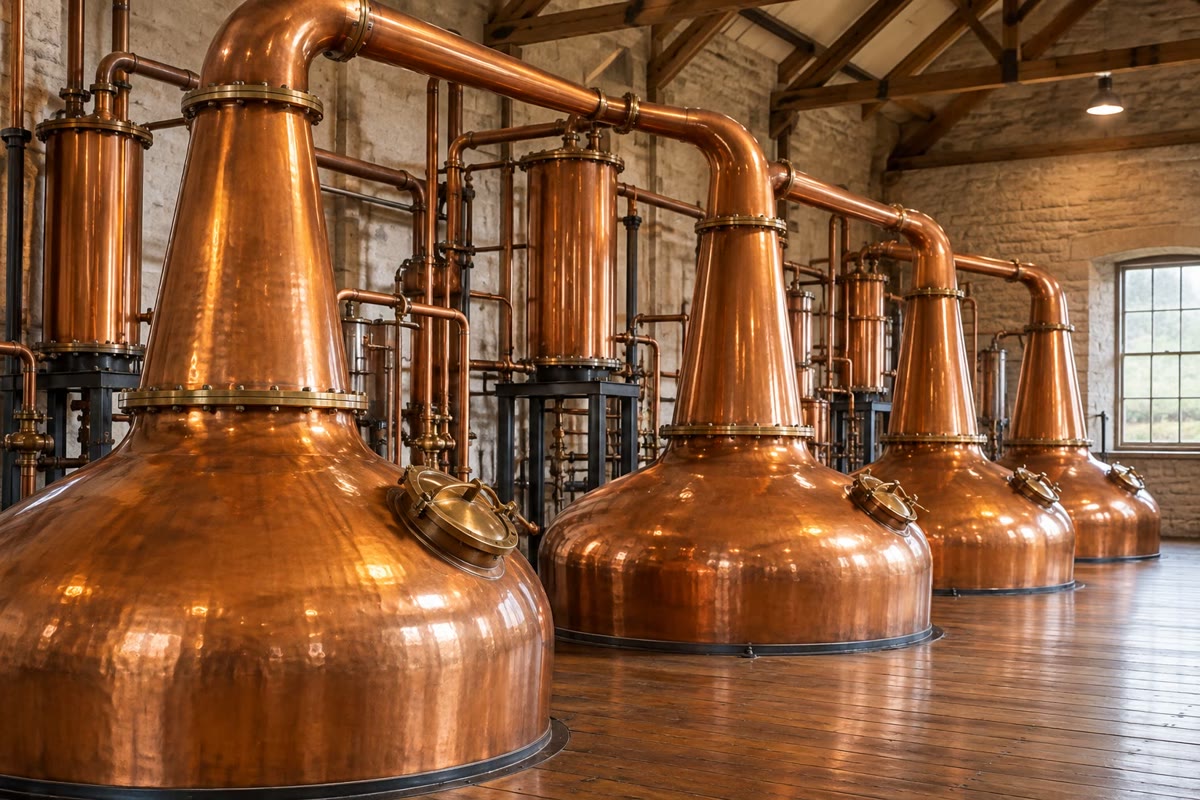
A copper still turns a wine of a few per cent of alcohol into a spirit many times stronger; a refinery column splits crude oil into its cuts, from gas to heavy fuel. Both rely on one fact: the vapour over a boiling mixture is richer in the more volatile component than the liquid. Repeat the evaporation and condensation enough times and the separation becomes as sharp as wanted — with one exception: no distillation, however long the column, takes ethanol beyond about 95 per cent by mass. This chapter draws the diagrams that say how a mixture of two liquids boils, and uses them to design a column and to see where it must stop.
You already know
Chapter 3: the chemical potential, Raoult’s law and the ideal mixture, activity coefficients and deviations from Raoult’s law, the Gibbs–Duhem relation. Chapter 4: the variance. The Year 1 volume, on laboratory techniques: simple distillation, miscible and immiscible liquids. The school volume: distillation and hydrodistillation.
7.1 Ideal mixtures
In this chapter the two liquids are numbered 1 (the more volatile, of lower boiling point) and 2; is the mole fraction of 1 in the liquid, its mole fraction in the vapour, which is treated as an ideal gas.
Definition 7.1 (Binary diagram)
A binary diagram shows, for a mixture of two components, which phases are present and with which compositions, as a function of the overall composition and of one other variable. An isobaric diagram is drawn in the plane (composition, temperature) at fixed pressure; an isothermal diagram in the plane (composition, pressure) at fixed temperature.
Definition 7.2 (Bubble and dew curves)
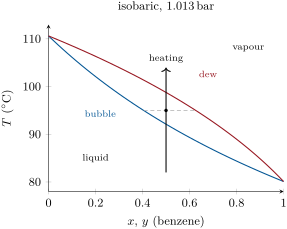
On a liquid–vapour diagram, the bubble curve gives the composition of the liquid in equilibrium with vapour, the dew curve that of the vapour in equilibrium with liquid. For a mixture of given composition at fixed pressure, the bubble point is the temperature at which the first bubble of vapour appears on heating, the dew point the temperature at which the first drop of liquid appears on cooling the vapour.
Proposition 7.3 (Ideal curves)
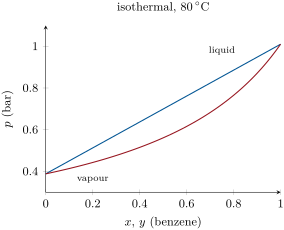
For an ideal mixture at temperature , with and the vapour pressures of the pure liquids, the bubble curve of the isothermal diagram is the straight line , and the dew curve is the hyperbola
Proof. Raoult’s law gives the partial pressures and ; their sum is the total pressure, linear in . In the vapour, , so and ; adding, . ∎
Proposition 7.4 (The vapour is richer in the more volatile component)
For an ideal mixture with and , .
Proof. with since is a weighted mean of and , strictly between them. Hence . ∎
The isobaric diagram is the one that describes a distillation, which runs at atmospheric pressure. It has no simple formula: for each temperature between the two boiling points, and are computed (here with the Antoine equation, , fitted to measured vapour pressures), and then the liquid and vapour compositions that give a total pressure of :
The bubble curve is no longer straight; the dew curve still lies above it, the vapour still richer in the light component.
Example 7.5 (Benzene and toluene at )
Benzene and toluene form a nearly ideal mixture. At the Antoine equations give (benzene) and (toluene). At : and . A liquid of 57.5 % benzene (in moles) boils at and gives a vapour of 77 %.
7.2 Reading a diagram
Proposition 7.6 (Variance of a two-phase binary)
A mixture of two components in two phases has variance 2. At fixed pressure the temperature alone fixes the compositions of both phases: they are read at the ends of the horizontal segment through the representative point, called a tie line.
Proof. Intensive variables: , , , . Relations: equality of the chemical potentials of 1 and of 2 between the phases. (the phase rule gives the same with , , ). Fixing leaves one degree of freedom: and are the two curves. ∎
Theorem 7.7 (Lever rule)
A mixture of overall composition , split into a liquid of composition and a vapour of composition , contains amounts of liquid and of vapour such that
This is the lever rule: each phase is the more abundant the closer its composition is to the overall one, like the weights on a lever pivoting at .
Proof. Conservation of component 1: , so ; divide by and rearrange. ∎
The lever rule holds with mole fractions and amounts, as here, or with mass fractions and masses: the conservation used is the same.
Method 7.8 (Reading a binary diagram)
- Place the point (overall composition, temperature) and name its domain: liquid, vapour, or liquid + vapour.
- In a two-phase domain, draw the tie line through the point; its ends give the compositions of the liquid (on the bubble curve) and of the vapour (on the dew curve).
- Get the proportions of the phases from the lever rule.
- To follow a heating, move the point upwards: the first bubble appears on the bubble curve, the last drop disappears on the dew curve; between them the liquid grows poorer in the light component.
Example 7.9 (A flash at )
of an equimolar benzene–toluene mixture are brought to at atmospheric pressure. The tie line gives , ; the vapour fraction is : of vapour holding of benzene, of liquid holding . One equilibrium stage enriches, but only a little.
7.3 Real mixtures and azeotropes
When the activity coefficients differ from 1 (Chapter 3), the partial pressures depart from Raoult’s straight lines. With a positive deviation (: unlike molecules attract each other less than like ones) the total pressure lies above the ideal line; with a negative deviation below. If the deviation is strong enough, the total pressure goes through an extremum.
Definition 7.10 (Azeotrope)
An azeotrope is a liquid mixture that boils without changing composition: the vapour it gives has its own composition. A positive azeotrope (positive deviation) has a maximum of pressure on the isothermal diagram and a minimum of boiling temperature on the isobaric one; a negative azeotrope the reverse.
Theorem 7.11 (Gibbs–Konovalov)
On a binary liquid–vapour diagram, at an extremum of the total pressure (at fixed temperature) or of the boiling temperature (at fixed pressure), the liquid and the vapour have the same composition. Conversely, where the two compositions are equal, the curves have a common horizontal tangent.
Proof at fixed temperature. The Gibbs–Duhem relation for the liquid at fixed (the small effect of on the liquid neglected) is . At equilibrium with , , so
As increases with (otherwise the liquid would be unstable), exactly where . The isobaric case follows from a similar calculation that keeps the temperature dependence of the ; it is not carried out here. ∎
The formula says more: where , the pressure increases with — adding the component that is enriched in the vapour makes the liquid more volatile, which is Konovalov’s first law.
Example 7.12 (Ethanol and water)
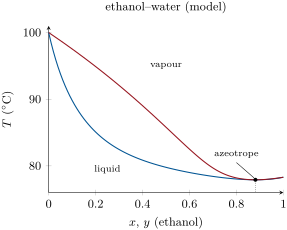
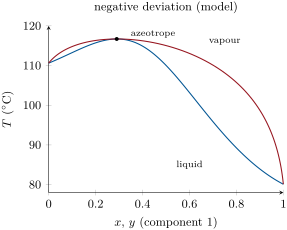
Ethanol and water deviate positively from Raoult’s law and form an azeotrope of 95 % ethanol by mass at atmospheric pressure. With and , its mole fraction of ethanol is
It boils a little below pure ethanol (). The diagram below is computed from a one-parameter activity model, , , whose parameter () is fitted so that the azeotrope falls at that composition: the model reproduces the shape, and places the azeotrope at .
7.4 Fractional distillation
Definition 7.13 (Fractional distillation)
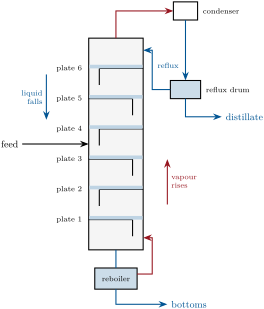
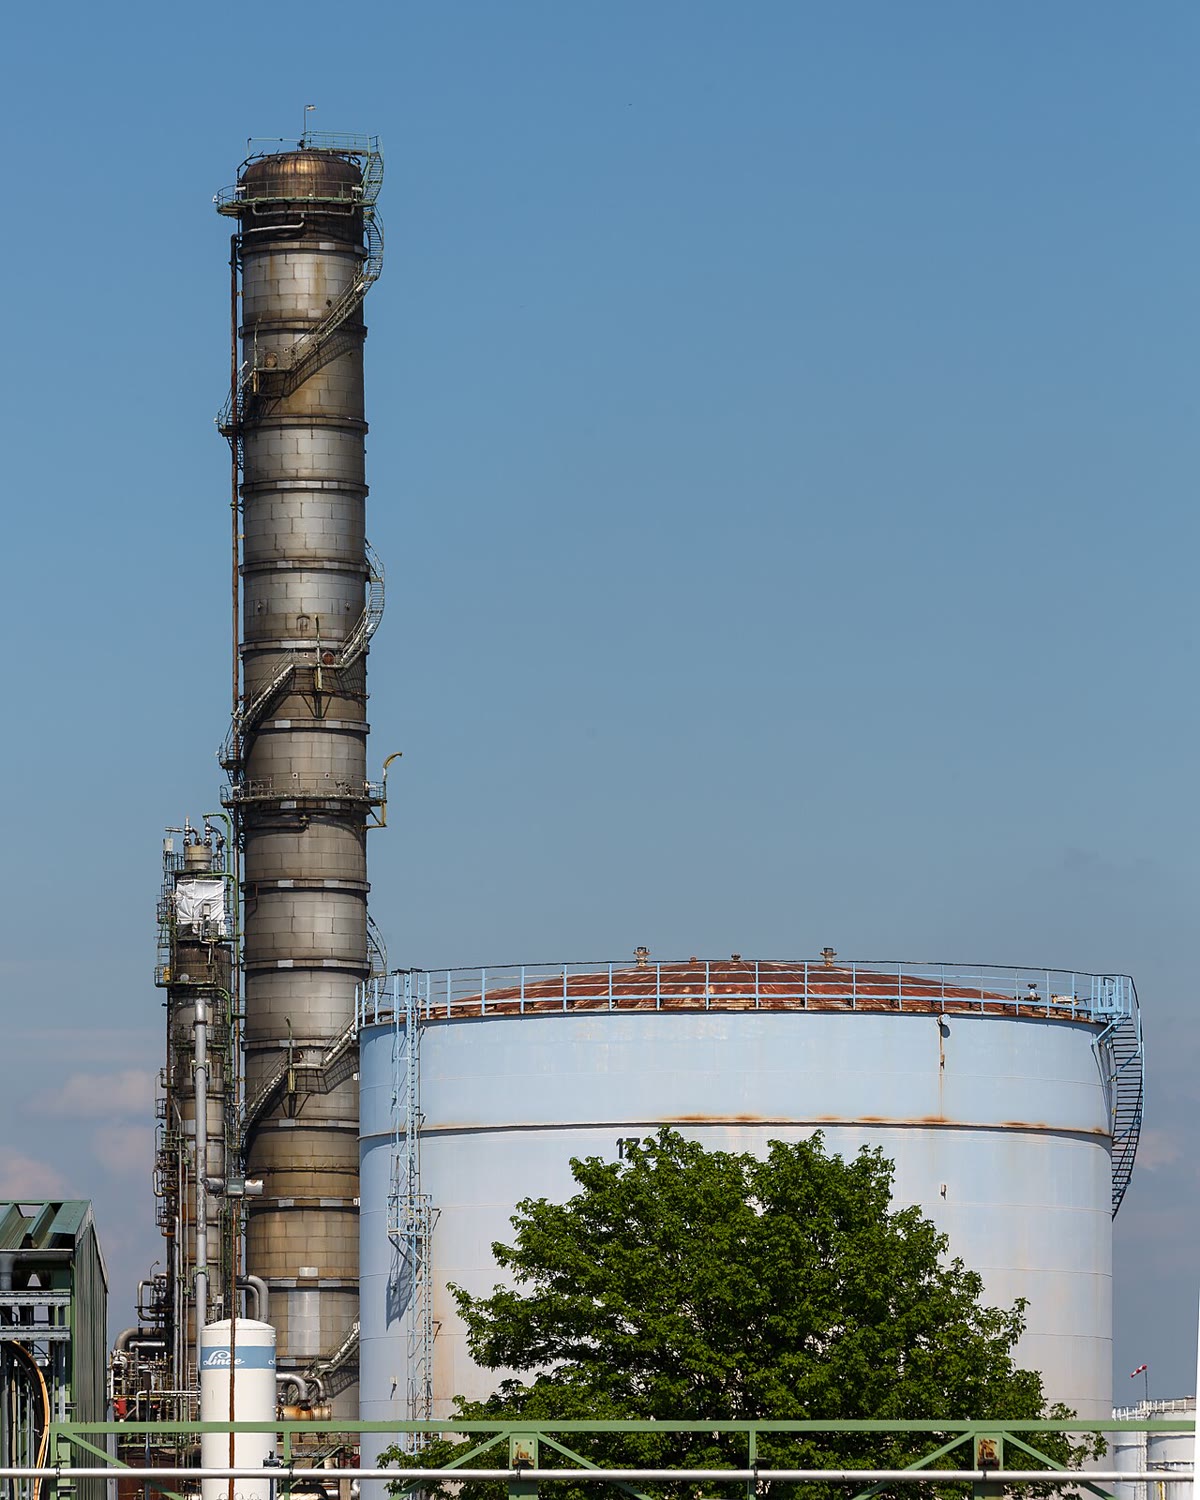
Fractional distillation separates the components of a liquid mixture in a column where a rising vapour and a descending liquid are brought into repeated contact. A theoretical plate is a stage of the column whose leaving vapour and liquid are in equilibrium with each other. The reflux ratio is the ratio of the amount of condensate returned to the top of the column to the amount drawn off as distillate.
On each plate the vapour from below bubbles through the liquid from above; it leaves richer in the light component, the liquid poorer. At the top the vapour is condensed, part of it returned as reflux, the rest drawn off as the distillate; at the bottom a reboiler boils part of the liquid. At total reflux nothing is drawn off: the column then works at its best, and the vapour leaving a plate has the composition of the liquid coming down on it.
For an ideal pair, the relative volatility changes little over the column: from 2.60 at the boiling point of benzene to 2.35 at that of toluene. On each theoretical plate
Proposition 7.14 (Fenske)
At total reflux, with a constant relative volatility , the number of theoretical plates needed to go from a bottom liquid to a distillate is at least
Proof. Number the plates from the bottom, the reboiler being plate 1. At total reflux the liquid coming down on plate has the composition of the vapour leaving plate : . With , each plate gives , so , and after plates the condensed vapour has . Taking logarithms gives . With a finite reflux, the liquid flowing down is leaner than the vapour rising, each plate enriches less, and more plates are needed. ∎
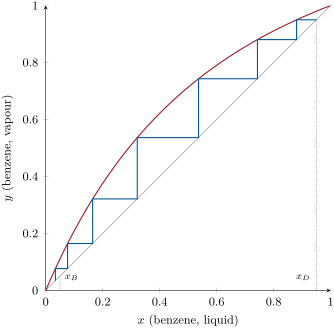
On the diagram the same construction is a staircase between the equilibrium curve and the diagonal : each step is one theoretical plate.
Proposition 7.15 (A column cannot cross an azeotrope)
In a mixture with an azeotrope, a column fed on one side of the azeotropic composition delivers at best the azeotrope at one end and the pure component of that side at the other.
Proof. At the azeotrope the equilibrium curve meets the diagonal: . Near it each step of the staircase becomes vanishingly small, so no finite number of plates reaches it, and none crosses it. ∎
Method 7.16 (Predicting a fractional distillation)
- Find the lowest-boiling point accessible from the feed on the isobaric diagram: a pure component or a positive azeotrope. It comes out at the top.
- The highest-boiling point on the same side (pure component or negative azeotrope) remains in the boiler.
- With an azeotrope, look on which side of it the feed lies: only that side’s pure component can be obtained.
- For the number of plates, use Fenske’s formula or the staircase, then add plates for the finite reflux actually used.
For ethanol and water fed at less than 0.881, the top delivers at best the azeotrope and the bottom water: no column gives absolute ethanol. Drying the last per cent needs another method — a molecular sieve that adsorbs water, or a third component added to break the azeotrope.
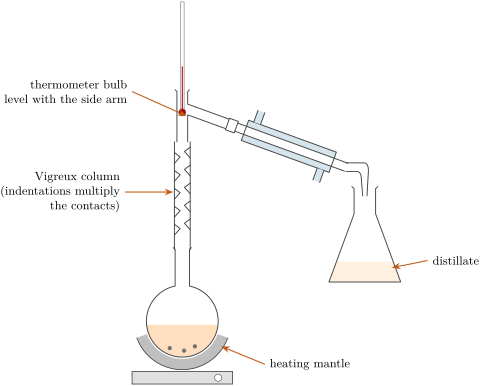
In the lab — Separating two liquids by fractional distillation
The flask is filled to half at most, with boiling stones, and heated gently so that the ring of condensing vapour climbs the column slowly: a column flooded by fast heating loses its plates. The head temperature is noted every few millilitres; the receiver is changed when it starts to rise (a fraction is collected over each temperature step), and heating is stopped before the flask runs dry.
7.5 Partly miscible and immiscible liquids
Definition 7.17 (Miscibility gap)
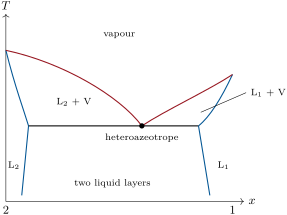
A miscibility gap is the range of overall compositions over which two liquids, at a given temperature, separate into two liquid layers, each saturated with the other component. A heteroazeotrope is the boiling point of such a two-layer liquid: the two liquid layers and the vapour coexist at a fixed temperature and with a fixed vapour composition.
At the heteroazeotrope, two components are in three phases: at fixed pressure the variance is . The temperature stays constant, like at the boiling point of a pure liquid, as long as both layers remain.
Definition 7.18 (Steam distillation)
Steam distillation is the distillation of a liquid immiscible with water by blowing steam through it: the mixture boils below the boiling point of both liquids, and the distillate separates into two layers.
Steam distillation differs from the hydrodistillation of the school volume only in the way the water is brought: steam blown through the material, rather than material boiled in water. The thermodynamics is the same.
Proposition 7.19 (Boiling of two immiscible liquids)
Two immiscible liquids in contact boil at the temperature where the sum of their vapour pressures equals the external pressure, , lower than both boiling points. The distillate contains the two liquids in the mass ratio
Proof. Each pure liquid exerts its own vapour pressure, whatever the amount of the other: the total pressure over the two layers is , which reaches at a temperature where each is smaller than . In the vapour the amounts are proportional to the partial pressures, ; multiply by . ∎
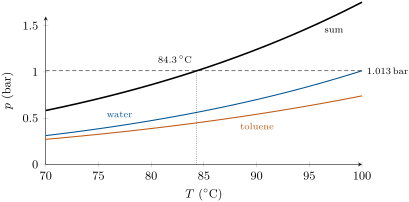
The heavy, fragile molecules of plant essences distil in this way at slightly under , far below their own boiling points, with little decomposition; the price is a distillate that is mostly water.
7.6 Exercises
Exercise 7.1 ★
On the isobaric benzene–toluene diagram, read the boiling points of the pure liquids, the bubble point of a liquid of composition 0.2 and the composition of its first vapour.
Solution
Solution of Exercise 7.1.
Benzene , toluene . The liquid of composition 0.2 starts to boil at about ; its first vapour has composition 0.38.
Exercise 7.2 ★
At the vapour pressures of benzene and toluene are and . Compute, for an equimolar liquid, the pressure at which it starts to boil and the composition of the vapour.
Solution
Solution of Exercise 7.2.
; .
Exercise 7.3 ★
of a mixture of overall composition 0.30 are at a temperature where the liquid has composition 0.20 and the vapour 0.45. Compute the amounts of each phase.
Solution
Solution of Exercise 7.3.
: of vapour and of liquid. Check: .
Exercise 7.4 ★
Compute the variance of a benzene–toluene mixture (a) all liquid; (b) boiling; (c) at an azeotrope, for a pair that has one, at fixed pressure.
Exercise 7.5 ★★
Find by trial the dew point of a benzene–toluene vapour of composition 0.30 at , using and (): 1.80 and 0.742 at , 2.057 and 0.861 at . Give the composition of the first drop.
Solution
Solution of Exercise 7.5.
At the dew point . At : (too cold); at : . Interpolating, . The first drop has .
Exercise 7.6 ★★
An equimolar benzene–toluene mixture is simply distilled (no column). What is the composition of the first drops of distillate? How do the temperature and the composition of the distillate change as the distillation proceeds? Why is the separation poor?
Solution
Solution of Exercise 7.6.
The first drops have the composition of the vapour over the boiling liquid, , at . As benzene leaves preferentially, the liquid grows poorer in it, its boiling point rises and the distillate grows poorer too; the last drops are almost pure toluene. Simple distillation is a single equilibrium stage, repeated on a liquid that keeps changing: each fraction is a mixture.
Exercise 7.7 ★★
A wine of mole fraction 0.05 in ethanol is fractionally distilled with a very efficient column. What comes out at the top, and what stays in the boiler? Same question for a mixture of mole fraction 0.95.
Exercise 7.8 ★★
A component of a plant essence (molar mass ) has a vapour pressure of near , where that of water is (exercise data). At what temperature does the steam distillation run under , and how many grams of essence are collected per gram of water?
Solution
Solution of Exercise 7.8.
The mixture boils when , that is , near . Mass ratio : of essence per gram of water.
Exercise 7.9 ★★
On the schematic diagram of the partly miscible liquids, describe what happens when a two-layer mixture of overall composition 0.4 is heated from room temperature until it is all vapour: phases, temperatures, and the composition of the first vapour.
Solution
Solution of Exercise 7.9.
At room temperature, two layers L and L (composition 0.4 lies in the gap). On heating, the layers boil together at the heteroazeotrope temperature, which stays constant; the first vapour has the heteroazeotropic composition (the dot). Since 0.4 lies on the L side of the dot, the layer L is used up first; the temperature then rises, the remaining L grows poorer in 1 along its bubble curve and the vapour follows the dew curve, until the point reaches the dew curve: the last drop evaporates.
Exercise 7.10 ★★★
With , compute the minimum number of theoretical plates for a distillate of 0.99 and a bottom of 0.01. Compare with the 6.5 needed for 0.95 and 0.05, and comment on the cost of purity.
Solution
Solution of Exercise 7.10.
, against 6.5: going from 95 % to 99 % purity at both ends costs more than half as many plates again. Each extra factor on costs the same number of plates, and purity is measured by the impurity left, which falls only geometrically.
Exercise 7.11 ★★★
From the isobaric diagram of benzene–toluene and the Antoine equations, explain how the isothermal diagram at is obtained, and why on it the liquid domain is at the top.
Solution
Solution of Exercise 7.11.
The isobaric diagram alone does not give it: one needs and at , from the Antoine equations (1.010 and ). Then and . The liquid is stable at high pressure (compressing a vapour condenses it), at low temperature on the isobaric diagram: the two diagrams are upside down with respect to each other.
Exercise 7.12 ★★★
Starting from the relation , show that at fixed temperature the total pressure increases with wherever the vapour is richer in component 1 than the liquid, and deduce that an ideal mixture has no azeotrope.
Solution
Solution of Exercise 7.12.
Since increases with and , has the sign of : the pressure rises with where the vapour is richer in 1. For an ideal mixture for every (Proposition 7.4): is strictly monotonic, has no extremum, and there is no azeotrope.
7.7 Problem: A Column for Benzene and Toluene
Problem 7.1
Weekend problem — the isobaric diagram of benzene and toluene from the Antoine equations, a flash and the lever rule, the minimum number of plates of a column at total reflux, and the limit an azeotrope sets
Data: Antoine equations, with in kelvins: benzene , , ; toluene , , . Pressure ; benzene and toluene form an ideal mixture. The ethanol–water azeotrope holds 95 % ethanol by mass.
Part I — The diagram.
- Compute the boiling points of benzene and toluene at .
- Compute and at .
- Deduce the compositions of the liquid and of the vapour in equilibrium at .
- Same at (, ).
- Sketch the isobaric diagram from these four points and the pure liquids.
- Find the bubble point of an equimolar liquid, to , by trial between and .
- Compute the variance of the boiling mixture and say what it means for the diagram.
Part II — A flash.
- An equimolar feed is heated to (, ). Compute and .
- For of feed, compute the amounts of liquid and vapour.
- Compute the amount of benzene in each phase and check the balance.
- What fraction of the benzene is recovered in the vapour?
- What happens if the flash is run at ?
- At what temperature is the feed entirely vaporised?
Part III — The column.
- Define the relative volatility and compute it at the boiling point of benzene.
- Compute it at the boiling point of toluene.
- Take the geometric mean as the value for the whole column.
- Show that on a theoretical plate .
- Explain why, at total reflux, the liquid entering a plate has the composition of the vapour leaving the plate below.
- Derive Fenske’s formula.
- Compute the minimum number of theoretical plates for a distillate of 0.95 and a bottom of 0.05.
- Why is a real column given more plates than that?
- On the staircase of the chapter, count the steps and compare.
Part IV — An azeotrope.
- Compute the mole fraction of ethanol in the ethanol–water azeotrope.
- A 0.10 ethanol feed enters a column of fifty plates. What leaves at the top and at the bottom?
- State the minimum number of theoretical plates needed to separate benzene and toluene into 95 % products.
Solution
Solution of Problem 7.1.
1. : benzene , ; toluene , . 2. At : , . 3. ; . 4. ; . 5. Bubble points (0, 110.6), (0.256, 100), (0.575, 90), (1, 80.1); dew points (0, 110.6), (0.455, 100), (0.773, 90), (1, 80.1) — the lens of the figure. 6. : at 0.952, at 1.102; interpolating, ( exactly). 7. , 1 at fixed pressure: each temperature fixes and , which is why the diagram is made of two curves. 8. ; . 9. , . 10. Vapour ; liquid ; total . 11. of the benzene, in a vapour of only 63 %. 12. At the vapour in equilibrium has : the feed point lies above the dew curve, the feed is entirely vapour and nothing is separated. 13. At its dew point, (by the method of Exercise 7.5). 14. ; at , . 15. At , . 16. . 17. and ; divide. 18. Nothing is drawn off: between two plates the vapour going up and the liquid going down carry the same amount of matter and of each component, with , so . 19. With : and , so and ; . 20. . 21. A column must deliver product, so it runs at a finite reflux ratio, which needs more plates; and a real plate does not reach equilibrium (its efficiency is below one). 22. Seven steps, the last ending at 0.034, below 0.05: 6.5 plates in a continuous count, seven whole ones (the reboiler counting as one). 23. . 24. At the top, at best the azeotrope (0.88 in moles); at the bottom, water. Fifty plates do not cross the azeotrope. 25. At total reflux, theoretical plates.