Definition 3.5High School Mathematics · Chapter 3 — Functions
In a coordinate system, the graph (or curve) of f is the set of all points (x,f(x)) for x in the domain. In other words, a point (x,y) lies on the graph exactly when y=f(x).
Reading an image on a graph: start from x=3 on the horizontal axis, go vertically to the curve, then horizontally to the vertical axis to read f(3)=1.25.
Solving f(x)=k graphically: the solutions x1 and x2 are the abscissas of the intersection points of the curve with the horizontal line y=k. Here f(x)≤k holds on [x1,x2], where the curve is below the line.
Examples
Example 3.7
Is the point A(2,5) on the graph of f(x)=x2+1? Compute f(2)=4+1=5: yes, since f(2) equals the y-coordinate of A. The point B(3,8) is not on the graph, because f(3)=10=8.
 Coach
Coach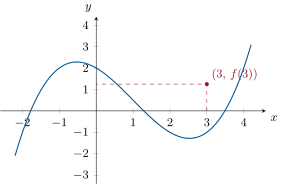
![Solving f(x) = k graphically: the solutions x_1 and x_2 are the abscissas of the intersection points of the curve with the horizontal line y = k. Here f(x) ≤ k holds on [x_1, x_2], where the curve is below the line.](/images/onecourse/chapters/math-2/g10-functions/fig-d26495113fd4.svg)
![A function defined on [-2, 4], increasing then decreasing.](/images/onecourse/chapters/math-2/g10-functions/fig-0353dee9a0b8.svg)