 Coach
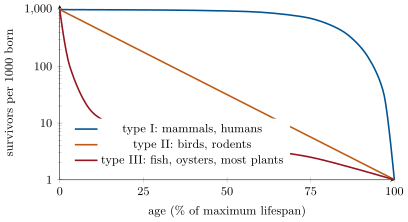
CoachA life table follows a cohort of individuals born together through their lives. For each age it records , the survivorship — the fraction of the cohort still alive at age — and , the fecundity — the mean number of daughters born to a female of age . From them: the mortality between ages, ; the net reproductive rate , the number of daughters a newborn female will have on average in her lifetime; and the generation time , the mean age of the mothers of those daughters. A population with grows, with declines; over one generation it is multiplied by .
Examples
Example 25.6 (A life table for a deer herd)
Of a thousand fawns, six hundred reach their first birthday, and the survivors then lose a tenth of their number each year until few pass nine; does bear from age two, about eight tenths of a daughter a year in their prime. Summing gives : each doe leaves one and a half daughters, and the herd grows by half each generation of about four years — an eleven percent increase per year until something stops it.