সব বই

পেশাদার

1 Markets I: The Ecosystem and Exchange-Traded Marketsবাজার অনলাইন 2 Markets II: Rates, FX and Creditবাজার অনলাইন 3 Markets III: Commodities, Energy and Cryptoবাজার অনলাইন 4 Quantitative Methodsপদ্ধতি অনলাইন 5 Derivatives and Volatilityডেরিভেটিভস অনলাইন 6 Rates, Credit, XVA and Riskসুদহার, ঋণ ও ঝুঁকি অনলাইন 7 Research Craft: Predictors, Backtests, Measurement, Portfoliosগবেষণা অনলাইন 8 Strategies I: Equities and Futuresকৌশল অনলাইন 9 Strategies II: Volatility, Relative Value, Macro and the Bank Desksকৌশল অনলাইন 10 Microstructure and Executionএক্সিকিউশন অনলাইন 11 Market Making and High-Frequency Tradingমার্কেট মেকিং অনলাইন 12 Machine Learning for Marketsমেশিন লার্নিং অনলাইন 13 Low-Latency Softwareপ্রযুক্তি অনলাইন 14 Networks, Hardware and Trading Infrastructureপ্রযুক্তি অনলাইন 15 Research, Data and Risk Platformsপ্রযুক্তি অনলাইন 16 The Desk and the Firmপ্রতিষ্ঠান অনলাইন 17 The Industry: Firms, Roles and Careersক্যারিয়ার অনলাইন 18 Interviews I: Maths, Probability and Speedক্যারিয়ার অনলাইন 19 Interviews II: Markets, Trading Games and the Final Roundক্যারিয়ার অনলাইন 20 Interviews III: Codeক্যারিয়ার অনলাইন
অ্যাপ পরিচিতি Coach সাইন ইন পড়া শুরু করো

বইগুলো এখনো বাংলা ভাষায় পাওয়া যায় না — ইংরেজি সংস্করণ দেখানো হচ্ছে।

Biology · পরিভাষা

Life table কী?

Definition 25.4 University Biology — Year 1 · অধ্যায় 25 — Populations and Demography

A life table follows a cohort of individuals born together through their lives. For each age xx it records lxl_x, the survivorship — the fraction of the cohort still alive at age xx — and mxm_x, the fecundity — the mean number of daughters born to a female of age xx. From them: the mortality between ages, qx=1−lx+1/lxq_x = 1 - l_{x+1}/l_x; the net reproductive rate R0=∑xlxmxR_0 = \sum_x l_x m_x, the number of daughters a newborn female will have on average in her lifetime; and the generation time T=∑xx lxmx/R0T = \sum_x x\,l_x m_x / R_0, the mean age of the mothers of those daughters. A population with R0>1R_0 > 1 grows, with R0<1R_0 < 1 declines; over one generation it is multiplied by R0R_0.

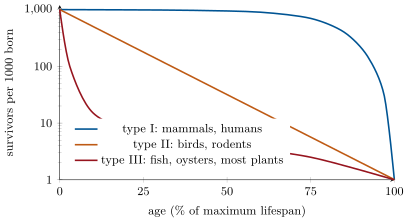
Three types of survivorship curve, on a logarithmic scale. Type I dies late, type III dies early, type II dies at a constant rate; each is a life history written as a line.

উদাহরণ

Example 25.6 (A life table for a deer herd)

Of a thousand fawns, six hundred reach their first birthday, and the survivors then lose a tenth of their number each year until few pass nine; does bear from age two, about eight tenths of a daughter a year in their prime. Summing lxmxl_x m_x gives R0≈1.5R_0 \approx 1.5: each doe leaves one and a half daughters, and the herd grows by half each generation of about four years — an eleven percent increase per year until something stops it.

প্রসঙ্গসহ পড়ো →