সব বই

পেশাদার

1 Markets I: The Ecosystem and Exchange-Traded Marketsবাজার অনলাইন 2 Markets II: Rates, FX and Creditবাজার অনলাইন 3 Markets III: Commodities, Energy and Cryptoবাজার অনলাইন 4 Quantitative Methodsপদ্ধতি অনলাইন 5 Derivatives and Volatilityডেরিভেটিভস অনলাইন 6 Rates, Credit, XVA and Riskসুদহার, ঋণ ও ঝুঁকি অনলাইন 7 Research Craft: Predictors, Backtests, Measurement, Portfoliosগবেষণা অনলাইন 8 Strategies I: Equities and Futuresকৌশল অনলাইন 9 Strategies II: Volatility, Relative Value, Macro and the Bank Desksকৌশল অনলাইন 10 Microstructure and Executionএক্সিকিউশন অনলাইন 11 Market Making and High-Frequency Tradingমার্কেট মেকিং অনলাইন 12 Machine Learning for Marketsমেশিন লার্নিং অনলাইন 13 Low-Latency Softwareপ্রযুক্তি অনলাইন 14 Networks, Hardware and Trading Infrastructureপ্রযুক্তি অনলাইন 15 Research, Data and Risk Platformsপ্রযুক্তি অনলাইন 16 The Desk and the Firmপ্রতিষ্ঠান অনলাইন 17 The Industry: Firms, Roles and Careersক্যারিয়ার অনলাইন 18 Interviews I: Maths, Probability and Speedক্যারিয়ার অনলাইন 19 Interviews II: Markets, Trading Games and the Final Roundক্যারিয়ার অনলাইন 20 Interviews III: Codeক্যারিয়ার অনলাইন
অ্যাপ পরিচিতি Coach সাইন ইন পড়া শুরু করো

বইগুলো এখনো বাংলা ভাষায় পাওয়া যায় না — ইংরেজি সংস্করণ দেখানো হচ্ছে।

Mathematics · পরিভাষা

Graph কী?

Definition 3.5 High School Mathematics · অধ্যায় 3 — Functions

In a coordinate system, the graph (or curve) of ff is the set of all points (x,f(x))(x, f(x)) for xx in the domain. In other words, a point (x,y)(x, y) lies on the graph exactly when y=f(x)y = f(x).

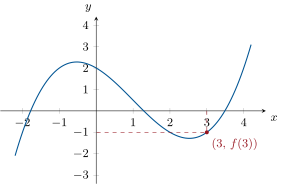
Reading an image on a graph: start from x = 3 on the horizontal axis, go vertically to the curve, then horizontally to the vertical axis to read f(3) = -1.
Reading an image on a graph: start from x=3x = 3 on the horizontal axis, go vertically to the curve, then horizontally to the vertical axis to read f(3)=−1f(3) = -1.
Solving f(x) = k graphically: the solutions x_1 and x_2 are the abscissas of the intersection points of the curve with the horizontal line y = k. Here f(x) ≤ k holds on [x_1, x_2], where the curve is below the line.
Solving f(x)=kf(x) = k graphically: the solutions x1x_1 and x2x_2 are the abscissas of the intersection points of the curve with the horizontal line y=ky = k. Here f(x)≤kf(x) \leq k holds on [x1, x2]\intcc{x_1}{x_2}, where the curve is below the line.

উদাহরণ

Example 3.7

Is the point A(2,5)A(2, 5) on the graph of f(x)=x2+1f(x) = x^2 + 1? Compute f(2)=4+1=5f(2) = 4 + 1 = 5: yes, since f(2)f(2) equals the yy-coordinate of AA. The point B(3,8)B(3, 8) is not on the graph, because f(3)=10≠8f(3) = 10 \neq 8.

Example 3.10

Consider the function graphed below on [−2, 4]\intcc{-2}{4}.

A function defined on [-2, 4], increasing then decreasing.
A function defined on [−2, 4]\intcc{-2}{4}, increasing then decreasing.

Reading the graph: ff increases from f(−2)=−1.5f(-2) = -1.5 up to its maximum f(1)=3f(1) = 3, then decreases down to f(4)=−1.5f(4) = -1.5. Its variation table is

xx−2-21144
ff−1.5-1.5↗\nearrow33↘\searrow−1.5-1.5
প্রসঙ্গসহ পড়ো →