Market Making and High-Frequency Trading · Market making
1The Business of Market Making
In 2025 Virtu Financial, a listed electronic market maker, reported adjusted net trading income of $8.6 million a trading day. The same filing shows what earning it cost: $770 million of exchange, clearing and order-flow fees, $528 million of pay for about a thousand employees, $249 million of communication and data. Flow Traders, an exchange-traded-fund specialist, earned 2.5 basis points for each euro of the products it traded. This chapter’s first market maker, run for ten simulated hours, earns half a cent a share on the spread and gives almost all of it back within ten seconds. The business is a small margin on a very large volume, over a cost base that does not shrink when volume does.
1.1 What a market maker sells
A market maker (One Quant Book 1, chapter 1) stands ready to buy at its bid and sell at its ask. What it sells is immediacy: the investor who crosses the spread trades now instead of waiting for someone who wants the other side. The price of immediacy is half the spread per share, earned on every fill, and its cost is that some of the people who take it know where the price is going.
Definition 1.1 (Electronic market maker)
An electronic market maker is a firm that provides liquidity by algorithm: its quotes, their sizes and their revisions are set by programs that react to market data in microseconds to milliseconds, across many instruments and venues at once, with humans supervising the programs rather than the quotes.
Most electronic market makers are also high-frequency traders in the legal sense that One Quant Book 10, chapter 24 gives the term (short holding periods, high message rates, colocated servers); the converse fails, since some high-frequency strategies only take liquidity. Some electronic market makers carry obligations, as designated or lead market makers (One Quant Book 1, chapters 19 and 29); most quote because it pays. Four business lines recur in this book: exchange-traded products and their hedges (chapters 12–14), futures and options on exchanges (chapters 15, 19 and 20), the dealer markets reached by request for quote or streaming, FX and bonds (chapters 21 and 22), and retail order flow bought from brokers (chapter 23). Crypto venues (chapters 24 and 25) and event markets (chapter 26) run the same trade on newer infrastructure.
1.2 Revenue: capture, volume and volatility
Definition 1.2 (Revenue capture)
A market maker’s revenue capture is its trading income, net of the fees that scale with trading, per unit traded: per share, per contract, or per unit of value traded, usually in basis points.
Revenue is capture times volume. Both move with volatility: more volatile days bring more volume, wider spreads and larger adverse moves, and the listed firms describe their income as driven by volume and volatility together. Capture itself is what is left of the half-spread after the price has moved against the fills. One Quant Book 7, chapter 23 splits it exactly.
Proposition 1.3 (Where the half-spread goes)
Let fills have side , quantity , price and time ; let be a reference price, a horizon and the end of the period; let be the fee paid on fill (negative for a rebate). The P&L of the fills, the final position marked at , is
Proof. For each fill the three brackets telescope to ; is the cash from the fills plus the final position valued at . ∎
The identity holds for any reference: the mid, a fair price (chapter 2), or, in a simulation, the efficient price nobody observes. With the mid, a passive fill’s spread capture is exactly half the spread; the adverse-selection term measures how much of it the next seconds take back. Menkveld’s study of one large high-frequency market maker on Chi-X and Euronext found the same split in real data: a gross profit of € 0.88 per trade, made of € 1.55 earned on the spread net of fees and a € 0.68 loss on positions, which earned € 0.45 when held under five seconds and lost € 1.13 when held longer.
1.3 Costs: fees, financing, people and machines
A market maker’s costs fall into two groups. Those that scale with trading are exchange and clearing fees (less rebates), payment for order flow where it buys retail orders, and the financing of its inventory and of the margin behind it. Those that do not scale are people, market data, connectivity and colocation, servers and exchange memberships. The first group is netted into capture; the second decides how much capture the firm needs to survive.
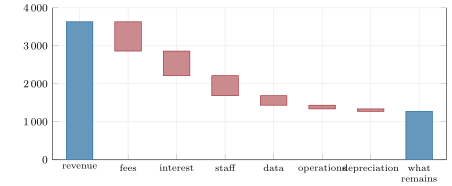
As of September 2026 — Two listed market makers in 2025
Virtu Financial (Form 10-K for 2025): total revenue $3 632 million, of which trading income $2 437 million; brokerage, exchange, clearance fees and payments for order flow $770 million; interest and dividends expense $647 million; employee compensation $528 million; communication and data processing $249 million. Adjusted net trading income (the firm’s measure: trading income, commissions and interest and dividends income, less the two direct cost lines) $2 145 million, $8.6 million a day over 248.5 trading days; the market-making segment $1 666 million, $6.7 million a day, 77.7% of the total. About 1 027 employees in February 2026.
Flow Traders (full-year 2025 results): net trading income € 485.8 million on € 1 940 billion of exchange-traded-product value traded; fixed operating expenses € 204.1 million (fixed employee € 97.3 million, technology € 70.6 million, other € 36.3 million), variable employee expenses € 77.4 million; EBITDA € 198.9 million, a 41% margin; 635 full-time employees at the end of the year.
Three ratios come out of the box. Virtu’s fixed-cost lines (staff, communication and data, operations, depreciation) add up to $940 million, $3.8 million a trading day against $8.6 million of net trading income; communication and data alone cost $1.0 million a trading day. Its adjusted net trading income was $2.1 million per employee, against $0.51 million of pay. Flow Traders’ net trading income was 2.5 basis points of its exchange-traded-product value traded; the ratio overstates what it earned on those products, since the income also includes other trading. Its fixed costs came to € 0.32 million per employee, a third of them technology.
1.4 What the public record shows about who wins
The two filings describe firms, not trades. The academic record adds what a trade earns and who earns it. Menkveld’s decomposition says the spread pays and the position costs, so the business is to earn the first and shorten the second. Baron, Brogaard, Hagströmer and Kirilenko ranked high-frequency traders by relative latency and found that differences in speed account for large differences in performance; firms that moved up the ranking through a colocation upgrade earned more afterwards, both from short-lived information and from managing risk faster, in market making and in cross-market arbitrage alike. Speed is therefore not a detail of implementation but part of the product: it decides how often a market maker’s quote is the one a better-informed trader picks off (chapter 9), and how quickly it can hedge.
Remark 1.4 (What a filing cannot tell you)
A filing aggregates thousands of instruments and many strategies. It gives no capture per share for the firm as a whole (Virtu does not report its volume), no split between passive and aggressive trading, and no view of the losing days inside a year. The rest of this book works from simulations and from the published research for exactly these reasons, and says so in every caption.
1.5 The shape of the business: fixed costs and scale
With capture per unit traded, variable costs per unit (fees, financing) and fixed costs per day, a daily volume earns
Proposition 1.5 (Break-even volume and operating leverage)
If , profit is zero at , and above it the elasticity of profit to volume is
Proof. Direct differentiation of ; the second form divides numerator and denominator by . ∎
Example 1.6 (A small firm)
A new market maker expects a gross capture of 0.5 basis points of value traded, pays 0.2 basis points in fees and financing, and costs $40 000 a trading day to run (about $10 million a year). It breaks even at $1.33 billion a day of value traded. At $2 billion it earns $20 000 a day, with an operating leverage of 3: a 10% fall in volume removes 30% of its profit. If competition takes capture from 0.5 to 0.4 basis points, the break-even volume rises to $2 billion, and the same firm earns nothing (Figure 1.2).
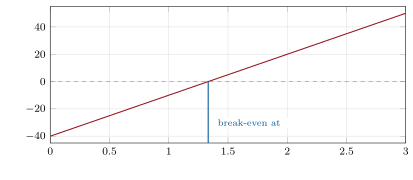
firm.mmecon.The fixed cost base explains three features of the industry that the later chapters meet again. Market makers spread one technology stack over as many instruments and venues as it can serve, because each new instrument adds volume for little fixed cost. They pay for speed, whose cost is fixed and whose benefit scales with volume. And the firms that survive a long low-volatility, low-volume period are those with the lowest break-even volume, not the highest capture.
1.6 Tutorial: a first market maker
Goal. Run the simplest market maker in a simulated market and decompose its P&L. End state: the table below and Figure 1.3.
- The market. Book 7’s
firm.tapesimulates one stock at $100 with a one-cent tick for an hour: liquidity providers, noise traders whose orders cluster, informed traders who trade towards an efficient price that jumps at random times, and a news window. The harness.
firm.mmharnessruns a Quoter inside that market: the Quoter’s orders are real orders in the book, it sees the market half a millisecond late and its orders arrive half a millisecond after it sends them. It must quote off the book without its own orders, or it chases them: a version that joined the raw best bid, its own orders included, sent 336 012 messages in the first 1 400 simulated seconds of one run, almost all in its last minute, against 323 for the fixed version.Ctx.quotekeeps one order per side at a target price (Listing 1.1).def take(self, side: int, qty: int) -> int: self._next += 1 self._out.append(("market", self._next, side, int(qty))) self.messages += 1 return self._next def external(self, top) -> dict: """The top of the book without the Quoter's own orders (xbid, xbid_qty, xask, xask_qty in the market's top): a market maker reading an order-by-order feed knows its own order ids, so this is exact.""" return {"t": top["t"], "bid": top["xbid"], "bid_qty": top["xbid_qty"], "ask": top["xask"], "ask_qty": top["xask_qty"]}Listing 1.1. Keep one order per side at the target price: cancel the others, send if none is left. code/firm/mmharness/firm_mmharness.py The Quoter.
SymmetricQuoterjoins the best bid and ask of the others with 100 shares and stops adding to a position of 500 (Listing 1.2). Fees are illustrative: a rebate of 0.1 cent a share on passive fills, a 0.1 cent charge on aggressive ones.if w.qty <= 0: del self._working[f.cid] self.position += f.side * f.qty self.cash -= f.side * f.qty * f.price * self.tick fee = (self.fee_sched.make if f.passive else self.fee_sched.take) * f.qty self.fees_paid += fee self.cash -= fee def _drain(self) -> list: out, self._out = self._out, [] return out class SymmetricQuoter: """Join the best bid and ask with `size` shares (or `offset` ticks behind them); stop quoting the side that would take the position beyond `limit` shares. The baseline market maker of chapter 1. raw=True quotes off the raw top, own orders included: the feedback loop the harness exists to prevent (kept to show it).""" def __init__(self, size: int = 100, limit: int = 1000, offset: int = 0, raw: bool = False):Listing 1.2. The chapter’s first market maker. code/firm/mmharness/firm_mmharness.py - Run and decompose.
hf_business.decomposition(H=10)runs ten independent hours (seeds 1–10) and splits the P&L as in Proposition 1.3, against the mid and against the efficient price.
The Quoter trades 38 270 shares an hour on average, 11% of the market’s volume, and sends 1 256 messages. Its P&L per hour and per share (ten-hour means, seconds):
| reference | spread capture | adverse selection | inventory | fees | total |
|---|---|---|---|---|---|
| mid, $ per hour | 186.50 | 38.27 | |||
| mid, cents per share | 0.487 | 0.100 | |||
| efficient price, cents per share | 0.038 | 0.100 |
Against the mid, the Quoter earns its half-spread of half a cent on every share and loses almost all of it to adverse selection within ten seconds; the rebate is what keeps it near zero. Against the efficient price, the spread capture is already negative: on average the Quoter’s fills happen when the efficient price has moved through its quote, so the mid it trades at is stale. The mark-out curve shows the half-spread melting (Figure 1.3). The hourly total has a standard deviation of $89, so the ten-hour mean of carries a standard error of $28: the naive Quoter does not make money, and ten hours cannot say whether it loses.
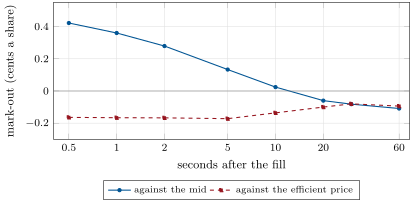
hf_business.markout_curve.What to change next. Quote one tick behind the best prices and see volume collapse; switch off the rebate (exercise 7); give the Quoter a fair price instead of the mid (chapter 2) and a reason to skew (chapter 3).
1.7 Build: the harness and the unit economics
Purpose. One interface for every market-making strategy of the book, so that a strategy written once runs on Book 7’s synthetic market today and on Book 10’s exchange simulator when it lands; and the arithmetic of capture, costs and scale.
Interface. firm.mmharness: a Quoter with on_start, on_market(ctx, t, top), on_fill(ctx, fill) and optionally on_timer; ctx.send, cancel, take, quote, external, position, cash, working(); run_tape(quoter, cfg, latency, fees) -> Result with fills, pnl(ref), decompose(H, ref) and markouts(horizons, ref), ref the mid or the efficient price. firm.mmecon: capture_bp, profit, breakeven_volume, operating_leverage, cost_shares.
Rules. The Quoter never sees the efficient price. Its view of the book excludes its own orders. A cancelled order can still fill while the cancel travels. Same configuration and seed, same fills.
Acceptance tests. code/firm/mmharness/tests/: the decomposition adds up to the marked P&L against both references; the position limit holds up to one order in flight; messages stay below a tenth of the market’s; an aggressive fill pays the taker fee; runs are deterministic. code/firm/mmecon/tests/: break-even and operating leverage against their definitions.
Stretch. An adapter to firm.exchsim (One Quant Book 10, chapter 26) with a parity test against this one; timers in market time.
Sources and further reading
- Virtu Financial, Inc., Form 10-K for the year ended 31 December 2025 (SEC EDGAR).
- Flow Traders, “4Q and FY 2025 Results”, 12 February 2026.
- A. J. Menkveld, “High frequency trading and the new market makers”, Journal of Financial Markets 16(4), 2013.
- M. Baron, J. Brogaard, B. Hagströmer and A. Kirilenko, “Risk and return in high-frequency trading”, Journal of Financial and Quantitative Analysis 54(3), 2019.
1.8 Exercises
Exercise 1.1 ★
Virtu’s adjusted net trading income was $2 145.3 million over 248.5 trading days. What is it per day?
Solution
Solution of Exercise 1.1.
million a trading day.
Exercise 1.2 ★
Flow Traders earned € 485.8 million of net trading income on € 1 940 billion of exchange-traded-product value traded. Express the ratio in basis points and say why it overstates the capture on those products.
Solution
Solution of Exercise 1.2.
basis points. The numerator includes trading income from other products, so the ratio is an upper bound on what the firm earned per euro of exchange-traded products.
Exercise 1.3 ★
A firm captures 0.5 basis points of value traded, pays 0.2 basis points of variable costs and has $40 000 of fixed costs a day. What is its break-even daily value traded?
Solution
Solution of Exercise 1.3.
billion a day.
Exercise 1.4 ★★
The same firm trades $2 billion a day. Compute its profit and its operating leverage, and its profit after a 10% fall in volume.
Solution
Solution of Exercise 1.4.
; leverage . At $1.8 billion, : 30% less profit for 10% less volume.
Exercise 1.5 ★★
Against the mid, the symmetric Quoter’s spread capture is cents a share; against the efficient price it is . Explain how both can be true.
Solution
Solution of Exercise 1.5.
The mid at the moment of a fill is stale: fills happen disproportionately when the efficient price has already moved through the quote (informed traders act on the gap, and quotes are slow to follow). Against the mid the Quoter always earns half the spread at the fill; against the efficient price it has already lost 0.173 cents, and the mid catches up over the next seconds, which is the adverse selection measured against the mid.
Exercise 1.6 ★★
From Figure 1.3, between which horizons does the mark-out against the mid cross zero, and what does that say about how long the Quoter can hold a position?
Solution
Solution of Exercise 1.6.
Between 10 seconds ( cents) and 20 seconds (). Any position held longer than about ten seconds has, on average, lost its half-spread: the Quoter must earn the next spread, or hedge, before then.
Exercise 1.7 ★★★
Coding. Rerun the ten hours with no fees at all (Fees(0, 0)). What is the total P&L per share, and why does nothing else change?
Solution
Solution of Exercise 1.7.
cents a share: the with the rebate, less the 0.100 cent rebate. Fees do not enter the Quoter’s decisions, so orders, fills and prices are identical; only the fee line changes.
Exercise 1.8 ★★★
Find the flaw. “We ran our new quoter for an hour in the simulator and it made $61. It works; let us size it up.”
Solution
Solution of Exercise 1.8.
One hour is one draw. The hourly P&L of this kind of quoter has a standard deviation near $89, so $61 is well inside the noise of a quoter whose true mean is negative (the chapter’s is ). Decompose the P&L, run many independent hours, and report the mean with its standard error before sizing anything.
1.9 Problem: A Fraction of a Cent
Problem 1.1
Weekend problem — a fraction of a cent
A founder wants to start an electronic market maker. You have the public record, a simulator and a spreadsheet.
Part I — The public record.
- Define an electronic market maker and say what it sells.
- Give Virtu’s 2025 adjusted net trading income per day, and its market-making segment’s share of it.
- Add up Virtu’s fixed-cost lines and express them per trading day.
- Compute Virtu’s adjusted net trading income and pay per employee.
- Compute Flow Traders’ net trading income per unit of exchange-traded-product value traded, its fixed costs per employee and its EBITDA margin.
Part II — Unit economics.
- Define revenue capture and write profit as a function of daily volume.
- Derive the break-even volume and the operating leverage.
- For the small firm (0.5, 0.2 basis points, $40 000 a day), give the break-even volume, and the profit and leverage at $2 billion a day.
- What is its profit over 250 trading days at $2 billion a day?
- Fixed costs rise to $50 000 a day. What is the new break-even volume?
- Capture falls to 0.4 basis points instead. What is the break-even volume now, and the profit at $2 billion?
Part III — The first Quoter.
- State the P&L identity of Proposition 1.3 and prove it.
- Why must a Quoter quote off the book without its own orders?
- Give the Quoter’s hourly volume, market share and messages.
- Give its P&L per share against the mid, part by part.
- Why is its spread capture negative against the efficient price?
- How precise is the ten-hour mean of the hourly total?
Part IV — The verdict.
- What did Menkveld and Baron and co-authors find, and what do they imply for this Quoter?
- State the named result: the small firm’s break-even daily volume and its operating leverage at $2 billion a day.
- In two sentences, what should the founder build first: more capture, more volume, or lower fixed costs?
Solution
Solution of Problem 1.1.
- A firm providing liquidity by algorithm across many instruments and venues; it sells immediacy, priced at half the spread.
- $8.63 million a day; market making $1 666 million, 77.7% ($6.71 million a day).
- Staff $528.1, communication and data $249.2, operations $97.9, depreciation $64.4: $939.6 million, $3.78 million a trading day.
- $2.09 million of adjusted net trading income and $0.51 million of pay per employee.
- 2.50 basis points; € 0.32 million of fixed costs per employee; EBITDA margin 41%.
- Trading income net of volume-driven fees per unit traded; .
- ; .
- $1.33 billion; $20 000 a day and a leverage of 3.0 at $2 billion.
- million.
- billion.
- billion; profit zero at $2 billion.
- See Proposition 1.3: the three brackets telescope to .
- Its own orders move the top of the book; joining that top chases its own orders into a message storm (336 012 messages against 323 in the tutorial’s run).
- 38 270 shares an hour, 11% of the market’s volume, 1 256 messages.
- Spread , adverse selection , inventory , fees : cents a share.
- Its fills cluster when the efficient price has moved through its quote; the mid at the fill is stale.
- Standard deviation $89 an hour, standard error for a mean of : not distinguishable from zero.
- The spread pays and the position costs (€ 1.55 against € 0.68 per trade); speed rank drives performance. This Quoter earns its spread and loses it on positions held too long, and has no way to be faster than the informed flow.
- Break-even at $1.33 billion a day; operating leverage 3.0 at $2 billion a day.
- Lower fixed costs and a lower break-even volume first: capture is set by competition and volume by the market, while a small margin over a large fixed base makes every quiet month a loss.
1.10 Interview questions
Interview question 1.1 ★ trader
What does a market maker sell, and who pays for it?
Solution
Solution of Interview question 1.1.
Immediacy: the ability to trade now. The investors who cross the spread pay for it, half the spread per share; the market maker’s cost is the adverse selection from the ones who know more.
What the interviewer is looking for: immediacy, half-spread, and that informed flow is the cost.
Interview question 1.2 ★ researcher
Decompose a market maker’s P&L into spread capture, adverse selection and inventory. Why does the split depend on a horizon?
Solution
Solution of Interview question 1.2.
Spread capture , adverse selection , inventory . The horizon separates the price move that the fill predicted (information) from later moves of the held position (risk); the choice of moves P&L between the two terms, never the total.
What the interviewer is looking for: the telescoping identity and that is a convention.
Interview question 1.3 ★★ trader, researcher
Your quoter’s fills are profitable at the moment of the fill and unprofitable ten seconds later. What is happening, and what do you try first?
Solution
Solution of Interview question 1.3.
Adverse selection: the fills come from traders who know the next price. Try a better fair price than the mid, skew or widen when the book or the lead instrument signals a move, and hedge or unwind within the horizon over which the mark-out decays.
What the interviewer is looking for: mark-out curves, a fair price, and acting within the decay horizon.
Interview question 1.4 ★★ developer
A simulated quoter sends a million messages an hour and fills a few hundred times. What bug do you look for?
Solution
Solution of Interview question 1.4.
A feedback loop: the quoter reads a book that contains its own orders and keeps repricing to join or leave itself. Quote off the book without one’s own orders, and add a minimum price change before repricing.
What the interviewer is looking for: self-reference in the market-data view, and a message-rate test.
Interview question 1.5 ★★ risk
Why is a market maker’s profit more volatile than its volume?
Solution
Solution of Interview question 1.5.
Fixed costs: profit is , so its percentage change is times that of volume; and capture itself varies with volatility and competition.
What the interviewer is looking for: operating leverage and the break-even volume.
Interview question 1.6 ★★★ researcher
A strategy’s hourly P&L has a mean of and a standard deviation of $89. How many independent hours would you need to tell a true mean of from zero at two standard errors?
Solution
Solution of Interview question 1.6.
gives hours.
What the interviewer is looking for: standard error scaling and a number.