Networks, Hardware and Trading Infrastructure · Technology
1Networking for Trading
The operator of the consolidated U.S. options feed tells its subscribers how much network to buy, and it does not quote an average. For July 2026 it projected 4.403 gigabits in the busiest 100 milliseconds and 0.501 gigabits in the busiest 10 milliseconds, per copy of the feed: over the longer window, over the shorter, twice that for a subscriber that takes both redundant copies. Its own statistics say the same thing from the other side: the busiest millisecond of July 2026 carried messages at five times the rate of the busiest second. A network sized for the average of a trading day loses packets in its busiest milliseconds, and those are the milliseconds a trading firm is paid to see.
This chapter opens the book’s first part, the network between a venue and the firm’s servers. It prices a byte on the wire, shows how one packet reaches many subscribers, explains why market data travels in datagrams and orders in streams, and ends where most losses begin: at a switch port that receives more than it can send.
1.1 The Ethernet frame and what a byte costs on the wire
Definition 1.1 (Network interface card, Ethernet frame)
A network interface card (NIC) is the device that connects a computer to a network link: it turns the bits on the wire into data in the host’s memory and back. An Ethernet frame is the unit an Ethernet link carries: a destination and a source address (6 bytes each), a type (2 bytes), a payload of 46 to 1 500 bytes and a frame check sequence (4 bytes), from 64 to 1 518 bytes in all without a VLAN tag. On the wire each frame is preceded by 8 bytes of preamble and start delimiter and followed by at least 12 bytes of idle inter-frame gap.
Definition 1.2 (Line rate, serialisation delay, maximum transmission unit)
The line rate of a link is the rate at which it clocks bits onto the medium (1, 10, 25 or ). The serialisation delay of a frame is the time the link takes to put it on the wire. The maximum transmission unit (MTU) is the largest payload a link carries in one frame, 1 500 bytes for standard Ethernet.
Proposition 1.3 (What a frame costs)
A frame of bytes occupies bytes of line time, so its serialisation delay is
and a link carries at most frames a second. Every device that must receive a whole frame before it sends it on pays once more.
Proof. The preamble, start delimiter and inter-frame gap are 20 bytes of line time that belong to each frame and to no other; a link sends one bit every . A store-and-forward device (chapter 2) starts to transmit only once the last bit has arrived, a delay of one serialisation at the incoming rate. ∎
Example 1.4 (One add order)
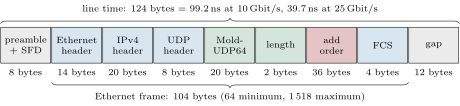
The exchange simulator of One Quant Book 10 publishes its feed as MoldUDP64 packets: a 20-byte header (session, sequence number, message count), then each message behind a 2-byte length. An add-order message is 36 bytes, so a packet carrying one is 58 bytes of UDP payload; with 8 bytes of UDP header, 20 of IPv4 header and 18 of Ethernet header and check sequence the frame is 104 bytes and occupies 124 bytes of line time (Figure 1.1): at , at 25. A venue that packs eight such messages in one packet spends the 66 bytes of fixed overhead once for eight messages instead of eight times.
| Frame (bytes) | ||||
|---|---|---|---|---|
| 64 | 672.0 | 67.2 | 26.9 | 6.7 |
| 128 | 1 184.0 | 118.4 | 47.4 | 11.8 |
| 256 | 2 208.0 | 220.8 | 88.3 | 22.1 |
| 512 | 4 256.0 | 425.6 | 170.2 | 42.6 |
| 1 024 | 8 352.0 | 835.2 | 334.1 | 83.5 |
| 1 518 | 12 304.0 | 1 230.4 | 492.2 | 123.0 |
nw_wire.frame_table.Table 1.1 is the first latency table of this book and the one most often forgotten. A full-size frame at takes to serialise, half of the that an engineer of a large market maker gave in a public talk as a very good wire-to-wire time for a whole software trading system (One Quant Book 13, chapter 1). Moving from 10 to saves 60% of every serialisation, a reason to buy the faster port even when the slower one would carry the traffic. Serialisation is also why small frames matter: an order is rarely larger than a hundred bytes, and a switch that forwards it only once it has all of it pays for all of it.
Remark 1.5 (Bits in flight)
Light in standard single-mode fibre travels a metre in about (group index 1.462, chapter 10). A 1 518-byte frame at is therefore 252 metres long in the fibre, longer than any cable in a data-centre hall: its first bit reaches the far end long before its last bit has left. Distance and serialisation are separate terms of a latency budget, and at the scale of a building serialisation usually wins.
MIN_FRAME, MAX_FRAME = 64, 1518
MOLD_HDR = 20          # session 10 + sequence number 8 + message count 2


def frame_bytes(payload, l4="udp", vlan=False):
    l4h = UDP if l4 == "udp" else TCP
    return max(MIN_FRAME, ETH + (VLAN if vlan else 0) + IPV4 + l4h + int(payload) + FCS)


def mold_payload(msg_lengths):
    return MOLD_HDR + sum(2 + int(n) for n in msg_lengths)


def wire_bytes(frame):
return int(frame) + OVERHEADfirm.netsim: the smallest frame is padded to 64 bytes, and every frame pays 20 bytes of preamble and gap. code/firm/netsim/firm_netsim.py1.2 IP multicast: groups, membership and snooping
A venue sends the same market data to hundreds of subscribers. Sending one copy to each over its own connection would make the last subscriber wait for all the others (chapter 12 studies a venue that did exactly that); sending one copy that the network replicates makes them all equal to within the replication.
Definition 1.6 (Multicast group, IGMP)
A multicast group is an IPv4 address between 224.0.0.0 and 239.255.255.255 that names a set of receivers rather than one host: a datagram sent to it is delivered to every member. The Internet Group Management Protocol (IGMP) is the protocol by which a host tells its neighbouring routers which groups it wants to receive, and, in version 3, from which sources.
A venue’s feed is usually spread over many groups, one per channel or partition of instruments, so that a subscriber receives only the groups it needs (chapter 22 sizes the options feeds this way). A group must also be delivered on the Ethernet segment, and Ethernet addresses are 48 bits: a group address is mapped to the Ethernet address 01:00:5e followed by the low 23 bits of the group, so the upper 5 of the 28 bits that distinguish groups are lost and 32 groups share each Ethernet address. A card filtering on Ethernet addresses may therefore let through groups the host never joined, and the kernel discards them after having paid for them.
Definition 1.7 (IGMP snooping)
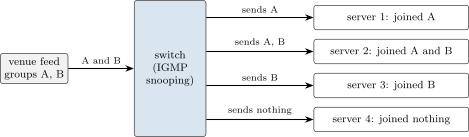
IGMP snooping is a switch’s practice of reading the IGMP membership reports that cross it and forwarding each group’s traffic only to the ports on which a member has reported, instead of flooding every multicast frame to every port.
Example 1.8 (Two groups, one Ethernet address)
Group 239.255.1.2 maps to 01:00:5e:7f:01:02: the low 23 bits of 255.1.2 are 127.1.2 once the top bit of 255 is dropped. Group 224.127.1.2 maps to the same address. A server that joined only the first receives, from any switch or card that filters by Ethernet address alone, the traffic of the second as well. Venues allocate their groups with this in mind, and a firm that runs its own internal multicast (chapter 27’s ticker plant) should too.
1.3 Datagrams against streams
Two transport protocols carry almost everything in a trading network. UDP sends datagrams: each is delivered whole or not at all, with no ordering and no retransmission, and one datagram sent to a group reaches every member. TCP carries a byte stream between two endpoints: it numbers the bytes, acknowledges them, retransmits what is lost and delivers everything in order.
Market data travels in UDP multicast because only multicast sends one copy to all, and because a feed must not slow down for its slowest subscriber: TCP’s flow control would do exactly that. The price is that loss is the application’s problem. The venue sends every packet on two independent lines (One Quant Book 10, chapter 26), numbers them, and runs retransmission and snapshot services; the firm’s handler arbitrates and recovers (One Quant Book 13, chapters 16 and 18). Orders travel over TCP because an order must arrive exactly once, in order with the firm’s other orders, and because the venue must know which connection sent it: the session layer of the order-entry protocol builds on those guarantees.
Definition 1.9 (Head-of-line blocking)
Head-of-line blocking is the delay imposed on every item in an ordered queue by one item at its head that cannot proceed. In TCP, a lost segment holds back every later byte of the stream, already received or not, until its retransmission arrives.
Head-of-line blocking is the cost of TCP’s ordering. A cancel sent a microsecond after a lost new-order message waits for the new order’s retransmission, which comes after at least a round trip and usually after a timer: on a clean colocation link loss is rare, and when it happens the whole session stalls. Ordering is also a feature: the venue must never see the cancel before the order it cancels.
Definition 1.10 (Nagle’s algorithm)
Nagle’s algorithm is TCP’s rule that a sender holds new data back, instead of sending it in a small segment, while any data it has already sent remains unacknowledged. It saves bandwidth when a program writes many small pieces, and was designed for interactive terminals.
Proposition 1.11 (Nagle meets the delayed acknowledgement)
Let a sender write a small order and, before it is acknowledged, a second small order, on a connection with Nagle’s algorithm enabled, to a receiver that delays its acknowledgements (TCP allows up to half a second). The second order leaves only when the first is acknowledged: after the receiver’s delayed-acknowledgement timer, or a round trip if the receiver has data of its own to send. Disabling Nagle’s algorithm (the socket option TCP_NODELAY) removes the wait.
Proof. By the rule, the second write is held while the first segment is unacknowledged. The receiver sends its acknowledgement when its timer fires, when it has a second full segment to acknowledge (it has not: one small segment arrived), or with its own data. ∎
Method 1.12 (An order-entry socket)
- Set
TCP_NODELAYon every order-entry and drop-copy connection. - Write each message with one call, so that one message is one segment and nothing waits for a later write.
- Where the venue’s session protocol acknowledges at the application level, acknowledge promptly at the TCP level too (Linux’s
TCP_QUICKACKis not permanent and must be set again after reads). - Keep the connection up (the session layer’s heartbeats) and pre-warmed: a new TCP connection costs a round trip before its first byte, and chapter 20 adds a TLS handshake on top for crypto venues.
1.4 Congestion: egress queues, incast and microbursts
A switch forwards each frame to an output port. If frames destined to one port arrive faster than the port’s line rate, they wait.
Definition 1.13 (Egress queue, oversubscription ratio)
An egress queue is the buffer in which a switch holds frames waiting to be sent on an output port; when it is full, arriving frames are dropped (tail drop). The oversubscription ratio of a port is the sum of the line rates that can send to it divided by its own line rate.
Definition 1.14 (Incast, microburst)
Incast is the congestion that arises when many senders transmit to one receiver at the same moment. A microburst is a period of microseconds to milliseconds during which the traffic offered to a port exceeds its line rate, while its average over any interval a monitoring tool reports (a second, a minute) stays well below it.
A feed that uses half of a port on average can overflow it for a millisecond, and a trading network is built to make this happen: every venue’s feed, and every partition of every feed, reacts to the same market events at the same time.
Proposition 1.15 (The fluid bound)
Let inputs send at rates to a port of line rate during a burst of length , starting from an empty queue. At the end of the burst the queue holds
and the last byte of the burst leaves after it arrived. Tail drop loses nothing if and only if the buffer available to the port is at least ; otherwise it loses minus the buffer, in whole frames.
Proof. During the burst the queue grows at the difference of the rates when it is positive and stays empty otherwise; the port then drains it at . The discrete version, frame by frame, is the loop of Listing 1.3, which reduces to the fluid formula when frames are small against . ∎
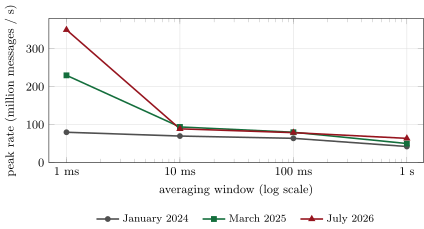
data/networks/opra_metrics.csv.Figure 1.3 is the published version of the microburst: the same feed, in the same month, is 63.9 million messages a second or 350 million a second depending on the window one reads it through. The operator’s capacity notice, which subscribers use to size their links, is written in 10-millisecond peaks for that reason (Box 1.1); a switch port does not average over 10 milliseconds, it queues frame by frame.
As of September 2026 — How much network the options feed needs
SIAC’s capacity projection for OPRA effective July 2026 gives, for one copy of the feed, 13.575 million messages, 4.403 gigabits and 1.564 million packets in the busiest 100 milliseconds, and 1.562 million messages, 0.501 gigabits and 169 000 packets in the busiest 10 milliseconds. That is and ; about 352 bytes and 8.7 messages per packet over the 100-millisecond window. Subscribers taking both redundant copies double the bandwidth, and the notice asks for 10% more for retransmissions. The notice states the 10-millisecond interval “reflects system utilization during bursts of traffic”.
To see the mechanism rather than its footprint, the chapter’s tutorial simulates eight feeds into one port with firm.netsim. Each feed averages 400 000 packets a second in clusters (a market event produces a run of messages), one to thirty add-order messages a packet; the eight together offer about , half the port. In one version every feed’s clusters are independent. In the other, 30% of each feed’s packets come in clusters triggered by common events, 400 a second, that hit all eight feeds at once, as a macro release or a large trade in an index future does.
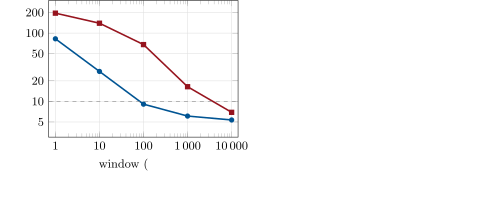
fig_bursts.py on firm.netsim (seeded, deterministic).The two versions have the same average load, and the difference is all in the correlation (Figure 1.4). With independent bursts the busiest 100 microseconds carry , and the buffer that would have lost nothing, the largest backlog of the run, is 21 to 31 KB over twenty seeds. With common events the busiest 100 microseconds carry , and that buffer is between 0.44 and 2.4 MB over the same twenty seeds, 1.1 MB on average. Removing the common events is the ablation: the megabyte is caused by the correlation, not by the load. A port’s traffic statistics averaged over a second show half a link in both cases.
As of September 2026 — A low-latency switch’s buffer
Cisco’s data sheet for the Nexus 3548-X, a 48-port switch sold for low latency, gives its buffer as “6 MB shared among 16 ports; 18 MB total” and latencies “as low as” in normal mode and in its warp mode. A port whose fifteen neighbours are also busy can count on about a sixteenth of its 6 MB block, 375 KB.
Read against the simulation, the box says that a port which can borrow the whole shared block survives the common-event bursts of Figure 1.4, and a port that gets only its sixteenth does not: at 500 KB of buffer the eight feeds with common events still lose 2.6% of their frames. The events that fill every port at once are the events that leave each port with only its share. The remedies are a faster egress port (the eight feeds’ common bursts reach over a millisecond, within a port), fewer feeds per port, or a switch whose buffer is dedicated rather than shared; chapter 2 adds the devices that do not queue at all.
1.5 Tutorial: microbursts from frames to drops
Goal. Price frames on the wire, read the published burst curve, and simulate a fan-in port until it drops. End state: Table 1.1, Figures 1.3 and 1.4, and the zero-loss buffers quoted in the text.
- Frames.
nw_wire.frame_table()andmold_example()reproduce the table and Example 1.4 from Listing 1.1. - The published curve.
opra_curve()turns the operator’s peak counts into rates;opra_capacity()turns the capacity notice into gigabits a second and bytes a packet. - Traffic.
feed()draws one feed’s packets fromfirm.netsim.bursty_arrivals, andfanin_traffic()merges eight of them, with or without common events (Listing 1.2). - The port.
firm.netsim.egressruns the tail-drop queue (Listing 1.3);fanin()sweeps the buffer,zero_loss_buffer()runs twenty seeds with an unbounded buffer and returns each run’s largest backlog.python fig_bursts.pywrites the charts’ data.
What to change next. Vary the share of packets that come with common events from 0 to 0.5 and plot the zero-loss buffer against it; replace the port by a one and find the smallest buffer that loses nothing.
def feed(seed, common, share, seconds=SECONDS, pps=FEED_PPS):
    """One simulated feed: clusters of packets; 1 to 30 add-order messages per packet."""
    t = ns.bursty_arrivals(pps, seconds, 8, 100, seed, common, share)
    k = np.minimum(np.random.default_rng(seed + 1000).geometric(1 / 3, len(t)), 30)
    frames = np.array([ns.frame_bytes(ns.mold_payload([ADD_ORDER] * int(x))) for x in k])
    return t, frames


def fanin_traffic(n_feeds=8, share=0.3, seed=1, seconds=SECONDS, event_hz=400):
    ev = ns.event_times(event_hz, seconds, 99 + seed)
    return ns.merge(*[feed(10 * seed + i, ev, share, seconds) for i in range(n_feeds)])


def fanin(buffers, n_feeds=8, share=0.3, seed=1, seconds=SECONDS, gbps=10.0):
    t, f, _ = fanin_traffic(n_feeds, share, seed, seconds)
return [100.0 * ns.egress(t, f, gbps, b).n_dropped / len(t) for b in buffers] t = np.asarray(t_ns, dtype=np.int64)
w = np.asarray(frames, dtype=np.int64) + OVERHEAD
n = len(t)
dep = np.full(n, -1.0)
drop = np.zeros(n, dtype=bool)
back = np.zeros(n)
rate = gbps / 8.0 # bytes per ns
q, prev, mx, nd, db = 0.0, 0, 0.0, 0, 0
tl, wl = t.tolist(), w.tolist()
for i in range(n):
ti, wi = tl[i], wl[i]
q = max(0.0, q - (ti - prev) * rate)
prev = ti
back[i] = q
if q + wi > buffer_bytes:
drop[i] = True
nd += 1
db += wi
continue
q += wi
mx = max(mx, q)
dep[i] = ti + q / rate1.6 Build: the network model
Purpose. A packet-level model of the firm’s network that every later chapter of Parts I and II uses: frames, links, queues, switches and multicast, with exact byte accounting and seeded traffic.
Interface. firm_netsim: constants for every header; frame_bytes, mold_payload, wire_bytes, ser_ns, prop_ns; mcast_mac; peak_rate(t, bytes, window); event_times, bursty_arrivals; egress(t, frames, gbps, buffer) returning departures, drops and backlogs; forward_ns(frame, gbps, mode, fabric_ns) for store-and-forward, cut-through and layer-1 devices; replicate(groups, members, ports, snooping); merge. C++20 twin of the egress queue, cpp/firm_netsim.hpp.
Rules. Integer nanoseconds and bytes; every frame pays 20 bytes of preamble and gap; frames shorter than 64 bytes are padded; tail drop drops whole frames; a queue is FIFO; every random draw is seeded; the C++ queue reproduces the Python one to the nanosecond.
Acceptance tests. code/firm/netsim/tests/: frame sizes of known packets (64, 104, 1 518 bytes); RFC 1112 address mapping and its 32-to-1 overlap; the peak-rate window on a hand-made stream; FIFO order, conservation of frames and the buffer bound of the egress queue; ten frames arriving together leave after ten serialisations; the fixture shared with the C++ test.
Stretch. Priority queues (strict priority for orders over market data on a shared uplink); a shared-buffer switch in which ports borrow from a common pool under a dynamic threshold, to reproduce Box 1.2’s arithmetic in simulation.
Sources and further reading
- OPRA, Key Operating Metrics of U.S. Options Securities Information Processor (August 2026); SIAC, Revised OPRA Capacity Projections (15 September 2025).
- G. Fairhurst, “Ethernet Frame Calculations” (University of Aberdeen); UNH InterOperability Laboratory, 10 Gigabit Ethernet MAC tutorial.
- RFC 768 (UDP), RFC 791 (IPv4), RFC 9293 (TCP), RFC 896 (Nagle), RFC 1122 (host requirements), RFC 1112 and RFC 5771 (multicast addressing), RFC 3376 (IGMPv3), RFC 4541 (snooping); Linux
tcp(7). - Cisco, Nexus 3548-X, 3524-X, 3548-XL and 3524-XL Switches Data Sheet.
1.7 Exercises
Exercise 1.1 ★
What is the serialisation delay of a 256-byte frame at , and how many 64-byte frames can a link carry in one second?
Solution
Solution of Exercise 1.1.
. A 64-byte frame occupies 84 bytes of line time, 672 bits: million frames a second.
Exercise 1.2 ★
To which Ethernet address is the multicast group 233.54.12.111 mapped? Give another group in 224.0.0.0/4 that shares it.
Solution
Solution of Exercise 1.2.
The low 23 bits of 233.54.12.111 are 54.12.111 (54 is below 128, so nothing is dropped), which gives the address 01:00:5e:36:0c:6f. Any group with the same low 23 bits shares it, for example 224.54.12.111 or 233.182.12.111 ().
Exercise 1.3 ★
From Box 1.1, what bandwidth must a firm taking both copies of the feed, with the retransmission allowance, provision for the 10-millisecond peak, and how many links is that?
Solution
Solution of Exercise 1.3.
at the 10-millisecond peak; , so five links (or two at 100).
Exercise 1.4 ★★
A gateway writes a new order and, forty microseconds later, a cancel of another order on the same TCP connection, without TCP_NODELAY. The venue acknowledges data only with its own messages or after its delayed-acknowledgement timer. What can happen to the cancel, and why is the order of the two never at risk?
Solution
Solution of Exercise 1.4.
With Nagle’s algorithm on, the cancel is held while the new order is unacknowledged; the venue acknowledges with its next message to the firm (the order’s acceptance) or when its delayed-acknowledgement timer fires, which TCP allows to take up to half a second. The cancel is delayed, never reordered: TCP delivers bytes in the order written. TCP_NODELAY removes the wait.
Exercise 1.5 ★★
Four inputs send at each for 50 microseconds to a port with an empty queue. How many bytes are queued at the end of the burst, and how long does the last byte wait?
Solution
Solution of Exercise 1.5.
The excess is for : 700 000 bits, 87 500 bytes. The last byte waits ns, .
Exercise 1.6 ★★
In Figure 1.3, compute the ratio of the busiest millisecond’s rate to the busiest second’s rate in January 2024 and in July 2026. What changed, and what does it mean for a link sized in 2024?
Solution
Solution of Exercise 1.6.
January 2024: ; July 2026: . The second grew by half, the busiest millisecond more than fourfold: bursts became sharper. A link sized in 2024 for that year’s busiest millisecond (80 million messages a second) carries less than a quarter of the busiest millisecond of July 2026 (350 million).
Exercise 1.7 ★★★
Coding. With nw_wire.zero_loss_buffer, compute the mean zero-loss buffer over twenty seeds when 10% and when 50% of the packets come with common events. How does the buffer scale with the share?
Solution
Solution of Exercise 1.7.
About 0.32 MB with 10% of packets in common clusters, 1.10 MB with 30% and 1.98 MB with 50% (means over twenty seeds). The buffer grows roughly in proportion to the share: the common clusters’ size, and so the backlog each event leaves, is proportional to it, while independent bursts alone need 26 KB.
Exercise 1.8 ★★★
Find the flaw. “Our market-data port averages on a link and its one-minute peak is . We have more than half the link spare; the packet loss our handler reports must be in the server.”
Solution
Solution of Exercise 1.8.
A one-minute peak averages over sixty thousand milliseconds; the loss happens in the few milliseconds, or less, in which the port is offered more than , which the counter cannot show. Check the switch’s egress discard counters for that port and measure the traffic at millisecond and microsecond resolution (chapter 5’s captures) before blaming the server.
1.8 Problem: The Open That Did Not Fit
Problem 1.1
Weekend problem — eight feeds, one port and a shared buffer
A firm’s market-data switch sends eight venue feeds to one strategy server over one port. Each feed averages ; at a market-wide event all eight burst together at each for one millisecond. Frames average 200 bytes. The switch is the one of Box 1.2; during such an event every port of the block is busy, so the port gets its sixteenth of the shared 6 MB.
Part I — Averages.
- What is the port’s average load and utilisation?
- How many frames a second does it carry on average (preamble and gap included)?
- What is the offered rate during the event, and the utilisation?
- Why does the port’s one-minute counter never show the event?
Part II — The queue.
- How many bytes are queued at the end of the burst, with an unlimited buffer?
- How many frames is that?
- How long does the last byte of the burst wait in the queue?
- After the burst the feeds return to their averages. How long does the queue take to drain?
Part III — The buffer.
- What buffer would lose nothing?
- How much buffer does the port actually get during the event?
- How many bytes and how many frames are dropped?
- What share of the burst’s frames is that?
- Would the whole 6 MB block have been enough?
Part IV — The verdict.
- State the named result: the minimum buffer for zero loss, and the frames dropped at the port’s share.
- How long would the burst have to last for the whole 6 MB block to overflow?
- Would a port queue at all during the event?
- The firm takes both copies of each feed on separate ports of the same block. Does that help?
- Which switch counter shows the loss, and which handler counter?
- How do the handler’s recovery paths (One Quant Book 13, chapter 18) cope with the loss?
- In one sentence: why is the event that fills one port the event that fills all of them?
Solution
Solution of Problem 1.1.
- : 48% of the port.
- Each frame is 220 bytes of line time, 1 760 bits: million frames a second.
- , twice the line rate: a utilisation of 2.
- One millisecond of excess in a minute moves the one-minute average by less than 0.002%.
- MB.
- frames.
- .
- It drains at : .
- 1.25 MB.
- bytes.
- bytes, about 3 977 frames.
- The burst offers frames: 35% are dropped.
- Yes: 6 MB is more than 1.25 MB, if the port may borrow the whole block.
- Named result. Zero loss needs 1.25 MB of buffer for this port; with its sixteenth of the shared block, 375 KB, the event drops about 3 977 frames, 35% of the burst.
- of the same burst.
- No: 20 is below 25.
- No: the copies arrive at the same time, on ports of the same block, so each gets the same share and both lose the same kind of frames at the same moment; the lines should go through different switches or blocks.
- The switch’s egress discard counter for the port (per queue); the handler’s gap counter, with gaps filled by neither line.
- Gaps on both lines go to the retransmission server if it has them within its window and rate limits, otherwise to the next snapshot; either way the book is stale meanwhile.
- Because the market event that makes one feed burst makes every feed burst, and a shared buffer is empty only when the bursts are not.
1.9 Interview questions
Interview question 1.1 ★ developer
What is serialisation delay? Why does going from 10 to matter for an order that fits in one small frame?
Solution
Solution of Interview question 1.1.
The time to clock a frame onto the wire: , 67.2 ns for the smallest frame at 10, 26.9 at 25. It is paid at the sender and again at every store-and-forward hop, independently of distance, so it is a large part of a short path.
What the interviewer is looking for: the formula with the 20 bytes of overhead, and that it recurs per hop.
Interview question 1.2 ★ developer, trader
Why is market data sent over UDP multicast and orders over TCP?
Solution
Solution of Interview question 1.2.
Market data goes one to many and must not slow down for anyone: multicast sends one copy that the network replicates, and UDP has no flow control; loss is handled by redundant lines, retransmission and snapshots. Orders go one to one and must arrive exactly once and in order, which TCP guarantees; the session layer builds on it.
What the interviewer is looking for: one-to-many against one-to-one, and where loss recovery lives in each case.
Interview question 1.3 ★★ developer
Explain Nagle’s algorithm and the delayed acknowledgement. What do you set on an order-entry socket, and why?
Solution
Solution of Interview question 1.3.
Nagle holds new small data while earlier data is unacknowledged; the receiver may delay its acknowledgement up to a timer. Together a second small order can wait for the timer. Set TCP_NODELAY, write each message in one call, keep the connection warm, and acknowledge promptly where you control the receiving side.
What the interviewer is looking for: the interaction of the two mechanisms, not only the option’s name.
Interview question 1.4 ★★ developer
The feed handler reports gaps on both lines at the open, but the server’s card shows no drops. Where do you look?
Solution
Solution of Interview question 1.4.
Upstream of the server: the switch port toward it (egress discards during microbursts), the layer-1 or switch path of both lines if they share it, the venue handoff. On the server: the kernel’s receive-buffer drops, which the card does not count. Look at per-port discard counters and at a capture timestamped at the tap.
What the interviewer is looking for: a common cause for both lines and a search that follows the packet path.
Interview question 1.5 ★★ developer
What does IGMP snooping do, and what happens in a trading network without it?
Solution
Solution of Interview question 1.5.
It reads IGMP membership reports and sends each group only to the ports that joined it. Without it every multicast frame is flooded to every port: links and servers carry and discard traffic they did not ask for, and microbursts land on ports that should have been quiet.
What the interviewer is looking for: flooding as the failure, and its cost in bandwidth and CPU.
Interview question 1.6 ★★★ developer, researcher
How would you size the buffer of a switch port that receives several market-data feeds?
Solution
Solution of Interview question 1.6.
From the correlated bursts, not the average: measure the feeds’ joint arrival at microsecond resolution on busy days, compute the backlog of the fluid bound or replay the capture through a queue model, take a high quantile of the peak backlog, and compare it with the buffer the port can actually get when its neighbours are busy too. If it does not fit, raise the port’s speed or spread the feeds.
What the interviewer is looking for: correlation across feeds, shared buffers, and a measured rather than assumed burst.