Markets III: Commodities, Energy and Crypto · Markets
11Freight, Weather and Other Corners
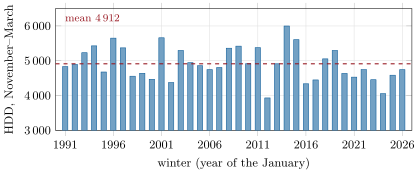
A gas utility in Chicago earns its money in winter. A cold winter fills its pipes and its accounts; a warm one leaves it with gas bought for customers who did not need it. In the winter of 2011/12 the city’s airport recorded 3 932 heating degree days, the fewest in thirty-six winters; two years later it recorded 5 999, the most. The utility can buy a contract that pays it for each degree day by which the winter falls short of a strike, settled on the temperatures measured at that airport. Freight and weather are markets in things that are not commodities at all: the use of a ship for a voyage, the temperature of a season. This chapter covers how ships are chartered and how freight is hedged, how weather is turned into a traded index and priced, and what it takes for any such corner to become a market.
11.1 Freight: charters and routes
Bulk commodities travel in ships hired for the purpose. The hire takes two forms.
Definition 11.1 (Voyage charter, time charter)
A voyage charter hires a ship to carry a cargo between named ports for a freight rate per tonne; the shipowner pays the voyage costs (fuel, port charges). A time charter hires a ship for a period, for a daily rate of hire; the charterer directs its voyages and pays their costs.
Definition 11.2 (Time-charter equivalent)
The time-charter equivalent (TCE) of a voyage is its freight revenue less its voyage costs, divided by its duration in days: the daily hire at which a time charter would earn the owner the same.
Example 11.3 (From a voyage to a daily rate)
A bulk carrier carries 170 000 tonnes of iron ore at $12.00 a tonne: freight of $2.04 million. Fuel costs $600 000 and port charges $150 000, and the round voyage takes 45 days. Its TCE is a day.

Definition 11.4 (Route index)
A route index is a daily assessment, by a panel of shipbrokers under an index provider’s rules, of the rate for a standard ship on a standard route, in dollars per tonne or per day; indices for several routes are averaged into a basket (for Capesize bulk carriers, a weighted average of five time-charter routes).
As of September 2026 — The freight index provider
The Baltic Exchange, which publishes the main dry and wet freight indices, was acquired by Singapore Exchange; the acquisition was completed in November 2016.
11.2 Forward freight agreements
Definition 11.5 (Forward freight agreement)
A forward freight agreement (FFA) is a cash-settled forward on a route index for a future period, usually a month: at settlement the buyer receives, per day (or tonne) of the agreed quantity, the average of the index over the period minus the fixed rate agreed. Most are cleared.
A shipowner that expects to let its ship in six months sells FFAs to lock its hire; a charterer or a trading house that will need ships buys them. Because FFAs settle on a monthly average, they hedge the average rate of the month, not the rate of the day a ship is fixed: the difference is basis risk (Chapter 1).
As of September 2026 — Freight derivatives
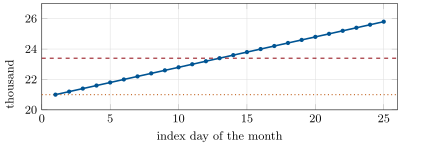
Capesize freight futures and FFAs cleared on Singapore Exchange settle in cash on the arithmetic average of the Baltic Exchange’s daily assessments of the five-route time-charter basket in the contract month; the same indices are cleared as futures by other exchanges.
11.3 Weather: degree days and weather derivatives
Energy demand follows temperature, and temperature can be measured without dispute at a named station. The industry’s index turns a season’s temperatures into one number.
Definition 11.6 (Heating degree day, cooling degree day)
With the average of a day’s maximum and minimum temperatures in degrees Fahrenheit, the day’s heating degree days are and its cooling degree days ; a period’s index is the sum over its days.
Definition 11.7 (Weather derivative)
A weather derivative is a contract whose payoff is a function of a weather index at a named station over a period: a swap that pays a tick per degree day above or below a strike, or an option that pays only on one side, usually with a cap.
As of September 2026 — Exchange-traded weather
Weather derivatives traded over the counter from 1997; the first standalone transaction is described as a Koch Energy and Enron HDD swap for a Milwaukee winter. The Chicago Mercantile Exchange listed HDD futures in September 1999 and CDD futures in January 2000, on indices with a 65°F base. Its rulebook lists thirteen US cities, each read at a named airport weather station (Chicago at O’Hare), sums a calendar month’s degree days, and sets the contract at USD 20 per index point with a one-point tick.
11.4 Pricing weather: burn analysis
A degree-day index has no underlying asset to hedge with and no forward price to replicate: weather cannot be stored or traded. Pricing therefore starts from history.
Definition 11.8 (Burn analysis)
Burn analysis prices a weather contract by applying its payoff to the index values of past seasons, as if each had happened again, and taking the average payout as the fair value, with the distribution of payouts as its risk.
Method 11.9 (Burn analysis with a trend)
(i) Compute the index for each of the last complete seasons at the contract’s station. (ii) Fit a linear trend and move each season onto the trend’s value for the season priced (climate and station changes make old winters look colder than the next one will be). (iii) Apply the payoff to each adjusted season. (iv) The fair value is the mean payout; quote a margin above it for the risk, measured by the frequency and the high quantiles of the payouts.
Example 11.10 (The utility’s put)
On the last thirty winters at O’Hare, detrended to the winter of 2026/27, the burn estimate of the season’s HDD is 4 677. A put struck 10% lower, at 4 209, paying $20 000 per HDD with a $20 million cap, would have paid in 20% of the adjusted winters: $0.61 million on average, $1.60 million in the 90th-percentile winter and $9.30 million in the warmest. Without the detrending the estimate is 4 871 and the average payout $0.56 million.
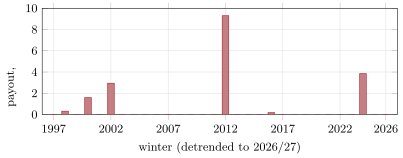
Burn analysis is crude: thirty seasons say little about a one-in-fifty winter, and the trend is itself uncertain. Desks refine it by simulating daily temperatures and by blending in the season’s forecast when it is available, but the price remains an insurance price, set by the capital of those who write the risk.
11.5 What makes a market tradable at all
Freight and weather are corners because only a few conditions made them markets, and markets in other corners have failed for lack of one. The durable ones share five features:
- A hedging need on both sides: shipowners and charterers, utilities and energy traders who are warm-winter losers and winners.
- An index nobody can move: a panel assessment under published rules, a thermometer at an airport.
- Standard contracts: routes, stations, periods and ticks that concentrate liquidity.
- Clearing: margin that lets strangers trade without credit lines.
- Speculators who will warehouse the risk: without them hedgers must find an exact opposite, which rarely exists.
A contract that lacks the second fails when the index can be influenced; one that lacks the first or the fifth never trades.
11.6 Tutorial: degree days and a burn price
Goal. From daily station temperatures, build winter HDD totals, detrend them, and price a degree-day put by burn analysis. End state: Figures 11.3 and 11.4 and the numbers of Example 11.10.
Indices and payoffs.
def hdd(tavg_f: float, base: float = BASE_F) -> float:
    """Heating degree days of one day: how far the day's average falls below the base."""
    return max(0.0, base - tavg_f)


def cdd(tavg_f: float, base: float = BASE_F) -> float:
    return max(0.0, tavg_f - base)


def swap_payoff(index: float, strike: float, tick: float) -> float:
    """Paid to the buyer of a degree-day swap (long the index)."""
    return tick * (index - strike)


def put_payoff(index: float, strike: float, tick: float, cap: float = math.inf) -> float:
    """Paid to the buyer of a degree-day put, capped."""
    return min(tick * max(strike - index, 0.0), cap)


def burn(history: list[float], payoff) -> dict[str, float]:  # noqa: ANN001
    """Burn analysis: apply a payoff to each historical season's index; the fair price is the mean
    payout, and the distribution of payouts measures the risk."""
    pays = sorted(payoff(x) for x in history)
    n = len(pays)
    return {"mean": sum(pays) / n, "max": pays[-1], "p90": pays[min(n - 1, math.ceil(0.9 * n) - 1)],
            "freq": sum(1 for p in pays if p > 0) / n}
Listing 11.1. Degree days, swap and put payoffs, and burn analysis. code/firm/degreeday/firm_degreeday.py The trend.
def detrend(history: list[float], years: list[float], target_year: float) -> list[float]:
    """Remove a least-squares linear trend and re-centre every season on the trend's value in
    `target_year`."""
    n = len(history)
    my, mx = sum(history) / n, sum(years) / n
    b = sum((x - mx) * (y - my) for x, y in zip(years, history, strict=True)) / sum((x - mx) ** 2 for x in years)
    level = my + b * (target_year - mx)
    return [y - (my + b * (x - mx)) + level for x, y in zip(years, history, strict=True)]
Listing 11.2. Detrending past seasons to the season priced. code/firm/degreeday/firm_degreeday.py - Run
m3_weather.stats(),utility_put()andfig_weather.py.
What to change next. Price the same put on the last ten winters only, and see how much the price moves; price a CDD swap for July at the same station.
11.7 Build: degree days and freight settlement
Purpose. The miniature firm writes weather protection for utilities and hedges its own freight: it needs station indices, burn prices and the settlement of freight agreements.
Interface. c10_to_f, daily_average, hdd, cdd; swap_payoff, put_payoff(index, strike, tick, cap); burn(history, payoff); detrend(history, years, target_year); ffa_settlement(daily_index, fixed_rate, days, lots).
Rules. Temperatures in °F, base 65; incomplete seasons are excluded, never filled; the burn quantile is the empirical one; FFA settlement uses the arithmetic mean of published index days.
Acceptance tests. code/firm/degreeday/tests/: unit conversions and degree days; payoffs with a cap; a burn price on four seasons; detrending a linear series; an FFA settlement.
Stretch. Daily temperature simulation (seasonal mean plus autoregressive noise); a portfolio of stations with correlated winters; FFA curves with seasonality.
Sources and further reading
- NOAA National Centers for Environmental Information, GHCN-Daily, station USW00094846 (public domain).
- CME Group, “Overview of weather markets” and rulebook chapter 403 (degree days index futures).
- Baltic Exchange, news of 2016 on the acquisition by SGX; SGX freight contract specifications.
- S. Jewson and A. Brix, Weather Derivative Valuation, Cambridge University Press, 2005.
- CME Rulebook, chapter 403, CME Degree Days Index Futures (Internet Archive copy).
11.8 Exercises
Exercise 11.1 ★
A day has a maximum of 40°F and a minimum of 22°F. Give its HDD and CDD.
Solution
Solution of Exercise 11.1.
The average is 31°F: 34 HDD and 0 CDD.
Exercise 11.2 ★
A voyage earns $1.5 million of freight, costs $450 000 in fuel and $100 000 in port charges, and takes 38 days. Give its TCE.
Solution
Solution of Exercise 11.2.
a day.
Exercise 11.3 ★
Why does an FFA settle on a monthly average rather than on one day’s index?
Solution
Solution of Exercise 11.3.
An average is harder to move by one day’s assessment, matches the way ships are fixed through a month, and makes the index hedgeable by fixing several ships over the period; it also reduces the effect of one broker panel’s judgement on a single day.
Exercise 11.4 ★★
An HDD swap has a strike of 4 700 and a tick of $20 000. The winter comes in at 4 054. Who pays whom, and how much?
Solution
Solution of Exercise 11.4.
The index is 646 below the strike: the buyer (long HDD) pays the seller million.
Exercise 11.5 ★★
An owner sells 30 days of a time-charter FFA at $21 000 a day; the month averages $19 500. What does it receive, and what has it hedged?
Solution
Solution of Exercise 11.5.
It receives , which offsets the lower hire it earns in the market: it has fixed an average of $21 000 a day for the month, up to the basis between its own fixture and the index average.
Exercise 11.6 ★★
Why is burn analysis on detrended winters more expensive, for this put, than on raw winters?
Solution
Solution of Exercise 11.6.
The trend is negative: winters are getting warmer. Moving old winters onto the 2026/27 trend makes them warmer than they were, so more of them fall below the strike and the average payout rises.
Exercise 11.7 ★★★
Coding. With winters, give the number of complete winters, their mean and standard deviation, the warmest and coldest, and the fitted trend per decade.
Solution
Solution of Exercise 11.7.
36 complete winters, 1990/91 to 2025/26; mean 4 912 HDD, standard deviation 477; warmest 2011/12 (3 932), coldest 2013/14 (5 999); trend HDD a decade.
Exercise 11.8 ★★★
Find the flaw. “We price weather options with Black–Scholes on the HDD index, using its historical volatility.”
Solution
Solution of Exercise 11.8.
Black–Scholes prices by replication in a traded underlying; an HDD index is not traded and cannot be held or hedged continuously, its distribution is bounded, seasonal and trend-affected, and the season’s index is known only as it accumulates. Price from the index’s own distribution (burn analysis or simulation of daily temperatures) plus a risk margin.
11.9 Problem: The Warm Winter
Problem 11.1
Weekend problem — a Chicago utility’s winter protection
A gas utility loses about $20 000 of margin for each HDD by which a winter falls short of normal. It considers an HDD put on O’Hare for November 2026 to March 2027, $20 000 per HDD, capped at $20 million.
Part I — The history.
- How many complete winters does the station provide since 1990/91, and what is their mean?
- What is the standard deviation of the winter totals?
- Which winters were the warmest and the coldest, with their totals?
- What trend does a linear fit show?
- Why should the price use a detrended history?
Part II — The burn price.
- Give the detrended burn estimate of the 2026/27 winter.
- Give the strike 10% below it.
- In what share of the adjusted winters does the put pay?
- Give its average payout (the burn price) and its 90th-percentile payout.
- What was its largest payout, and in which winter?
Part III — The deal.
- Why will a seller ask more than the burn price?
- What does the cap protect, and what does it cost the utility?
- How does the utility’s loss differ from the put’s payout (basis)?
- Would a swap be better than a put for the utility? For its shareholders?
- Who might write the put, and how would they hedge it?
Part IV — Judgement.
- What does thirty years of data leave out?
- How would a long-range forecast change the price in October?
- Why do weather markets stay small?
- State the named result: the burn-analysis strike and the one-in-ten-year payout of the put.
- In one sentence: what is a weather derivative?
Solution
Solution of Problem 11.1.
1. 36 winters, mean 4 912 HDD. 2. 477 HDD. 3. Warmest 2011/12 with 3 932, coldest 2013/14 with 5 999. 4. HDD a decade. 5. Recent winters are warmer; an undetrended average overstates the next winter’s HDD and underprices the put. 6. 4 677 HDD. 7. 4 209. 8. 20% (six of thirty winters). 9. $0.61 million on average; $1.60 million in the 90th-percentile winter. 10. $9.30 million, in the winter of 2011/12 adjusted to the 2026/27 trend. 11. The seller holds a skewed risk it cannot hedge: it charges for capital, for the uncertainty in the trend and for the thin history. 12. The seller’s worst case; the utility gives up protection beyond $20 million. 13. The utility’s margin depends on its customers’ temperatures and behaviour, not exactly O’Hare’s HDD: station and volume basis. 14. A swap costs nothing upfront but gives up the gain of a cold winter; the put keeps it for a premium. Shareholders may prefer stable earnings (swap) or upside (put). 15. Energy traders with opposite exposures, reinsurers, and funds seeking uncorrelated risk; they diversify across stations and seasons. 16. Tail winters rarer than one in thirty, changes at the station, and the trend’s own uncertainty. 17. A forecast of a mild winter raises the put’s price, as the distribution shifts; closer to the season the forecast outweighs history. 18. Hedgers’ exposures are local and hard to match with a few stations; basis is large and there are few natural sellers. 19. Named result: a detrended burn estimate of 4 677 HDD, a strike of 4 209, and a one-in-ten-year (90th percentile) payout of $1.60 million. 20. A contract that pays on a measured weather index at a named place, so that those whose income depends on the weather can transfer the risk.
11.10 Interview questions
Interview question 11.1 ★ trader
What is a heating degree day, and who buys HDD protection?
Solution
Solution of Interview question 11.1.
with the day’s mean temperature in °F, summed over the season. Buyers of protection against warm winters: gas and power utilities, heating-oil distributors; against cold: those whose costs rise with heating demand.
What the interviewer is looking for: the definition and the natural hedgers.
Interview question 11.2 ★ trader, researcher
What is a forward freight agreement, and what does it settle on?
Solution
Solution of Interview question 11.2.
A cash-settled forward on a freight route index (dollars per day or per tonne) for a future period, settling on the average of the index over that period against the agreed rate.
What the interviewer is looking for: cash settlement on an average of a panel index.
Interview question 11.3 ★★ researcher
How would you price a weather option, and why not with Black–Scholes?
Solution
Solution of Interview question 11.3.
From the index’s distribution: burn analysis on detrended history, or simulation of daily temperatures with seasonality and autocorrelation, plus a risk loading. Not Black–Scholes: there is no traded underlying to replicate with, and the index is bounded and seasonal.
What the interviewer is looking for: no replication; actuarial plus risk premium.
Interview question 11.4 ★★ trader
A shipowner will have a ship available in six months. How does it hedge, and what risks remain?
Solution
Solution of Interview question 11.4.
Sell FFAs on the relevant route for the months after delivery (or sell a time charter now). Remaining risk: basis between its ship and the index route, timing, and the ship’s availability.
What the interviewer is looking for: the hedge and its basis.
Interview question 11.5 ★★ risk
You sell HDD puts on ten US cities. What is your risk, and how do you measure it?
Solution
Solution of Interview question 11.5.
A short position in warm-winter tails, correlated across cities through large-scale patterns. Measure it with joint historical and simulated winters across the stations, capped payouts, and stress scenarios such as an El Niño winter.
What the interviewer is looking for: correlation across stations and tail measures.
Interview question 11.6 ★★★ researcher, developer
Design a pipeline that prices degree-day contracts for any station daily, from raw weather data to quotes.
Solution
Solution of Interview question 11.6.
Ingest station data with quality flags; fill nothing silently; compute indices by the contract’s rules; detrend and simulate; blend forecasts for near seasons; price payoffs; publish quotes with the risk loading; monitor station changes and data revisions.
What the interviewer is looking for: data quality, contract rules, model and forecast blending.