Markets III: Commodities, Energy and Crypto · Markets
28When Markets Break Together
In the middle of March 2020, as the pandemic closed the world’s economies, equities fell, and so did the assets that are supposed to rise when equities fall. Between 9 and 18 March the yield on ten-year US Treasuries, the world’s safest asset, rose from 0.54% to 1.18% as holders sold them; the broad dollar index rose more than 7%; on 16 March the S&P 500 lost 12%, its worst day since 1987. Investors were not choosing between risky and safe assets any more; they were selling whatever they could to raise cash. Earlier chapters described each market’s own crises: power prices in 2022, nickel on the London Metal Exchange, crypto liquidation cascades, FTX. This chapter is about the days when the crises are the same crisis, and the connections between markets that are invisible in calm, common holders, common financing, common margin rules, become the only thing that matters. It sets out the mechanics, goes through 2008, March 2020 and 2022 from the point of view of the desks in this book, and builds a simulator of the spiral.
28.1 The mechanics of joint stress: fire sales, loss and margin spirals
Definition 28.1 (Fire sale)
A fire sale is a sale forced on a holder by a need for cash or a margin call, at a price below what the asset is worth to buyers who are not themselves constrained, because the natural buyers of the asset are selling too.
Definition 28.2 (Loss spiral, margin spiral)
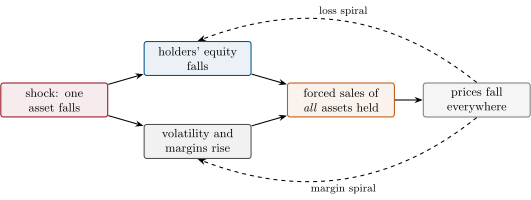
A loss spiral is the feedback in which a leveraged holder’s losses force it to sell, its sales lower prices, and the lower prices inflict further losses on it and on other holders of the same assets. A margin spiral is the feedback in which rising volatility raises margin requirements, the higher margins force deleveraging, and the forced sales raise volatility further.
Brunnermeier and Pedersen gave the two spirals their names in a model of how funding liquidity and market liquidity feed each other, the liquidity spiral of One Quant Book 1, chapter 31. Two properties turn them into a cross-market event. Leveraged holders own many assets, so a loss in one forces sales of all of them; and margins and haircuts are set on each asset’s own recent volatility, so they rise everywhere at once. The asset that is sold is not the one that fell, but the one that can be sold.
Proposition 28.3 (The forced-sale multiplier without impact)
A holder whose equity falls short of its margin requirement by , on positions with margin rate , must sell of them to restore its margin, if prices do not move: each dollar sold releases of requirement and leaves equity unchanged. With price impact, each sale lowers the prices of the positions kept and the equity with them, and the forced sales per dollar of initial shortfall exceed .
Proof. Selling a dollar of position at the market price changes equity by nothing and the requirement by ; restoring takes . With impact the sold positions move prices against the remaining ones, creating a new shortfall that must be met by further sales. ∎
Definition 28.4 (Flight to quality, correlation breakdown)
A flight to quality is a shift of investors out of risky assets into those perceived as safest, typically raising the prices of government bonds while other assets fall. A correlation breakdown is a sudden change in the correlations between assets in a stress, usually towards one as forced selling moves them together, which invalidates hedges and risk estimates calibrated in calm.
28.2 2008
The crisis of 2008 is the template: leveraged institutions financed short term against securities whose values and haircuts moved together, and the failure of one of them, Lehman Brothers, on 15 September 2008, turned doubts about each into a run on all. The clearing houses of One Quant Book 1 held: LCH’s swap service managed Lehman’s portfolio of 66 390 trades with a notional of USD 9 trillion within the margin it held, by hedging and auctioning it between 24 September and 3 October, without using its default fund. The losses came elsewhere, in the uncleared and the financed: short-term funding that stopped rolling and haircuts that rose on collateral of every kind. The lessons that shaped the post-2008 system, central clearing, margin for uncleared derivatives, bank liquidity rules, are the reason the next crisis looked different.
28.3 March 2020
As of September 2026 — The March 2020 turmoil
The Financial Stability Board’s review distinguishes a flight to safety from late February to early March 2020, in which investors sold risky assets and bought safe ones, and a “dash for cash” in mid-March, in which they sold risky and relatively safe assets alike to obtain cash; equities and government bonds then fell together, volatility rose even for government bonds and gold, and correlations broke down. On 16 March the S&P 500 lost 12%, its worst day since 1987, and the VIX reached its all-time peak of 83. Market dysfunction in US Treasuries was exacerbated by sales by some leveraged non-bank investors and foreign holders. The Basel Committee, CPMI and IOSCO reported that initial margin requirements at central counterparties rose by roughly USD 300 billion over March 2020, with a peak variation margin call of USD 140 billion on 9 March.
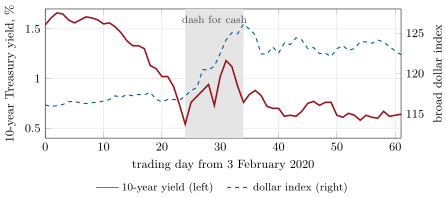
The desks of this book saw the same week through different windows. The rates desk saw Treasuries sold with equities and the futures basis blow out (One Quant Book 2). The commodity desk saw oil collapse for reasons of its own (the storage chapters of this book, and the negative WTI settlement of the next month) while margins on everything rose. A crypto desk saw bitcoin sold with everything else, whatever its reputation as a hedge: its Coinbase price, as FRED records it, fell from 7 957 dollars on 11 March to 4 980 on 12 March, 37% in a day. Every desk saw its margins rise the same week, which is the margin spiral seen from the inside.
28.4 2022: energy margins, nickel, gilts and crypto
2022 had no single crash but a sequence of spirals in different markets, each driven by the same mechanics in a different place. European gas and power prices rose so far (Chapter 4) that the cash margin on futures hedges became, for firms hedging physical positions, the liquidity risk described in Chapter 13. The ECB found initial margin on commodity portfolios about twice as high by mid-2022 as in late 2021, commodities making up about 2% of the gross notional of euro-area derivatives but over 20% of the initial margin posted, and four banks clearing about 85% of exchange-traded energy positions; the gas importer Uniper had drawn the whole of a EUR 9 billion credit line from the German state bank KfW by 29 August, and asked for 4 billion more, as gas curtailments and prices raised its margining needs. In March, nickel on the London Metal Exchange rose from about 30 000 to over 100 000 dollars a tonne in a day and a morning, the day’s margin calls reached about USD 7 billion and three clearing members failed to pay on time, and the exchange suspended trading and cancelled a morning’s trades (Chapter 8). In September, UK pension funds’ liability-driven investment strategies met margin calls on their gilt positions as long yields rose faster than ever, sold gilts to pay them, and pushed yields higher, until the Bank of England bought long gilts (One Quant Book 2, chapter 7). In crypto, the algorithmic stablecoin UST lost its peg in May and fell close to zero (Chapter 23); Three Arrows Capital, a crypto fund reported to manage over USD 3 billion that had borrowed coins and dollars from several lenders, received notices of default from them as prices fell and was put into liquidation in the British Virgin Islands on 27 June; and FTX failed in November (Chapter 15).
28.5 What each desk saw
The same mechanics look different from each desk. For the trading firm the lessons are practical. Collateral is the constraint: in every episode the losers were not wrong about value but short of cash when margins rose, so the firm’s liquidity plan must assume that margins rise on all its venues at once. Hedges fail when correlations break: a hedge estimated in calm (bonds against equities, bitcoin against equities, one venue against another) may move the same way in a dash for cash. Common holders make distant markets neighbours: the firm must know who else holds what it holds, with what leverage. And stress tests (One Quant Book 6) must include the joint scenario, not only each market’s worst day. The simulator of this chapter makes the point with numbers.
| Case | forced sales, USD bn | multiplier | correlation after |
|---|---|---|---|
| Base case | 223.6 | 8.88 | 0.99 |
| Eight steps a day | 225.6 | 8.73 | 0.99 |
| No margin spiral (fixed margins) | 0.0 | 0.00 | 0.11 |
| No loss spiral (equity not marked) | 121.9 | 4.94 | 0.98 |
| No price impact | 124.4 | 4.94 | 0.11 |
| One asset per holder | 183.8 | 4.67 | 0.04 |
28.6 Tutorial: a margin spiral across three assets
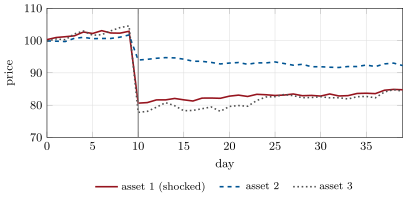
Goal. Simulate a margin spiral across three assets held by leveraged investors, with margins rising with volatility and forced sales moving prices, measure how correlations rise in the stress, check the result under a finer time step, and ablate each mechanism. End state: Figure 28.3, Table 28.1 and the numbers of the weekend problem.
Deleveraging. Each holder short of margin sells the same fraction of everything; sales move prices.
def _deleverage(prices, pos, equity, rates, p: Params, res: Result) -> list[float]:
    """Holders below their requirement sell the fraction 1 - equity / requirement of every position (all of
    it if equity is gone); the dollars sold per asset then move prices by the linear impact."""
    k = len(prices)
    sold = [0.0] * k
    for h in range(len(pos)):
        req = _req(pos[h], prices, rates)
        if req <= 0 or equity[h] >= req:
            continue
        x = 1.0 if equity[h] <= 0 else 1 - equity[h] / req
        if equity[h] <= 0 and any(pos[h]):
            res.defaults += 1
        for j in range(k):
            dq = x * pos[h][j]
            sold[j] += dq * prices[j]
            pos[h][j] -= dq
    impact = [-p.impact[j] * sold[j] for j in range(k)]
    if any(impact):
        _move(prices, pos, equity, impact, p)
    return sold
Listing 28.1. Forced sales and their price impact. code/firm/marginspiral/firm_marginspiral.py - Stability and ablations.
ablation_table()runs the base case, eight steps a day, and each mechanism switched off. - Run
correlations()andfig_break.py.
What to change next. Give holders different leverage and see who defaults first; add a cash buffer and find the size at which the spiral stops; let margins respond with a lag, as a clearing house’s model with a look-back would.
28.7 Build: the margin-spiral simulator
Purpose. The miniature firm’s stress tests must include the joint scenario in which its own margins rise on every venue while the assets it holds fall together; the simulator produces those scenarios and measures how much forced selling a shock creates.
Interface. Params (volatilities, correlation, base margins, impact, holders, leverage, days, shock, EWMA decay, substeps, switches for the margin spiral, the loss spiral, cross-holding and forced selling); simulate(params) returning prices, returns, forced sales, the initial shortfall and defaults; forced_sale_multiplier; correlation(result, a, b, days).
Rules. Deleveraging iterated to a fixed point within each step, so that results do not depend on the step size; log price impact, so prices stay positive; every mechanism can be switched off.
Acceptance tests. code/firm/marginspiral/tests/: the multiplier equals without impact and loss spiral; stability under a finer time step; each ablation lowers forced sales or correlation; no forced sales when forced selling is off.
Stretch. Heterogeneous holders and a cash buffer; lagged margin models; a second shock; calibration of impact to a market’s depth.
Sources and further reading
- M. K. Brunnermeier and L. H. Pedersen, “Market Liquidity and Funding Liquidity”, Review of Financial Studies 22(6), 2009.
- Financial Stability Board, Holistic Review of the March Market Turmoil, 17 November 2020.
- BCBS–CPMI–IOSCO, press release on margining practices, 29 September 2022; LCH.Clearnet press release on the Lehman default, 8 October 2008 (see One Quant Book 1’s ledgers).
- FRED, series DGS10, DTWEXBGS and CBBTCUSD; chapters 8, 13, 15 and 23 of this book and One Quant Book 2, chapter 7, for 2022.
- ECB, Financial Stability Review, November 2022, special feature “Financial stability risks from energy derivatives markets”; Fortum, press release on Uniper’s KfW facility, 29 August 2022.
- In re Three Arrows Capital Ltd., No. 22-10920 (Bankr. S.D.N.Y.), verified petition and declaration of the joint liquidators, 1 July 2022.
28.8 Exercises
Exercise 28.1 ★
A holder is short of margin by USD 10 million on positions margined at 12.5%. How much must it sell if prices do not move?
Solution
Solution of Exercise 28.1.
USD 80 million.
Exercise 28.2 ★
Distinguish a flight to quality from a dash for cash, and say what each does to government bond prices.
Solution
Solution of Exercise 28.2.
In a flight to quality investors sell risky assets and buy the safest, raising government bond prices; in a dash for cash they sell whatever can be sold, safe assets included, to raise cash, and government bond prices fall with the rest.
Exercise 28.3 ★
Why can an asset regarded as a hedge fall with equities in a dash for cash?
Solution
Solution of Exercise 28.3.
Because it is held by the same leveraged investors who need cash: in a dash for cash assets are sold for their liquidity, not for their outlook, and the correlations estimated in calm break down.
Exercise 28.4 ★★
From Table 28.1, how much of the base case’s forced selling is due to price impact and the loss spiral together?
Solution
Solution of Exercise 28.4.
USD 223.6 billion against 124.4 billion without price impact: about USD 99.3 billion, 44%, comes from the prices that forced sales move, and the losses they inflict.
Exercise 28.5 ★★
The ten-year yield rose from 0.54% to 1.18% between 9 and 18 March 2020. With a modified duration of 9, what did a ten-year Treasury lose?
Solution
Solution of Exercise 28.5.
About of its value in seven trading days, for the safest asset in the world.
Exercise 28.6 ★★
Why does a correlation breakdown invalidate a value-at-risk estimated on calm data?
Solution
Solution of Exercise 28.6.
Value-at-risk aggregates positions with a correlation matrix; if correlations move towards one in stress, offsets estimated in calm disappear and the losses add up, so the calm estimate understates the loss exactly when it matters.
Exercise 28.7 ★★★
Coding. With run, halve the leverage. What happens to forced sales and the multiplier?
Solution
Solution of Exercise 28.7.
At 4 times leverage the shock creates no shortfall: equity covers the higher margins, nothing is sold, and the spiral never starts. Leverage decides whether the shock is absorbed or amplified.
Exercise 28.8 ★★★
Find the flaw. “Our portfolio is diversified across rates, commodities and crypto, so a crisis in one will not hit the others.”
Solution
Solution of Exercise 28.8.
Diversification by asset class does not help when the holders, the financing and the margin rules are common: in a joint stress the firm’s margins rise everywhere at once, and assets held by the same leveraged investors are sold together.
28.9 Problem: March 2020 Across the Desks
Problem 28.1
Weekend problem — how much selling does a shock force?
Use the tutorial’s simulator: 40 holders, each with USD 1 billion of equity and 8 times leverage spread over three assets, margins rising with EWMA volatility, and a 10% shock to asset 1 on day 10.
Part I — The shock.
- What margin shortfall does the shock create across the holders?
- How much do they sell by force over the run?
- What is the forced-sale multiplier?
- What would the multiplier be without price impact, and why?
- What happens to assets 2 and 3, which the shock did not touch?
Part II — The mechanisms.
- What does the result become with eight steps a day, and why does that matter?
- What happens with fixed margins?
- And if each holder owns only one asset?
- How does the correlation between assets 1 and 2 change after the shock?
- Which mechanism does most of the amplification?
Part III — The history.
- What did the rates desk see in March 2020?
- What did clearing houses do to margins that month?
- Why did LCH’s handling of Lehman in 2008 not prevent the crisis?
- Which 2022 episode most resembles the simulator, and why?
- What did central banks do in each episode that the simulator leaves out?
Part IV — Judgement.
- Should clearing houses raise margins in a crisis?
- How should a trading firm size its liquidity buffer for joint stress?
- What would you monitor to see a spiral coming?
- State the named result: the forced-sale multiplier of the spiral for the stated leverage and impact, and without impact.
- In one sentence: why do markets break together?
Solution
Solution of Problem 28.1.
1. About USD 25.2 billion. 2. About USD 223.6 billion. 3. 8.88. 4. 4.94, the reciprocal of the average margin rate after margins rose (Proposition 28.3): each dollar sold releases only the margin rate of requirement. 5. They fall with it, to about 93 and 80 on day 20, because they are sold to meet margin calls on the whole portfolio. 6. 8.73: the result does not depend on the step, because deleveraging is iterated to a fixed point in each step. 7. In this run the shock is absorbed without forced sales: the spiral needs margins that rise. 8. Forced sales stay high but the correlation of the untouched assets with the shocked one stays near zero: common holders are what joins the markets. 9. From 0.30 to 0.99. 10. The margin spiral starts it here and price impact nearly doubles it. 11. Treasuries sold with equities, yields up sharply, market depth collapsing, and the basis between cash bonds and futures dislocated. 12. Raised initial margins by roughly USD 300 billion over the month, with variation margin calls peaking at USD 140 billion on 9 March. 13. It contained the cleared swaps; the crisis ran through uncleared derivatives and short-term funding, and through haircuts on collateral of every kind. 14. The gilt episode: leveraged holders, margin calls rising with the move, forced sales into a falling market, until a buyer of last resort stepped in. 15. Central banks bought the assets being sold and supplied liquidity, which breaks both spirals from outside. 16. They must cover the risk they see, but margins that jump with volatility are procyclical; stable, conservative margins and liquidity buffers built in calm, or anti-procyclicality floors, reduce the spiral. 17. From the margin increase on all its positions at once in a stress calibrated on episodes like March 2020, plus funding that may not roll, held in cash or assets that stay liquid in a dash for cash. 18. Leverage and crowding in its markets, margin changes announced by clearing houses, funding spreads and repo haircuts, market depth, and correlations between assets that are usually independent. 19. Named result: a forced-sale multiplier of 8.88 dollars of forced sales per dollar of initial margin shortfall (8.73 with eight steps a day), against 4.94 without price impact. 20. Because they share holders, financing and margin rules, and in a crisis those links carry the selling from one market to all.
28.10 Interview questions
Interview question 28.1 ★ risk
What are loss spirals and margin spirals?
Solution
Solution of Interview question 28.1.
A loss spiral: losses force sales, sales lower prices, lower prices cause losses. A margin spiral: volatility raises margins, margins force sales, sales raise volatility. Together they turn a shock into forced selling across everything leveraged holders own.
What the interviewer is looking for: both feedbacks and why they cross markets.
Interview question 28.2 ★ trader
Why did Treasuries fall in the middle of March 2020?
Solution
Solution of Interview question 28.2.
In the dash for cash, holders sold what they could sell to raise dollars; leveraged non-bank investors and foreign holders sold Treasuries; dealers could not absorb the flow, depth collapsed and yields rose.
What the interviewer is looking for: liquidity demand, not credit risk.
Interview question 28.3 ★★ researcher
How would you estimate correlations for a stress scenario?
Solution
Solution of Interview question 28.3.
From past stress windows rather than full samples, with correlations pushed towards one for assets held by the same leveraged investors, and by simulation of forced selling on known holdings, checked against the episodes of 2008, 2020 and 2022.
What the interviewer is looking for: conditional correlations and structural reasoning.
Interview question 28.4 ★★ risk
Design a liquidity stress test for a firm trading futures, crypto perpetuals and FX forwards.
Solution
Solution of Interview question 28.4.
Scenario: margins up by the worst historical increase on every venue at once, prices down jointly, funding lines not rolled, stablecoin depeg and venue withdrawals slowed; compute the cash needed day by day against the cash and liquid collateral available, including transfer times between venues; set buffers and limits so the firm survives it without forced sales.
What the interviewer is looking for: joint margins, transfer times and a day-by-day cash ladder.
Interview question 28.5 ★★ trader, risk
Your hedge fund client is long Treasuries and short futures with 50 times leverage. What happens to it in a dash for cash?
Solution
Solution of Interview question 28.5.
The basis widens against it and futures margins rise at once; at 50 times leverage a small move exhausts its equity and it must sell Treasuries and buy back futures into a falling market, adding to the dash for cash; its prime broker may raise haircuts or pull financing.
What the interviewer is looking for: margin, haircut and forced unwind.
Interview question 28.6 ★★★ researcher, developer
Build a simulator of a margin spiral and explain how you would make sure its results are not an artefact of its time step.
Solution
Solution of Interview question 28.6.
Holders with positions and equity, margin rules on measured volatility, a price-impact function, a shock; deleverage to a fixed point within each step and run with several step sizes, checking that results converge; ablate each mechanism and check that the effects go the right way.
What the interviewer is looking for: fixed points, convergence in the step, and ablations.