Markets III: Commodities, Energy and Crypto · Markets
9Agriculturals and Softs
At noon Eastern time on 30 June 2026 the US Department of Agriculture published its estimate of the acreage American farmers had planted that spring: corn down 3% on the year, soybeans up 5%. For the traders watching, the minutes after noon were the most important of the season: the number told them how much corn would exist in the autumn, and the futures repriced it before most farmers had read the release. Agricultural markets run on calendars that nature sets and governments measure. This chapter covers the crop year and its spreads, the reports that move the market, the weather, the daily limits that can lock a trader in, and the weekly report that shows who holds what.
9.1 Crop calendars and the old-crop, new-crop spread
Definition 9.1 (Crop year, old crop, new crop)
The crop year (marketing year) of a crop is the twelve-month period over which one harvest is sold and used; for US corn it runs from 1 September to 31 August. Old crop is grain from the harvest already in store; new crop is grain from the harvest to come. Futures delivering before the new harvest price old crop, those after it new crop.
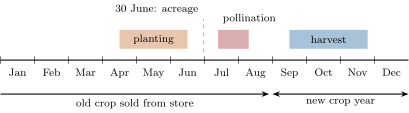
The spread between the last old-crop contract and the first new-crop contract (for corn, July against December) is a bet on the size of the new harvest against the stocks left from the old. A short old crop and a big new one put the July far above December; a glut of old grain and a failing new crop invert it.
9.2 Government reports
Definition 9.2 (WASDE report, stocks-to-use ratio)
The WASDE report (World Agricultural Supply and Demand Estimates) is the US Department of Agriculture’s monthly balance sheet of supply, use and ending stocks for the major crops, in the United States and the world. The stocks-to-use ratio is the ending stocks of a marketing year divided by that year’s total use: the buffer the market will carry into the next harvest.
The price of a storable crop is set by how scarce it will be at the end of the year: a low stocks-to-use ratio means a thin buffer and a price that must ration use; a high one means storage must be paid for. Reports that revise the balance sheet move the price immediately.
As of September 2026 — Report times
WASDE is released at 12:00 Eastern time, usually between the 8th and the 12th of each month. The Acreage report of the National Agricultural Statistics Service is released at noon Eastern at the end of June; on 30 June 2026 it put corn planted acreage 3% below 2025 and soybeans 5% above.
Example 9.3 (A stocks-to-use surprise)
A balance sheet with 15.0 billion bushels of use and 1.8 billion of ending stocks has a stocks-to-use ratio of 12.0%. A report that cuts the crop by 300 million bushels, with use unchanged, cuts ending stocks to 1.5 billion: 10.0%. The price must rise until use falls enough to rebuild the buffer the market wants to hold.
9.3 Weather
For a growing crop, weather is the dominant risk, and it is concentrated in a few weeks: for corn, pollination in July, when heat and drought cut yields most. Traders buy that risk ahead of the weeks and sell it afterwards, a pattern called the weather premium; forecasts from the main numerical models move prices during the season as reliably as reports do.
9.4 Daily limits
Grain futures have daily price limits: a contract cannot trade more than a set amount above or below the previous settlement. The limit is a price limit of the kind One Quant Book 1, chapter 12, described for shares.
Definition 9.4 (Limit-locked market, expanded limit)
A limit-locked market is one whose price has reached the daily limit with orders on one side only: no trade can happen at a price beyond it, so positions cannot be closed. An expanded limit is the wider limit that applies on the day after a contract settles at its limit.
As of September 2026 — Grain limits
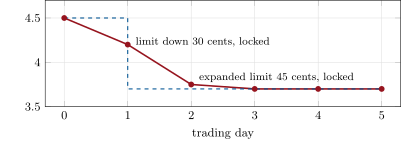
CBOT corn futures: 5 000 bushels, quoted in cents per bushel. Their limits are reset every six months: 7% of the average settlement of a reference contract over 45 trading days, rounded to the nearest 5 cents, with a floor of 20 cents; the expanded limit is 1.5 times that, rounded up. At an average of $4.50 the limit is 30 cents and the expanded limit 45 cents. For trade date 8 September 2026 CME Group listed the corn limit at 30 cents (60 cents for calendar spreads).
Proposition 9.5 (Margin to survive a lock)
If news moves the fair price of a contract by beyond its limit , with expanded limit , a holder on the wrong side cannot exit until the price reaches the fair value: it loses on the first day and on each further locked day, and needs margin for every locked day before it can trade. With the lock lasts two days.
Proof. Each locked day the settlement moves by the day’s limit and no trade is possible at the fair price; the lock ends on the first day the remaining gap is within the limit. ∎
9.5 Positioning reports
Definition 9.6 (Commitments of Traders report, managed money)
The Commitments of Traders report (COT) is the weekly publication by the US Commodity Futures Trading Commission of the aggregate long and short positions of large traders in each futures market, by category, as of Tuesday. In its disaggregated form managed money is the category of commodity trading advisors, commodity pool operators and funds that trade on behalf of clients, as distinct from producers and merchants, swap dealers and other reportable traders.
As of September 2026 — The COT schedule
The Commission releases the report every Friday at 15:30 Eastern time, with positions as of the previous Tuesday.
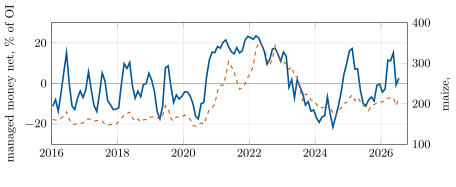
In the weekly corn data from January 2016 to September 2026, managed money was net long a record 24.4% of open interest on 22 March 2022 and net short 22.8% on 9 July 2024; it was net short in 300 of 559 weeks, and on 15 September 2026 it was net long 22.5%, 2.26 standard deviations above its average of the previous three years. Traders read the report as a measure of crowding: a market in which funds are already very long has fewer buyers left if the news disappoints.
9.6 Softs and the crush
Definition 9.7 (Softs)
Softs are agricultural commodities that are grown rather than mined and are not grains or livestock: coffee, cocoa, sugar, cotton and orange juice.
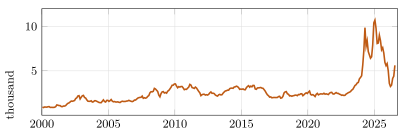
Softs are grown in few countries, often by smallholders, and their supply shocks are concentrated. The IMF’s monthly cocoa price averaged $2 369 a tonne in 2022; it then rose more than fourfold, to a monthly average of $10 710 in January 2025, and was $5 619 in July 2026 (Figure 9.4). The International Cocoa Organization reported that both the 2022/23 and 2023/24 seasons ended in deficit, the second after weather, diseases and pests cut the crops of the main West African producers.
Processing links crops to their products. A soybean crusher turns beans into meal (animal feed) and oil (food and fuel).
Definition 9.8 (Crush spread)
The crush spread is the value of the meal and oil from one bushel of soybeans minus the price of the bushel. At the exchange’s conventional yields of 44 pounds of meal and 11 pounds of oil per 60-pound bushel it is, in dollars per bushel, , with meal in dollars per short ton and oil in cents per pound.
The crush is to a soybean processor what the crack is to a refiner (Chapter 3): its margin, hedged by buying beans and selling meal and oil, in the ratio of ten soybean contracts to eleven of meal and nine of oil.
9.7 Tutorial: positioning and limits
Goal. Turn the COT files into a positioning measure, and compute the limits and the lock of a report day. End state: Figures 9.3 and 9.2 and the margin of the weekend problem.
Positioning. Net positions, their share of open interest and a trailing z-score.
def net(row: dict[str, int], category: str) -> int:
    return row[f"{category}_long"] - row[f"{category}_short"]


def net_share(row: dict[str, int], category: str) -> float:
    """Net position of a category as a share of total open interest."""
    return net(row, category) / row["open_interest"]


def zscore(values: list[float], window: int) -> list[float | None]:
    """Trailing z-score of each value against the previous `window` values (None until enough)."""
    out: list[float | None] = []
    for i, v in enumerate(values):
        past = values[max(0, i - window):i]
        if len(past) < window:
            out.append(None)
            continue
        m = sum(past) / window
        sd = math.sqrt(sum((x - m) ** 2 for x in past) / (window - 1))
        out.append((v - m) / sd if sd > 0 else 0.0)
    return out
Listing 9.1. Net positions and their trailing z-score. code/firm/cot/firm_cot.py Limits. The variable-limit rule and the path of a locked market.
def variable_limit(average_price: float) -> tuple[float, float]:
    """(initial, expanded) daily limits in dollars per bushel from an average settlement price."""
    initial = max(round(0.07 * average_price / 0.05) * 0.05, 0.20)
    expanded = math.ceil(round(1.5 * initial / 0.05, 9)) * 0.05
    return round(initial, 2), round(expanded, 2)


@dataclass(frozen=True)
class Day:
    settle: float
    locked: bool


def limit_path(start: float, fair: float, limit: float, expanded: float, days: int = 5) -> list[Day]:
    """Settlements when news moves the fair price to `fair`: each day the price moves toward it by at
    most the day's limit; a day that closes at the limit is locked, and the next day uses the
    expanded limit (the normal limit returns after a day that does not close at the limit)."""
    out, p, lim = [], start, limit
    for _ in range(days):
        gap = fair - p
        if abs(gap) > lim + 1e-12:
            p += math.copysign(lim, gap)
            out.append(Day(round(p, 4), True))
            lim = expanded
        else:
            p = fair
            out.append(Day(round(p, 4), False))
            lim = limit
    return out
Listing 9.2. The limit rule and a limit-locked price path. code/firm/cot/firm_cot.py - Run
m3_ags.mm_stats(),report_day()andfig_ags.py.
What to change next. Compute the same measure for soybeans and wheat and see whether funds’ positions in the three move together; test whether extreme positioning predicts the next month’s return, correcting for the overlap of the weekly samples.
9.8 Build: the positioning parser and limit state
Purpose. The miniature firm trades grains around reports: it needs weekly positioning by category, the current daily limits of each contract, and the state of a limit-locked market for its risk system and its order router, which must not send orders that cannot trade.
Interface. net(row, category), net_share, zscore(values, window); variable_limit(average_price); limit_path(start, fair, limit, expanded); crush_margin(beans, meal, oil_cents).
Rules. Positions are integers in contracts; z-scores use only past values; the expanded limit applies only the day after a limit close; limits in dollars per bushel to the cent.
Acceptance tests. code/firm/cot/tests/: net positions; the z-score window; the limit rule at three price levels including the floor; a two-day lock; the board crush.
Stretch. Feed limit states to firm.calendar (One Quant Book 1, chapter 22); read the COT files directly from the Commission’s archive format.
Sources and further reading
- US Commodity Futures Trading Commission, Commitments of Traders: about the reports, release schedule, disaggregated historical files 2016–2026.
- USDA, WASDE; National Agricultural Statistics Service, Acreage, 30 June 2026; ERS feed grains documentation (marketing years).
- CME Group, CBOT rulebook chapter 10 (corn) and grain price-limit reset notices; soybean crush reference guide.
- International Monetary Fund, Primary Commodity Prices (cocoa, maize) via FRED.
- International Cocoa Organization, Quarterly Bulletin of Cocoa Statistics, November 2024 (summary).
- CME Group, price limits page for agricultural futures, trade date 8 September 2026 (Internet Archive copy).
9.9 Exercises
Exercise 9.1 ★
Ending stocks are 1.2 billion bushels and total use 14.8 billion. Give the stocks-to-use ratio.
Solution
Solution of Exercise 9.1.
.
Exercise 9.2 ★
Give the initial and expanded limits for corn averaging $4.00 and $6.00 a bushel.
Solution
Solution of Exercise 9.2.
At $4.00: 7% is 28 cents, rounded to 30; expanded 45. At $6.00: 42 cents, rounded to 40; expanded 60.
Exercise 9.3 ★
Why is July corn an old-crop contract and December a new-crop one?
Exercise 9.4 ★★
Meal is $300 a short ton, oil 50 cents a pound, beans $10.00 a bushel. Give the board crush.
Solution
Solution of Exercise 9.4.
a bushel.
Exercise 9.5 ★★
A report moves corn’s fair value down $0.60 with limits of 30 and 45 cents. How many days is a long locked, and what does it lose per contract before it can sell?
Solution
Solution of Exercise 9.5.
One locked day (30 cents), then the remaining 30 cents is within the expanded limit and the market trades at the fair price on day 2. The loss is 60 cents, $3 000 per contract.
Exercise 9.6 ★★
Funds hold a record net long just before a report that disappoints. Why might the fall be larger than the report alone justifies?
Solution
Solution of Exercise 9.6.
Crowded longs must sell on the same news, and there are few new buyers left: forced selling adds to the fundamental move, and in a limit market it can lock the price for days.
Exercise 9.7 ★★★
Coding. With mm_series, give managed money’s largest net long and net short in corn since 2016, their dates, and the number of weeks net short.
Solution
Solution of Exercise 9.7.
Net long 24.4% of open interest on 22 March 2022; net short 22.8% on 9 July 2024; net short in 300 of 559 weeks.
Exercise 9.8 ★★★
Find the flaw. “Managed money’s net position and the price move together, so the funds cause the price moves; we will trade ahead of them.”
Solution
Solution of Exercise 9.8.
Correlation does not give direction: funds that follow trends buy after prices rise, so their positions may follow prices rather than lead them. The report is also published three days after the positions it shows. A strategy needs evidence that positions predict later returns, tested out of sample on data available at the time.
9.10 Problem: Report Day
Problem 9.1
Weekend problem — a long locked in by a report
A trader holds 50 corn futures long at $4.50 a bushel. A report cuts the fair price to $3.70. Limits follow the rule of the dated box for an average price of $4.50.
Part I — The limits.
- Give the initial and expanded limits.
- What is the contract’s value per bushel move?
- Where does corn settle on the first day?
- And on the second?
- On which day can the trader sell, and at what price?
Part II — The money.
- What variation margin does the trader pay on day 1?
- And on day 2?
- What margin must it hold to survive both locked days?
- What is its total loss when it sells on day 3?
- What would a stop-loss order at $4.30 have done?
Part III — Hedges.
- Could it have hedged with options during the lock? At what price?
- Could it have sold a related contract (another month, another exchange)?
- How does a producer hedging its crop experience the same days?
- Why do exchanges keep limits despite this?
- How would you size a position before a report, given the limits?
Part IV — Judgement.
- What does the COT report tell you about the risk of such a report day?
- Why is a limit not a cap on the loss?
- How does a lock change the value of liquidity?
- State the named result: the margin needed to survive the lock, per contract and for the position.
- In one sentence: what is a daily limit?
Solution
Solution of Problem 9.1.
1. 30 and 45 cents. 2. $50 per cent per contract ($12.50 per quarter-cent tick). 3. $4.20, locked. 4. $3.75, locked at the expanded limit. 5. Day 3, at $3.70. 6. . 7. $112 500. 8. $187 500 ($3 750 per contract). 9. $200 000. 10. Nothing during the lock: it becomes a market order that fills only when trading resumes, near $3.70. 11. Options may keep trading and price the fair value, at a premium reflecting it; synthetic futures from options reveal the locked contract’s true price. 12. Possibly other months or an overseas contract, with basis risk. 13. Its short hedge gains margin in cash while its crop loses value: it is paid, not called. 14. Limits give time to raise margin and slow panics; the cost is illiquidity. 15. So that the margin for two or three locked days is covered and the loss is tolerable, not by the usual volatility. 16. How crowded the positioning is: crowded positions add forced selling. 17. It caps the daily move, not the total one: the price keeps moving on later days. 18. Liquidity is worth most when you cannot trade: the ability to hedge elsewhere or to fund margin is what survives the lock. 19. Named result: $3 750 per contract, $187 500 for 50 contracts. 20. A maximum daily move that delays, but does not cancel, a price change.
9.11 Interview questions
Interview question 9.1 ★ trader
What is the stocks-to-use ratio and why does the price depend on it non-linearly?
Solution
Solution of Interview question 9.1.
Ending stocks over total use: the buffer carried into the next harvest. When the buffer is thin, only a higher price can ration use, and demand for a staple is inelastic, so the price rises steeply as the ratio falls; when it is ample, price is set by the cost of storage.
What the interviewer is looking for: inelastic demand and a convex price response.
Interview question 9.2 ★ trader, researcher
What is a limit-locked market, and how do you manage the risk of one?
Solution
Solution of Interview question 9.2.
A market at its daily limit with orders on one side only: positions cannot be closed. Manage it by sizing for several locked days, by hedging in instruments that keep trading (options, other contracts), and by holding margin liquidity.
What the interviewer is looking for: size to the lock, alternatives, funding.
Interview question 9.3 ★★ researcher
How would you build a signal from the COT report without look-ahead bias?
Solution
Solution of Interview question 9.3.
Use the release date (Friday), not the report date (Tuesday), as the time the data are known; normalise positions (share of open interest, z-score against the past only); test on out-of-sample years with non-overlapping returns; account for revisions and category changes.
What the interviewer is looking for: release-date alignment and honest normalisation.
Interview question 9.4 ★★ trader
Explain the soybean crush and how a processor hedges it.
Solution
Solution of Interview question 9.4.
Beans in, meal and oil out; its margin is the crush. It hedges by buying soybean futures and selling meal and oil futures in the board ratio, locking the margin on its planned throughput.
What the interviewer is looking for: the product-input spread and the ratio.
Interview question 9.5 ★★ risk
How do you compute a VaR-type measure for a position in a market with daily limits?
Solution
Solution of Interview question 9.5.
Daily returns are truncated at the limit, so a one-day VaR understates risk. Use multi-day scenarios with the remaining move carried forward, or measure over the horizon needed to exit; include expanded limits.
What the interviewer is looking for: the liquidity horizon, not the one-day truncated distribution.
Interview question 9.6 ★★★ developer, trader
Design the report-day playbook system: what data, what checks, what automated actions at noon?
Solution
Solution of Interview question 9.6.
Inputs: consensus and prior estimates, positions and limits, liquidity by contract. Before noon: set risk limits, cancel resting orders that should not fill on news, pre-compute scenarios. At noon: parse the release, compute surprises, route orders with price protection, switch to options or other months if a contract locks; afterwards, reconcile and report.
What the interviewer is looking for: parsing, surprise computation, protection and fallbacks.