Markets II: Rates, FX and Credit · Markets
11Inflation Markets
In the twelve months to June 2022 American consumer prices rose 9.1%, the fastest in more than forty years. It should have been the year of the inflation-protected bond, whose principal grows with the price index. An investor who bought a ten-year one on the first trading day of 2022 and marked it on the last saw its principal grow by 7.7% and its price fall by 21.3%: a loss of 15.2% on the year. Nothing was wrong with the indexation. The bond protects against inflation relative to its real yield, and that yield went from to as the Federal Reserve raised rates. This chapter explains what an inflation-linked bond pays, how its yield separates into a real rate and the market’s price of inflation, how inflation is traded in swaps, and why the calendar of price releases makes an inflation-linked position’s carry, month by month, one of the most predictable numbers in fixed income.
11.1 Index-linked bonds
Definition 11.1 (Index-linked bond, reference index, deflation floor)
An index-linked bond (a linker) is a bond whose principal, and so each coupon, is scaled by the growth of a consumer price index since the bond’s dated date. The scaling uses the reference index: the price index of a given day as the bond’s rules define it from the published monthly values. The ratio of the reference index on a day to its value on the dated date is the index ratio. A deflation floor is a promise that the principal repaid at maturity is never less than the original face value, whatever the index has done.
Treasury Inflation-Protected Securities, TIPS, were first auctioned by the United States in January 1997. They are indexed to the consumer price index for all urban consumers, not seasonally adjusted, published monthly by the Bureau of Labor Statistics; they pay a fixed coupon every six months on the adjusted principal, and at maturity the holder receives the adjusted principal or the original, whichever is larger. The fixed coupon is a real rate: a TIPS with a 0.125% coupon pays 0.0625% of its adjusted principal each half year, so its cash flows keep their purchasing power.
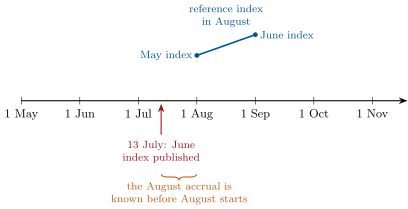
A monthly index is published about two weeks after the month it measures, so no bond can be indexed to today’s prices. The TIPS rule, in the Treasury’s regulations, sets the reference index for the first day of a month equal to the index of the third preceding month, and interpolates linearly for the other days:
where is day of month , the number of days in and the published index of month ; the reference index and the index ratio are truncated to six decimals and rounded to five. The regulation’s own example: with January 1996 at 154.40 and February at 154.90, the reference index on 15 April 1996 is .
Example 11.2 (An index ratio)
Take an illustrative ten-year TIPS dated 15 January 2022, with a 0.125% coupon. Its reference index on that day interpolates between the October 2021 index, 276.589, and November’s, 277.948: . On 15 August 2022 it interpolates between May 2022, 292.296, and June, 296.311: 294.10922. The index ratio is , so USD 100 million of face value is then USD 106.099 million of principal, and the coupon paid on 15 July, at an index ratio of 1.04814, was USD 65 509.
Remark 11.3 (When the index is not published)
A bond indexed to a statistic depends on the statistic being produced. The Treasury’s rule provides for its absence: if a month’s index is not reported by the last day of the following month, the Treasury announces a substitute, the last reported index grown for one month at its last twelve-month rate, , and keeps it even if the true figure appears later. This happened for the first time in 2025: the Bureau of Labor Statistics collected no prices from 1 October to 12 November during the lapse in federal appropriations, and no October index was published. On 26 November the Treasury announced 325.604 for October, which is from the September indices of 2025 and 2024. Every TIPS cash flow that depends on October 2025 uses that number.
The other large markets use the same design with different indices. The United Kingdom’s index-linked gilts are indexed to the Retail Prices Index; those first issued before 2005 use an eight-month lag, those issued since a three-month lag with an interpolated reference index, and a gilt repays less than its face value if the index has fallen: there is no deflation floor. France issues two families, one indexed to French consumer prices excluding tobacco and one, since 2001, to the euro-area harmonised index excluding tobacco, with the same interpolation between the indices of three and two months earlier.
As of September 2026 — Linker markets
United States: marketable TIPS outstanding USD 2 152.7 billion on 31 August 2026, 6.8% of USD 31 828.0 billion of marketable Treasury debt; terms of 5, 10 and 30 years. United Kingdom: the Retail Prices Index is to be calculated with the methods and data of the consumer price index including owner occupiers’ housing costs (CPIH) from February 2030, as the Statistics Authority and the Treasury announced on 25 November 2020, a date chosen to limit the effect on holders of index-linked gilts. Euro area: Eurostat rebased the harmonised index to 2025 from February 2026; the French Treasury states that the rebasing does not change the indexation coefficients of its bonds.
11.2 Real yields and breakevens
Definition 11.4 (Real yield, breakeven inflation rate)
The real yield of an index-linked bond is the yield to maturity of its real cash flows (the fixed coupon and the face value, in units of today’s index) at its real price, the quoted price per 100 of adjusted principal. The breakeven inflation rate at a maturity is the constant inflation rate at which a nominal bond and a linker of that maturity have the same return:
On 29 July 2022 the ten-year nominal Treasury yield was 2.67% and the ten-year real yield 0.14%: the exact breakeven is and the difference 2.53%, the figure screens show. An investor who expects inflation above the breakeven prefers the linker; one who expects less, the nominal bond.
Proposition 11.5 (What a breakeven contains)
Under the risk-neutral measure the breakeven equals expected inflation at that horizon only if investors demand no premium for bearing inflation risk and the two bonds are equally liquid. In general
with the liquidity term entering negatively because a less liquid linker must offer a higher real yield, which lowers the measured breakeven.
Proof. Admitted here. ∎
The decomposition is a statement about the pricing kernel; term-structure models that estimate each part are the subject of One Quant Book 6.
The practical consequence: a breakeven is a price, not a forecast. It falls when investors flee to the most liquid assets, as in March 2020, when the ten-year breakeven fell to 0.50% on 19 March, and it can stay below realised inflation for long stretches.
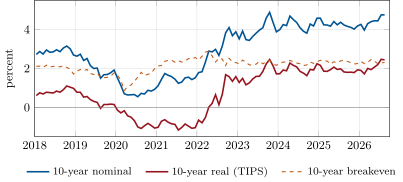
The figure also answers the hook. From the start to the end of 2022 the breakeven fell a little, from 2.60% to 2.30%, while the real yield rose by 2.55 percentage points. A linker’s price moves with its real yield exactly as a nominal bond’s moves with its nominal yield, with a real duration of the same size; the indexation is added on top. The ten-year TIPS of the hook had a real duration above nine years, so the move cost it about a fifth of its value, while a year of 9% inflation, reaching the principal with a lag, added 7.7%.
11.3 Zero-coupon inflation swaps
Definition 11.6 (Zero-coupon inflation swap)
A zero-coupon inflation swap of notional , maturity years and fixed rate exchanges a single net payment at maturity: the inflation receiver gets
where and are the reference index at the start and at maturity, with the same lag as the bonds. Nothing is exchanged at the start.
Dollar inflation swaps reference the same non-seasonally-adjusted index as TIPS, and the zero-coupon swap is the most common form: a study of dealers’ trades by the Federal Reserve Bank of New York counted 144 trades over June to August 2010, about USD 65 million a day, against about USD 5 billion a day of TIPS. Pension funds and insurers, whose liabilities grow with prices, receive inflation; issuers whose revenues are indexed, such as utilities, pay it.
Proposition 11.7 (The forward index)
Since the swap is worth zero at inception, the market’s zero-coupon rate fixes a forward value of the index: is the level at which the inflation leg and the fixed leg are equal, and any index-linked cash flow paid at is worth today, where is the nominal discount factor.
Proof. Receive the index-linked flow and pay inflation on a swap of notional : the index terms cancel and , known today, is left at . Its value is ; the swap was free. ∎
Example 11.8 (A five-year swap)
A pension fund receives inflation on USD 100 million for five years at 2.50%, with a base index of 300.00. The forward index is . If the index ends at 345.00, 15% above its base, the fund receives million; had it ended at the forward, nothing.
The proposition turns a curve of swap rates into a curve of forward index values, and so into a price for every linker: discount its indexed cash flows at the nominal curve. The gap between that price and the market price, quoted as a spread over the swap curve, moves with the balance-sheet cost of holding bonds, as the swap spread of Chapter 9 does (Chapter 21 returns to such spreads).
11.4 Indexation lag and seasonality
Definition 11.9 (Indexation lag, inflation seasonality)
The indexation lag of a linker is the delay between the month whose prices set its reference index and the month in which that reference applies: three months for TIPS and for most bonds issued since the 2000s. Inflation seasonality is the recurring pattern of a non-seasonally-adjusted price index within the calendar year, from the timing of sales, energy use and annual price resets.
Two consequences follow, and both matter to a trader. The first is in Figure 11.1: the growth of the reference index over a month is the growth of the published index two and three months earlier,
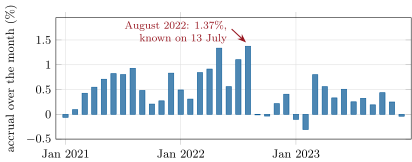
so a linker’s inflation accrual for the next month or two is known exactly. In 2022 the months of the largest prints followed each other: the reference index grew 1.37% over August alone, 17.8% at an annual rate, then fell slightly in September (Figure 11.3).
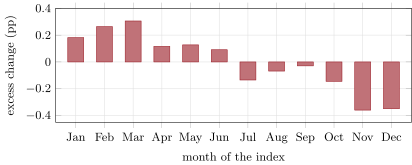
The second consequence is seasonality. Because the index is not seasonally adjusted, the monthly accrual has a calendar pattern on top of the trend: prices tend to rise faster early in the year and slower, or to fall, late in it (Figure 11.4). Over a ten-year bond the pattern averages out. Over a few months it does not, and a short-dated breakeven read without adjusting for it gives a wrong signal: a bond whose remaining accrual covers the reference months of October to December carries about 0.85 percentage points less inflation than the average quarter, 3.4 points a year annualised.
Proposition 11.10 (Carry of a financed linker)
A linker of market value held for days with an unchanged real yield , financed in repo at rate , earns
where is the growth of the reference index over the period, known in advance for up to about two months.
Proof. With the real yield unchanged the real price grows at the real yield (the pull to par plus the coupon accrual), and the invoice price is the real price times the index ratio, which grows by . Repo interest is paid on on an actual/360 basis. ∎
Because is known, it is in the price: a forward sale of the linker for the end of the month is struck at a price that includes it, and a buyer ahead of a large print pays for it. What remains uncertain, and what a trader earns or loses, is the move in the real yield and the prints not yet published.
11.5 Tutorial: breakevens, seasonality and carry
Goal. Compute reference indices and index ratios by the Treasury’s rule, estimate the seasonal pattern of the index, and price the carry of a financed TIPS. End state: Figures 11.2, 11.3 and 11.4, Example 11.2 and the numbers of the weekend problem.
The reference index, the index ratio and the month’s accrual, by Equations 11.1 and 11.3.
def ref_index(d: dt.date, index: Index, lag: int = 3) -> float:
    """Reference index for day d: index of month M-lag, interpolated towards month M-lag+1."""
    start = index[month_shift(d.year, d.month, -lag)]
    end = index[month_shift(d.year, d.month, 1 - lag)]
    days = monthrange(d.year, d.month)[1]
    return _five(start + (d.day - 1) / days * (end - start))


def index_ratio(d: dt.date, dated: dt.date, index: Index, lag: int = 3) -> float:
    return _five(ref_index(d, index, lag) / ref_index(dated, index, lag))


def monthly_accrual(year: int, month: int, index: Index, lag: int = 3) -> float:
    """Growth of the reference index over calendar month (year, month): known once month M-lag+1
    is published, which is about lag-1.5 months before the month starts."""
    return index[month_shift(year, month, 1 - lag)] / index[month_shift(year, month, -lag)] - 1.0
Listing 11.1. Reference index, index ratio and monthly accrual. code/firm/breakeven/firm_breakeven.py Seasonality and carry. Each month’s log change less its year’s mean, averaged over complete years (a year with a missing month is skipped); the carry of Proposition 11.10.
def seasonal_factors(index: Index) -> dict[int, float]:
    """Average excess log change of each calendar month over its year's mean monthly change, in
    percent; uses only complete calendar years whose twelve changes are all available."""
    excess: dict[int, list[float]] = {m: [] for m in range(1, 13)}
    for y in sorted({y for y, _ in index}):
        ch = []
        for m in range(1, 13):
            prev = month_shift(y, m, -1)
            if (y, m) not in index or prev not in index:
                break
            ch.append(math.log(index[(y, m)] / index[prev]))
        if len(ch) == 12:
            mean = sum(ch) / 12
            for m, c in enumerate(ch, start=1):
                excess[m].append(100.0 * (c - mean))
    return {m: sum(v) / len(v) for m, v in excess.items()}


def linker_carry(market_value: float, accrual: float, real_yield: float, repo: float, days: int) -> float:
    """Carry of a repo-financed linker over `days` if its real yield does not move: the index
    accrual and the real yield's pull, less the repo interest (actual/360)."""
    growth = (1.0 + accrual) * (1.0 + real_yield) ** (days / 365.0) - 1.0
    return market_value * (growth - repo * days / 360.0)
Listing 11.2. Seasonal factors and the carry of a financed linker. code/firm/breakeven/firm_breakeven.py - Run
inflation_demo.hook_2022(),inflation_demo.august_2022()andfig_inflation.py, which readdata/markets-2/cpi_us_monthly.csvandtips10_monthend.csv.
What to change next. Estimate the seasonal factors on 2010–2019 only and compare; then compute the carry of September 2022 and explain its sign.
11.6 Build: the breakeven and carry calculator
Purpose. The miniature firm quotes and finances inflation-linked bonds and swaps: it needs the reference index of any day, each bond’s index ratio, breakevens, forward index values from swap rates, and the carry it will earn over the next month.
Interface. ref_index(d, index, lag); index_ratio(d, dated, index, lag); monthly_accrual(year, month, index, lag); breakeven(nominal, real); forward_index(base, zc_rate, years); zc_swap_payment; seasonal_factors(index); linker_carry(value, accrual, real_yield, repo, days); contingency_index(last, year_before_last, missing).
Rules. Index values keyed by (year, month); reference index and index ratio truncated to six decimals and rounded to five; a lag parameter so that eight-month gilts are priced by the same code; seasonal factors only from complete calendar years.
Acceptance tests. code/firm/breakeven/tests/: the regulation’s own example (154.63333 and 1.00011); the first of a month equals the lagged index; the October 2025 substitute (325.604); a swap struck at the forward pays nothing; seasonal factors sum to zero; carry signs.
Stretch. Seasonally adjusted forward index curves from swap rates; a real-yield solver for a TIPS from its quoted real price; the UK eight-month lag gilts, whose coupons are fixed in advance.
Sources and further reading
- Code of Federal Regulations, 31 CFR Part 356, Appendix B (formulas for inflation-protected securities); TreasuryDirect, TIPS and the history of TIPS.
- UK Debt Management Office, FAQs on index-linked gilts; UK Statistics Authority, response to the joint consultation on reforming the Retail Prices Index, 25 November 2020.
- Agence France Trésor, characteristics of OATi and OAT€i.
- M. J. Fleming and J. R. Sporn, “Trading activity and price transparency in the inflation swap market”, Federal Reserve Bank of New York Economic Policy Review, May 2013.
- Bureau of Labor Statistics, Consumer Price Index news release for June 2022; FRED series CPIAUCNS, CPIAUCSL, DGS10, DFII10, T10YIE; Treasury, Monthly Statement of the Public Debt.
11.7 Exercises
Exercise 11.1 ★
With the May 2022 index at 292.296 and June at 296.311, give the TIPS reference index on 15 August 2022.
Solution
Solution of Exercise 11.1.
: August has 31 days and the 15th is day 15, so fourteen thirty-firsts of the way.
Exercise 11.2 ★
The ten-year nominal yield is 2.67% and the ten-year real yield 0.14%. Give the exact breakeven and the approximation.
Solution
Solution of Exercise 11.2.
Exactly ; the difference, 2.53%, overstates it by a fraction of a basis point at these levels.
Exercise 11.3 ★
Over the life of a bond the index falls 3%. What does a TIPS repay per 100 of face value, and what does an index-linked gilt repay?
Solution
Solution of Exercise 11.3.
The TIPS repays 100, its deflation floor; the gilt repays 97, since its principal follows the index down. Coupons paid along the way were on the adjusted principal in both cases.
Exercise 11.4 ★★
A fund receives inflation on USD 100 million for five years at 2.50%, base index 300.00. The index ends at 345.00. What is the net payment, and at what final index would there be none?
Solution
Solution of Exercise 11.4.
million to the fund. None at the forward index, .
Exercise 11.5 ★★
Give the index ratio on 15 August 2022 of the TIPS of Example 11.2, and explain why the coupon paid on 15 July used a smaller ratio.
Solution
Solution of Exercise 11.5.
. On 15 July the reference index interpolated between the April and May indices, lower than May and June while prices were rising: the ratio was 1.04814.
Exercise 11.6 ★★
With the factors of Figure 11.4, by how much does seasonality lower the inflation a TIPS accrues over the three months whose reference indices are those of October, November and December, and by how much at an annual rate?
Solution
Solution of Exercise 11.6.
percentage points over the three months, about 3.4 points a year at an annual rate. A breakeven read from such a bond without adjustment looks 3.4 points too low.
Exercise 11.7 ★★★
Coding. Estimate the seasonal factors on 2010–2019 only. Which months are the strongest and the weakest, and how far does any month move from the 2010–2024 estimate?
Solution
Solution of Exercise 11.7.
On 2010–2019 March is still the strongest month (0.355) and November the weakest (); no month moves by more than 0.11 percentage points from the 2010–2024 estimate, the largest shift being June’s. The pattern is stable; its size is estimated to about a tenth of a point.
Exercise 11.8 ★★★
Find the flaw. “Inflation is running at 9% and the ten-year breakeven is 2.5%: buy TIPS, sell nominal Treasuries, and collect the difference.” Correct it.
Solution
Solution of Exercise 11.8.
The 9% is inflation over the past year; the breakeven is the price of the next ten years’ average inflation, with risk and liquidity premia in it. The position earns realised inflation against the breakeven only over the months it is held, and in the meantime it loses or gains as the breakeven moves; the high prints already published are in the price, through the known accrual. The trade is a view that the breakeven will rise, or that realised inflation over the holding period will beat what was priced, not a collection.
11.8 Problem: The Linker’s Carry
Problem 11.1
Weekend problem — what a TIPS earns in a month of a big print
On 13 July 2022 the June index was published at 296.311, 1.37% above May’s 292.296. A trader holds USD 100 million face of the ten-year TIPS of Example 11.2 (coupon 0.125%, dated 15 January 2022) and finances it in repo at 2.30%, about the overnight rate in early August. On 29 July the ten-year real yield was 0.14% and the nominal yield 2.67%; assume they do not move during August.
Part I — The index.
- Give the reference index on 1 August and on 1 September 2022.
- Give the index ratio on 1 August.
- Give the growth of the reference index over August.
- When did the trader know it, and why?
- Give the reference index on 15 August.
Part II — The carry.
- Give the real price at 0.14% and the position’s market value on 1 August.
- Give the income from the index accrual over August’s 31 days.
- Give the income from the real yield.
- Give the repo cost.
- Give the carry.
Part III — Comparisons.
- Give the carry of the same market value of a nominal bond yielding 2.67%.
- Give August’s accrual at an annual rate, and compare it with the breakeven.
- The July index was 296.276. Give September’s accrual and carry (30 days).
- Give the position’s DV01 in real yield, and the real-yield move that would cancel August’s carry.
- Why is the carry larger for a short-dated TIPS, relative to its risk?
Part IV — Judgement.
- Is the carry a profit for a trader who buys on 29 July?
- Why did TIPS lose money in 2022 despite such months?
- What is the deflation floor of this bond worth in August 2022?
- State the named result: the carry of USD 100 million face of the ten-year TIPS over August 2022.
- In one sentence: what does a linker protect against, and what not?
Solution
Solution of Problem 11.1.
1. 292.296 (the May index) and 296.311 (June). 2. 1.05445, the ratio of 292.296 to 277.20274. 3. 1.374%, the growth from 292.296 to 296.311. 4. On 13 July, when the June index was published: over August the reference index moves from the May to the June index, both then known. 5. 294.10922. 6. A real price of 99.865 (dirty) per 100 of adjusted principal; market value , USD 105.30 million. 7. , USD 1 446 444. 8. USD 12 513 (0.14% a year for 31 days), plus a cross term of USD 172. 9. , USD 208 558. 10. USD 1 250 572. 11. USD 27 366: the nominal bond’s yield barely covers repo. 12. 17.8% a year, against a breakeven of 2.53%: the carry reflects a single month’s print, not the market’s expectation for ten years. 13. ; carry dollars, the repo cost with nothing to offset it. 14. USD 98 921 per basis point; 12.6 basis points of real yield would wipe out the month’s carry. 15. The accrual is the same per dollar of value at any maturity, while the real-yield risk grows with duration: a two-year TIPS earns the same August accrual with a fifth of the price risk. 16. Not by itself: the forward price for the end of August includes the known accrual, so a buyer on 29 July pays for it. It is profit only against a position that did not own it, or if the real yield falls. 17. Real yields rose by two and a half points, and a real duration above nine years turned that into a price loss larger than the year’s indexation. 18. Very little: the index ratio was 1.054, so the index would have to fall about 5% by 2032 before the floor paid anything. 19. Named result: the linker’s carry of USD 100 million face of the ten-year TIPS over August 2022 was about USD 1.25 million, known on 13 July. 20. A linker protects its holder against the price level, not against the real interest rate.
11.9 Interview questions
Interview question 11.1 ★ trader, researcher
What is a breakeven inflation rate, and why is it not the market’s inflation forecast?
Solution
Solution of Interview question 11.1.
The constant inflation rate at which a nominal bond and an inflation-linked bond of the same maturity return the same, roughly the nominal yield minus the real yield. It is a price: it includes a premium for bearing inflation risk, minus the premium the less liquid linker must pay, plus convexity effects, and it moves with flights to liquidity, as in March 2020.
What the interviewer is looking for: the Fisher relation, and the premia that separate it from a forecast.
Interview question 11.2 ★ bank, developer
How does the principal of a TIPS change, and what happens at maturity after deflation?
Solution
Solution of Interview question 11.2.
The principal is multiplied by the index ratio, the reference index (the non-seasonally-adjusted CPI-U with a three-month lag, interpolated daily) over its value on the dated date; coupons are the fixed real rate on that principal. At maturity the holder receives the larger of the adjusted and the original principal: deflation over the whole life is floored, though coupons paid along the way on a lower principal are not.
What the interviewer is looking for: the lagged, interpolated index, and the floor on principal only.
Interview question 11.3 ★★ trader
Why does a TIPS carry so much in a month after a large inflation print, and who gets that carry?
Solution
Solution of Interview question 11.3.
Because the principal grows over a month by the index change of two and three months earlier, so a large print becomes a large, known accrual a few weeks later; financed at the repo rate, the position carries the accrual minus repo. The carry goes to whoever held the bond before it was priced in; a buyer after the print pays for it in the forward price.
What the interviewer is looking for: the lag mechanics and the fact that known carry is priced.
Interview question 11.4 ★★ researcher, trader
The five-year zero-coupon inflation swap rate and the five-year TIPS breakeven differ. What could make them differ?
Solution
Solution of Interview question 11.4.
Different instruments and costs: the swap has no funding and little balance sheet, the bond must be financed and uses balance sheet; their liquidity differs; the bond’s deflation floor has value the swap lacks; supply and demand differ (pension-fund receiving in swaps, Treasury issuance in bonds); the lag conventions and the exact dates of the indices may not match; and the bond’s breakeven is quoted on a yield, the swap on a zero-coupon rate.
What the interviewer is looking for: funding and balance sheet, the floor, flows, and conventions.
Interview question 11.5 ★★ researcher
How would you remove seasonality from a price index to price short-dated linkers?
Solution
Solution of Interview question 11.5.
Estimate monthly factors from the history of the unadjusted index (for example, each month’s change less its year’s mean, averaged over complete years, or the official seasonal factors), check their stability over sub-periods, normalise them to sum to zero over the year, and apply them to the forward index curve built from swaps, so that forward monthly changes carry the calendar pattern; then price the short linkers on that curve.
What the interviewer is looking for: estimation, stability, normalisation, and applying it to forwards.
Interview question 11.6 ★★★ developer, bank
Design the service that publishes the index ratio of every linker a firm holds, in the United States, the United Kingdom and the euro area, every morning.
Solution
Solution of Interview question 11.6.
A conventions table per bond (index, lag, interpolation, rounding, dated date, floor, coupon dates), with eight-month-lag gilts as a separate rule; an index store keyed by month, loaded from each statistics office on its release day, with checks against the previous value, its release calendar, and versioning for rebasings; a pure function from (bond, date, index store) to the ratio, tested on the issuers’ published examples and ratio tables; an output that is reconciled each morning against the issuers’ own published ratios, and alerts when an index is late or a bond’s rule is missing.
What the interviewer is looking for: conventions as data, a versioned index store, and reconciliation with the issuers’ tables.