সব বই

পেশাদার

1 Markets I: The Ecosystem and Exchange-Traded Marketsবাজার অনলাইন 2 Markets II: Rates, FX and Creditবাজার অনলাইন 3 Markets III: Commodities, Energy and Cryptoবাজার অনলাইন 4 Quantitative Methodsপদ্ধতি অনলাইন 5 Derivatives and Volatilityডেরিভেটিভস অনলাইন 6 Rates, Credit, XVA and Riskসুদহার, ঋণ ও ঝুঁকি অনলাইন 7 Research Craft: Predictors, Backtests, Measurement, Portfoliosগবেষণা অনলাইন 8 Strategies I: Equities and Futuresকৌশল অনলাইন 9 Strategies II: Volatility, Relative Value, Macro and the Bank Desksকৌশল অনলাইন 10 Microstructure and Executionএক্সিকিউশন অনলাইন 11 Market Making and High-Frequency Tradingমার্কেট মেকিং অনলাইন 12 Machine Learning for Marketsমেশিন লার্নিং অনলাইন 13 Low-Latency Softwareপ্রযুক্তি অনলাইন 14 Networks, Hardware and Trading Infrastructureপ্রযুক্তি অনলাইন 15 Research, Data and Risk Platformsপ্রযুক্তি অনলাইন 16 The Desk and the Firmপ্রতিষ্ঠান অনলাইন 17 The Industry: Firms, Roles and Careersক্যারিয়ার অনলাইন 18 Interviews I: Maths, Probability and Speedক্যারিয়ার অনলাইন 19 Interviews II: Markets, Trading Games and the Final Roundক্যারিয়ার অনলাইন 20 Interviews III: Codeক্যারিয়ার অনলাইন
অ্যাপ পরিচিতি Coach সাইন ইন পড়া শুরু করো

বইগুলো এখনো বাংলা ভাষায় পাওয়া যায় না — ইংরেজি সংস্করণ দেখানো হচ্ছে।

Physics · পরিভাষা

Phase portrait কী?

Definition 13.14 University Physics — Year 1 · অধ্যায় 13 — Work, Energy, and Potential Energy

The phase portrait of a one-dimensional motion is the family of curves traced by the point (x,x˙)(x, \dot x) in the phase plane. For a conservative system each curve is a level line 12mx˙2+Ep(x)=Em\tfrac12 m\dot x^2 + E_p(x) = E_m: closed curves around stable equilibria (oscillations), open curves for free motion, and, through unstable equilibria, the separatrices that divide the two. Curves are traversed clockwise (x˙>0\dot x > 0 means xx increasing) and never cross.

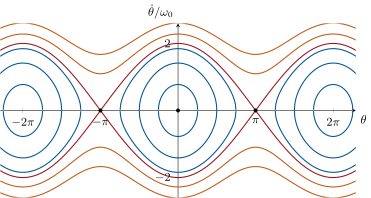
Phase portrait of the simple pendulum, 1/2 2 + _02(1 - ) = const. Closed curves (blue): swings about the stable equilibrium = 0; open curves (orange): full rotations; between them the separatrix (red) through the unstable equilibria = ±π, the motion that just reaches the top.
Phase portrait of the simple pendulum, 12θ˙2+ω02(1−cos⁡θ)=const\tfrac12\dot\theta^2 + \omega_0^2(1 - \cos\theta) = \text{const}. Closed curves (blue): swings about the stable equilibrium θ=0\theta = 0; open curves (orange): full rotations; between them the separatrix (red) through the unstable equilibria θ=±π\theta = \pm\pi, the motion that just reaches the top.

উদাহরণ

Example 13.15 (The pendulum’s landscape)

Ep=−mgℓcos⁡θE_p = -mg\ell\cos\theta: minimum at θ=0\theta = 0, Ep′′=mgℓE_p'' = mg\ell, so ω02=gℓ/(mℓ2)=g/ℓ\omega_0^2 = g\ell/(m\ell^2) = g/\ell — the small-oscillation result of Example 12.12 read off the well’s curvature; maximum at θ=π\theta = \pi, the inverted pendulum, unstable. Energy Em<mgℓE_m < mg\ell: oscillation between ±θmax⁡\pm\theta_{\max}; Em>mgℓE_m > mg\ell: it goes over the top and rotates; Em=mgℓE_m = mg\ell: the separatrix, an infinitely slow approach to the top.

প্রসঙ্গসহ পড়ো →