The Desk and the Firm · The firm
19Technology Strategy
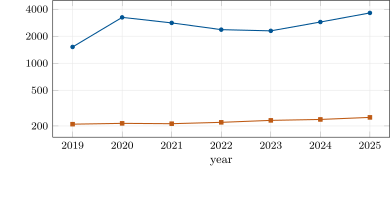
Virtu Financial’s communication and data processing expense was $209 million in 2019 and $249 million in 2025. In between, its revenue went from $1.5 billion to $3.2 billion, back down to $2.3 billion and up to $3.6 billion; the expense rose by a fifth and fell only once, by less than 1%. A trading firm does not choose each year whether to be fast. The latency tier it pays for is a decision about which businesses it will be in, taken once and paid every year, whatever the year brings.
19.1 Architecture as strategy
Book 13 built the low-latency stack and Book 14 the networks under it. This chapter is about the decision above both: how much speed to buy, for which strategies, and what else the same money could do. The decision is strategic because the costs are fixed (chapter 1’s fixed cost base; Figure 19.1) and the benefits depend on what competitors buy.
data/desk/filings_virtu.csv.Definition 19.1 (Latency tier)
A latency tier is a level of trading infrastructure defined by the latency it achieves and the fixed cost it carries: for example, shared connections and software trading; colocated servers with direct low-latency connections; or colocated hardware trading with dedicated wireless routes between venues.
The chapter’s three tiers are priced from venue fees Book 14 read from published fee schedules, plus the firm’s own hardware, routes and people, which are inputs (Box 19.1): $0.29 million a year for tier 1, $1.35 million for tier 2 and $4.45 million for tier 3, per strategy. The venue fees are the small part: $36 000, $450 000 and $946 000 a year.
As of September 2026 — Venue fees behind the tiers
From the fee schedules recorded in One Quant Book 14 (chapter 9): at Nasdaq’s NY11-4 data centre, an ultra-high-density cabinet at $7 230 a month, with installation fees of $5 940 for the cabinet, $4 560 for Phase 3 power and $5 260 for a Phase 3 PDU (SEC Release 34-101267, October 2024); at MIAX Pearl Options, a 10Gb ultra-low-latency connection at $15 000 a month, a 10Gb disaster-recovery connection at $3 500 and a 1Gb connection at $1 500 (Federal Register 2026-10452, May 2026). Tier 1 is two 1Gb connections; tier 2 a cabinet and two 10Gb connections; tier 3 two cabinets, four 10Gb connections and a disaster-recovery link, one-time fees spread over 36 months. Fee schedules change by filing.
19.2 What speed is worth, strategy by strategy
Speed earns money in races: two or more firms react to the same public event, and only the first gets the trade. Aquilina, Budish and O’Neill (2022) measured races directly in stock exchange message data for FTSE 100 stocks: about one race a minute per symbol, lasting 5 to 10 millionths of a second in the modal case, about a fifth of trading volume, with six firms accounting for over 80% of race wins and losses. Races were roughly a third of the cost of liquidity. For a strategy, the question is what share of its revenue is decided by races.
Definition 19.2 (Latency arms race)
A latency arms race is competition in which firms buy speed to win races against each other, so that each firm’s investment lowers the others’ returns on theirs, and the equilibrium spending on speed exceeds what the firms together gain from it.
The chapter’s race model splits a strategy’s revenue pool , shared by competitors, into a race share and the rest. Races go to the firms in the fastest tier present, shared equally; the rest is shared equally among all . A firm earns
where is the number of firms in the top tier (Listing 19.1). Five strategies differ in and in : futures market making ($60 million, 0.8), ETF arbitrage ($30 million, 0.9), equity statistical arbitrage over minutes ($20 million, 0.1), options market making ($40 million, 0.5) and crypto basis trading ($10 million, 0.3). The values are illustrative; the race shares are set against the finding that races are a fifth of volume and a third of the cost of liquidity in a market where market makers dominate both.
def revenue(s, mine, others):
    """mine, others: tier indices (higher is faster)."""
    n = 1 + len(others)
    top = max([mine, *others])
    p_win = 1 / (1 + sum(o == top for o in others)) if mine == top else 0.0
    return s.pool * (s.alpha * p_win + (1 - s.alpha) / n)


def best_tier(s, tiers, others):
    profits = [revenue(s, i, others) - t.annual for i, t in enumerate(tiers)]
    return max(range(len(tiers)), key=lambda i: (profits[i], -i)), profits


def arms_race(s, tiers, n, start=0, max_rounds=100):
    """Best-response dynamics from everyone at tier `start`; raises if they cycle (no pure equilibrium found)."""
    prof = [start] * n
    for rounds in range(1, max_rounds + 1):
        changed = False
        for i in range(n):
            b, _ = best_tier(s, tiers, prof[:i] + prof[i + 1:])
            if b != prof[i]:
                prof[i], changed = b, True
        if not changed:
            return prof, rounds
raise RuntimeError("best responses cycle: no pure equilibrium reached")19.3 Tutorial: the fastest tier
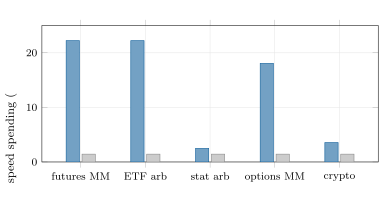
Goal. Choose a latency tier for each of five strategies against given rivals, then let every firm choose and find the arms-race equilibrium. End state: the profit chart by tier (Figure 19.2) and equilibrium spending against no upgrades (Figure 19.3).
- The tiers.
fm_tech.tiers()builds the three tiers from Book 14’sfirm.colobillschedules and the stated inputs. - The rivals. Each strategy has four rivals at given tiers: for futures market making two at tier 3, one at tier 2 and one at tier 1.
- The choice.
firm.techtier.best_tiercompares the three tiers’ profits for each strategy. - The race.
firm.techtier.arms_racestarts five identical firms at tier 1 and lets each in turn choose its best tier until no one changes;wastecompares the equilibrium’s spending with everyone at tier 1.
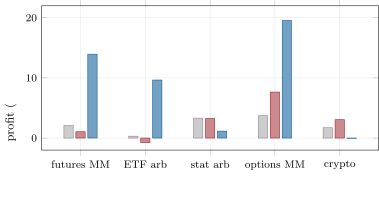
fm_tech.choices.Against its rivals, the firm should buy tier 3 for futures market making (profit $13.95 million a year, against $2.11 million at tier 1), ETF arbitrage ($9.65 million against $0.31 million) and options market making ($19.55 million against $3.71 million); tier 2 for the crypto basis trade ($3.05 million), where no rival has more; and tier 1 for statistical arbitrage over minutes ($3.31 million), which loses $2.16 million a year by buying tier 3. The same firm is a speed business in three strategies and not in two, and its architecture should say so.
Proposition 19.3 (How many firms race)
With two tiers whose costs differ by , identical firms and the race model, a firm gains from joining others in the fast tier if and only if . In equilibrium the number of firms in the fast tier is , their total speed spending is above the all-slow level, and the pool shared by the industry is unchanged.
Proof. Moving from the slow to the fast tier changes a firm’s race revenue from 0 to and leaves its share of the rest at ; the cost rises by . Firms join while , so the last to join is the -th, and a firm in the fast tier does not leave, since leaving loses . Revenues sum to whatever the tiers. ∎
With three tiers the argument applies step by step: for futures market making and the step from tier 1 to tier 3 is $4.16 million, so up to eleven firms would race; with five, all five do. Options market making gives , four firms; the crypto trade, for the step to tier 2, two firms; statistical arbitrage, , one.
fm_tech.races.19.4 Latency tiers and the arms race
The equilibrium spends $22.2 million a year on speed in futures market making and in ETF arbitrage, against $1.4 million if no one upgraded: 93.6% of the spending buys nothing for the industry, since the pool is the same. The industry’s profit in futures market making falls from $58.6 million to $37.8 million; in ETF arbitrage, from $28.6 million to $7.8 million, about a quarter of what it would be. Options market making wastes 92.1%, the crypto trade 59.8% and statistical arbitrage 42.7%. Across the five, the industry spends $68.6 million where $7.2 million would do: 89.6% of its speed spending is waste in the model’s sense. This is the argument Budish, Cramton and Shim (2015) make for markets in general: competition does not shrink the arbitrage opportunities, it raises the speed needed to capture them.
For a single firm the conclusion is the opposite of the industry’s: in a race that others are running, not buying speed means losing the race’s revenue. The firm’s decision is where to race and where not to, and where the pool is small or the races few, to leave.
19.5 Platform teams and product teams
Definition 19.4 (Platform team, product team)
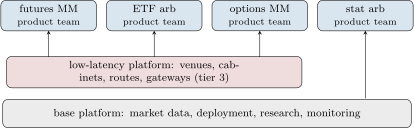
A product team builds and runs what one business uses to make money, such as a strategy’s trading system, and is measured on that business’s results. A platform team builds and runs shared capabilities that product teams use as a service, such as market data, order gateways, the research platform or deployment, and is measured on their reliability and on the product teams’ speed of delivery.
The latency tier cuts across the two. Tier 3 infrastructure is usually a platform, since venues, cabinets and routes are shared by every strategy that races; the tutorial charges each strategy its own tier only for clarity. What belongs in a platform is what several product teams need in the same form; what belongs in a product team is what makes a strategy different. Skelton and Pais’s Team Topologies (2019) gives the vocabulary; chapter 21 applies it to a trading firm’s engineers (Figure 19.4).
19.6 The technology budget
Definition 19.5 (Run-the-bank and change-the-bank spending)
Run-the-bank spending is the technology spending needed to keep existing businesses operating: infrastructure, licences, venue and data fees, production support and maintenance. Change-the-bank spending is spending on new capabilities: new strategies, venues, platforms and replacements that change what the firm can do.
The chosen tiers cost $14.97 million a year and production support $1.2 million: $16.2 million of run. The year’s projects, new venue connections, an FPGA feed-handler upgrade and a research platform, cost $4.0 million of change: run is 80.2% of the budget. The hook’s filings show why the split matters: a cost that did not fall when revenue fell by 29% from 2020 to 2023 is a run cost, and every tier decision adds to it. Flow Traders’ annual report puts its technology expenses at € 70.6 million in 2025, against € 66.6 million in 2024, beside a net trading income of € 485.8 million: another fixed line in a variable business.
Method 19.6 (Setting the technology strategy)
- For each strategy, estimate the share of revenue decided by races and the competitors’ tiers.
- Price each tier from published fees and the firm’s own costs; choose the tier that maximises the strategy’s profit, and record the choice as a strategic commitment with a review date.
- Share racing infrastructure as a platform; keep strategy-specific code in product teams.
- Report the budget as run and change, and require every change project to state the run cost it will add.
- Revisit the choice when competitors move: the arms race changes the answer every year.
19.7 Build: latency tiers
Purpose. The strategic side of speed: tier costs, what each tier earns strategy by strategy, the arms-race equilibrium, and the run/change budget.
Interface. firm.techtier: Tier, colobill_venue_fees (on Book 14’s firm.colobill), Strategy, revenue, best_tier, arms_race, waste, run_change.
Rules. Revenues sum to the pool; the fastest tier present takes all races, shared equally; an equilibrium is a profile no firm changes; cycling best responses raise an error rather than return a profile.
Acceptance tests. code/firm/techtier/tests/: the pool identity; no profitable deviation at the equilibrium; venue fees from a published schedule; the budget split.
Stretch. Book 14’s connectivity plan as the source of tier costs; shared platform costs across strategies; mixed equilibria when best responses cycle.
Sources and further reading
- E. Budish, P. Cramton and J. Shim, “The high-frequency trading arms race”, Quarterly Journal of Economics 130(4), 2015; M. Aquilina, E. Budish and P. O’Neill, “Quantifying the high-frequency trading ‘arms race”’, Quarterly Journal of Economics 137(1), 2022.
- Virtu Financial, Forms 10-K 2020–2025; Flow Traders, Annual Report 2025.
- M. Skelton and M. Pais, Team Topologies, IT Revolution, 2019.
- Fee schedules as recorded in One Quant Book 14, chapter 9.
19.8 Exercises
Exercise 19.1 ★
By what percentage did Virtu’s communication and data expense rise from 2019 to 2025, and what share of revenue was it in each year?
Solution
Solution of Exercise 19.1.
19%, from $209.4 million to $249.2 million. As a share of revenue: 13.8%, 6.6%, 7.5%, 9.3%, 10.1%, 8.2% and 6.9% from 2019 to 2025: the share moves with revenue because the cost does not.
Exercise 19.2 ★
A strategy has , and five firms. What does a firm earn in the fast tier alone, and with two others there?
Solution
Solution of Exercise 19.2.
Alone: million a year. With two others: million.
Exercise 19.3 ★
What are the venue fees of the three tiers, and what share of each tier’s cost are they?
Solution
Solution of Exercise 19.3.
$36 000, $450 000 and $946 000 a year: 12.6%, 33.3% and 21.3% of the tiers’ total costs.
Exercise 19.4 ★★
Use Proposition 19.3 to predict how many firms race in each strategy.
Solution
Solution of Exercise 19.4.
Futures market making , capped at 5; ETF arbitrage , capped at 5; options market making 4; the crypto trade 2 at tier 2 (); statistical arbitrage 1 at tier 2 (). The simulation agrees.
Exercise 19.5 ★★
Why should the firm not buy tier 3 for statistical arbitrage although it buys it for three other strategies?
Solution
Solution of Exercise 19.5.
Only 10% of its revenue is decided by races: winning them all adds at most $2 million a year, less than the $4.16 million the step to tier 3 costs. It earns $3.31 million at tier 1 and $1.15 million at tier 3.
Exercise 19.6 ★★
Classify as run or change: renewing a cabinet contract, building a new venue gateway, replacing an end-of-life switch, the market data bill.
Solution
Solution of Exercise 19.6.
Renewing the cabinet contract, replacing the end-of-life switch and the market data bill are run; the new venue gateway is change.
Exercise 19.7 ★★★
Coding. Double tier 3’s other costs to $7 million and rerun fm_tech.races(). What happens to the equilibria and the waste?
Solution
Solution of Exercise 19.7.
All five firms still race in futures market making; ETF arbitrage falls to three racers and options market making to two. Total speed spending rises from $68.6 million to $86.9 million and the wasted share from 89.6% to 91.8%: dearer speed does not end the race where the pool is large.
Exercise 19.8 ★★★
Find the flaw. “Speed spending is wasted, as the models show; we will stop upgrading and save the money.”
Solution
Solution of Exercise 19.8.
The waste is the industry’s, not the firm’s: a firm that stops upgrading in a strategy where others race loses the race revenue () and keeps only its share of the rest. The right decision is strategy by strategy: race where exceeds the cost step, leave where it does not.
19.9 Problem: The Fastest Tier
Problem 19.1
Weekend problem — the fastest tier
A chief technology officer must propose which strategies the firm will race in, and at what speed, for the next three years.
Part I — Speed as strategy.
- Define a latency tier and a latency arms race.
- What does Virtu’s communication and data expense show?
- What did Aquilina, Budish and O’Neill find about races?
- Price the three tiers and state where the prices come from.
Part II — The choice.
- Write the race model.
- Give the profit by tier for each strategy and the best tier.
- Why is the answer different for the crypto basis trade?
- What would change the answer for statistical arbitrage?
Part III — The race.
- State and prove Proposition 19.3.
- Give each strategy’s equilibrium profile and spending.
- Give the wasted share per strategy and in total.
- Why is the industry’s waste not the firm’s?
- What do Budish, Cramton and Shim conclude?
Part IV — The organisation and the budget.
- Define platform and product teams and draw them for the firm.
- Define run-the-bank and change-the-bank spending.
- Give the firm’s run/change split.
- What does Flow Traders’ report show?
- How often should the tier choice be revisited, and on what evidence?
- State the named result: the profit-maximising tier for each of the five strategies, and the share of the industry’s speed spending that the arms-race equilibrium wastes against no one upgrading.
- In two sentences, write the technology strategy.
Solution
Solution of Problem 19.1.
- See Definitions 19.1 and 19.2.
- A cost that rose 19% over seven years while revenue more than doubled and halved: a fixed commitment.
- About a race a minute per symbol, 5–10 millionths of a second, a fifth of volume, six firms with over 80% of wins and losses, a third of the cost of liquidity.
- $0.29, $1.35 and $4.45 million a year per strategy; venue fees from Book 14’s published schedules, the rest inputs.
- .
- See Figure 19.2: tier 3 for futures market making, ETF arbitrage and options market making; tier 2 for the crypto trade; tier 1 for statistical arbitrage.
- No rival is faster than tier 1, so tier 2 wins all races for $1.06 million more; tier 3 adds nothing.
- A larger race share or pool, or cheaper speed.
- See Proposition 19.3.
- Five at tier 3 in futures market making and ETF arbitrage ($22.2 million each); one at tier 2 in statistical arbitrage ($2.5 million); four at tier 3 in options market making ($18.1 million); two at tier 2 in the crypto trade ($3.6 million).
- 93.6%, 93.6%, 42.7%, 92.1% and 59.8%; 89.6% in total.
- A firm that stops loses its race revenue to those who continue.
- That continuous markets create arbitrage rents that competition does not remove, only raises the speed needed to capture, in a socially wasteful race; they propose frequent batch auctions.
- See Definition 19.4 and Figure 19.4.
- See Definition 19.5.
- $16.2 million run, $4.0 million change: 80.2% run.
- Technology expenses of € 70.6 million in 2025 against € 66.6 million in 2024, beside net trading income of € 485.8 million.
- Every year, on the competitors’ tiers, the race share measured from the firm’s own fills and the tier prices.
- Tier 3 for futures market making, ETF arbitrage and options market making, tier 2 for the crypto basis trade, tier 1 for statistical arbitrage; 89.6% of the industry’s speed spending is waste against no one upgrading.
- Race only where races decide most of a large pool, on a shared low-latency platform; review each strategy’s tier yearly and account for every tier as a run cost it commits the firm to.
19.10 Interview questions
Interview question 19.1 ★ developer
What is the difference between a platform team and a product team in a trading firm?
Solution
Solution of Interview question 19.1.
A product team builds and runs one business’s trading system and is measured on its results; a platform team provides shared services such as market data and gateways and is measured on their reliability and on the product teams’ delivery.
What the interviewer is looking for: ownership and measures.
Interview question 19.2 ★ trader
Why can a firm lose money by being faster?
Solution
Solution of Interview question 19.2.
When the races it wins are worth less than the extra cost of speed, or when rivals are faster anyway and it wins no races.
What the interviewer is looking for: race share times pool against cost.
Interview question 19.3 ★★ researcher
Five firms compete for a $30 million pool, 90% decided by races; being fast costs $4 million more a year. How many will be fast?
Solution
Solution of Interview question 19.3.
; each fast firm gets ; for , so all five.
What the interviewer is looking for: the counting argument.
Interview question 19.4 ★★ developer, trader
How would you decide whether a strategy needs an FPGA?
Solution
Solution of Interview question 19.4.
Measure the share of the strategy’s revenue lost to faster competitors in races, estimate what hardware would recover, and compare with its full cost including the engineers; decide on that, not on the latency alone.
What the interviewer is looking for: revenue at stake against full cost.
Interview question 19.5 ★★ risk
Why does most of a trading firm’s technology budget become run-the-bank spending?
Solution
Solution of Interview question 19.5.
Each change project creates infrastructure, licences and support that must be run for as long as the business exists, so change becomes run.
What the interviewer is looking for: commitments accumulate.
Interview question 19.6 ★★★ researcher
Market designers propose frequent batch auctions. What would they do to the arms race in the chapter’s model?
Solution
Solution of Interview question 19.6.
They would batch orders in short intervals so that tiny speed differences no longer decide who trades: falls towards zero, fewer firms race, and speed spending falls.
What the interviewer is looking for: the race share as the lever.