The Desk and the Firm · The firm
28Case Studies I
On 23 September 1998 fourteen banks and securities firms agreed to recapitalise a hedge fund, Long-Term Capital Management, and five days later they put in about $3.6 billion, 90% of what the fund was then worth. The fund had begun the year with $4.67 billion of capital and a balance sheet 28 times as large; by the end of August it had lost almost half, and by the recapitalisation almost all. Every number in that paragraph was the result of decisions the firm took long before: how much leverage to run, on what funding terms, in which trades, and alongside whom. This chapter and the next read three such failures from the public record, and rerun each with one decision changed.
28.1 How to read a failure
A failure seen from outside is a story, and stories favour villains and bad luck. Seen from inside a firm, it is a sequence of decisions, each of which looked reasonable with the information of its time: a limit set, a funding term accepted, a position allowed to grow, a choice to sell or hold. The useful reading keeps to what the public record establishes, reconstructs the numbers from it, and asks which decision, changed, would have changed the outcome by how much. It does not re-litigate what regulators and courts found, and it does not attribute motives the record does not state.
Two kinds of liquidity run through all three cases, and Book 1’s liquidity spiral is the mechanism that joins them.
Definition 28.1 (Funding liquidity risk, market liquidity risk)
Funding liquidity risk is the risk that a firm cannot meet its payments and margin calls when they fall due, because its lenders raise haircuts, shorten terms or withdraw, or because its own losses consume its cash. Market liquidity risk is the risk that a firm cannot sell or hedge a position quickly without moving its price against itself, because the position is large against the market’s volume or because other holders are selling at the same time.
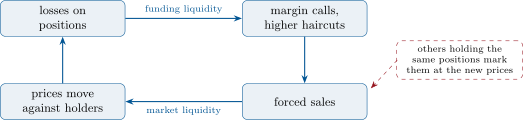
A firm with ample funding can wait for a market to recover; a firm whose positions can be sold at once needs little funding patience. The failures that end firms combine the two: losses trigger margin calls, the calls force sales, the sales move prices, and the new prices trigger more calls (Figure 28.1).
Definition 28.2 (Days to liquidate)
The days to liquidate a position is its size divided by the volume the firm can trade each day without an unacceptable market impact, usually a stated share of the average daily volume:
for a position of units, an average daily volume of units and a participation rate (Book 10’s participation).
Days to liquidate is the bridge between a position’s size and a risk model’s horizon. A one-day value at risk (Book 6) assumes the position can be exited within the day at prices near the model’s; a position of twenty days to liquidate carries twenty days of price risk, and its own sales move the price on each of them.
28.2 1998: leverage and the terms of funding
The public record here is the report of the General Accounting Office (now the Government Accountability Office) of October 1999. At the end of 1997 the fund returned about $2.7 billion of capital to its investors, leaving net assets of $4.67 billion; its balance-sheet leverage, 17 to 1 at the end of 1994, stood at 28 to 1. On 31 August 1998 it also held derivatives of about $1.4 trillion notional off its balance sheet. From January to September 1998 it lost almost 90% of its capital: 44% in August alone, after the Russian debt moratorium of mid-August sent investors towards quality and liquidity, and most of what remained in September.
As of September 2026 — The public record of the chapter’s cases
Long-Term Capital Management (GAO/GGD-00-3, October 1999): net assets $4.67 billion at the end of 1997, after about $2.7 billion returned to investors; balance-sheet leverage 28 to 1 at the end of 1997; $2.3 billion of net assets on 31 August 1998, after a 44% loss in August; on 23 September 1998, 14 banks and securities firms agreed to recapitalise it, and on 28 September contributed about $3.6 billion, 90% of its net asset value. Amaranth Advisors (US Senate Permanent Subcommittee on Investigations, hearing record S. Hrg. 110-235, 2007): at times in the summer of 2006 it held about 40% of all outstanding NYMEX natural gas contracts for the winter of 2006–2007, 75% of November 2006 and 60% of January and March 2007, and at times 100 000 contracts in a month; from the end of August to mid-September 2006 its natural gas positions lost more than $2 billion, and it liquidated its natural gas portfolio. Global Equity Opportunities (Goldman Sachs, Form 8-K, 13 August 2007): a quantitative long/short equity fund with a net asset value of about $3.6 billion received a $3 billion equity investment from Goldman Sachs and other investors.
A balance sheet 28 times capital means that a fall of in the value of the assets, net of hedges, wipes out the capital. The fund’s positions were mostly spread trades, long one bond or swap and short a close relative, whose net value moves far less than either leg; the leverage was sized to that small net risk. What the ratio measures is how little room the funding leaves when the spreads move together and far.
The GAO report states why the Federal Reserve facilitated a private recapitalisation: it judged that a rapid liquidation of the fund’s positions, and of related positions held by other market participants, might pose a significant threat to markets that were already unsettled. The creditors held the same trades, or were the counterparties to them; a forced sale by the fund would have marked their books too.
28.3 Tutorial: three reconstructions
Goal. Reconstruct from the public figures the 1998 fund’s capital through the year and rerun it at half the leverage; reconstruct the natural-gas fund’s share of open interest and its days to liquidate; rerun Book 7’s crowded unwind for a fund that sells and one that holds. End state: the three charts Figures 28.2, 28.3 and 28.4.
- Capital by period. From $2.3 billion at the end of August after a 44% loss, capital at the end of July was billion. The $3.6 billion was 90% of the net asset value on 28 September, so the existing investors’ share was billion.
- Returns on capital. January to July ; August ; September to the 28th .
- Half the leverage. If the assets’ returns are unchanged, halving the leverage halves each period’s return on capital: billion on 28 September (
firm.casebook.capital_path). - Concentration. The subcommittee’s shares of open interest, and days to liquidate for 100 000 contracts at 20% of an illustrative average daily volume of 25 000 contracts in the month’s contract.
- The crowded exit. Three funds with long-short books of $30 billion gross at six times leverage and an overlap of 0.94; one sells half its book over five days, the others hold (
firm.casebook.quant_unwind, onfirm.capacity.unwind).
def ltcm_returns():
    """Returns on capital by period, derived from the GAO figures: January to July (from the year-end NAV to the
    end-July NAV implied by August's 44% loss), August, and September to the recapitalisation (the fund's own equity
    implied by the $3.6 billion being 90% of NAV on 28 September)."""
    nav_jul = LTCM["nav_aug_1998"] / (1 - LTCM["august_loss_share"])
    nav_before = LTCM["recap"] / LTCM["recap_share_of_nav"] - LTCM["recap"]
    return {"jan_jul": nav_jul / LTCM["nav_1997"] - 1, "aug": -LTCM["august_loss_share"],
            "sep": nav_before / LTCM["nav_aug_1998"] - 1}


def capital_path(returns, start, scale=1.0):
    """Capital after each period when every period's return on capital is multiplied by `scale`."""
    out, c = [start], start
    for r in returns:
        c *= 1 + scale * r
        out.append(c)
    return out


def days_to_liquidate(position, adv, share=0.2):
    """Days to sell a position trading `share` of the average daily volume."""
    return position / (share * adv)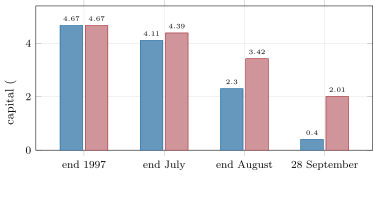
fm_cases1.ltcm.The reconstruction leaves the investors with $0.40 billion of their $4.67 billion, a loss of 91.4%, before the recapitalisation; the net asset value of $3.81 billion reported for 30 September includes the new money. At half the leverage the same asset returns would have left $2.01 billion, 43% of the capital, and no need for rescue. That counterfactual is generous in one way and harsh in another. It assumes the assets would have fallen as far, when part of September’s fall was the market trading against a fund known to be in distress, which a smaller fund would not have been; and it gives the smaller fund no credit for fewer counterparties calling margin at once. It also takes nothing from the returns of the years before, which half the leverage would have halved.
Remark 28.3 (Leverage and the term of funding)
Leverage alone does not end a fund; losses end it when its lenders can demand margin faster than its positions recover. A fund with the same leverage but funding locked for months, and margin terms that cannot change overnight, has time; one whose lenders can raise haircuts daily has the survival horizon of chapter 14. The two decisions, how much leverage and on what terms, are one decision.
28.4 2006: a natural-gas fund’s concentration
The Senate subcommittee’s record describes a hedge fund, Amaranth Advisors, that built very large positions in natural gas contracts: at times 100 000 contracts in a single month, and, at times in the summer of 2006, about 40% of all the outstanding NYMEX contracts for the winter of 2006–2007 and 75% of those for November 2006. From the end of August to mid-September the natural gas positions lost more than $2 billion, and the fund liquidated its entire natural gas portfolio; Senator Coleman’s opening statement contrasted it with 1998: the Federal Reserve did not have to intervene.
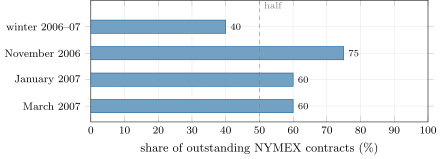
fm_casebook.AMARANTH.A position that is 75% of the open interest in a contract has no market to sell into but the other 25%: the fund is the market. Days to liquidate makes the point in the units a risk committee uses. With an illustrative average daily volume of 25 000 contracts in the month’s contract, 100 000 contracts take 20 days at 20% participation and 40 days at 10%; a one-day risk measure of such a position describes a risk the firm could not have exited in a day. Chapter 7’s concentration limits exist for this: a limit on a position’s share of open interest and on its days to liquidate binds before a limit on its dollar risk does, because it measures what the position would cost to leave.
Proposition 28.4 (Participation and the time to exit)
For a fixed position, days to liquidate is inversely proportional to the participation rate; with a square-root impact law (Book 10), the cost of exiting at participation grows like , so halving the cost of the exit requires quartering the participation, which quadruples the days and the time the position is exposed to the market.
Proof. is inversely proportional to . Under the square-root law the impact per unit traded at a daily rate is proportional to , so the total cost of trading is proportional to . Halving it requires , and then . ∎
28.5 August 2007: the crowded exit
In the week of 6 August 2007 a number of quantitative long-short equity hedge funds had unprecedented losses, followed by a significant rebound. On 13 August Goldman Sachs filed a statement that quantitative strategies were under pressure from an increase in overlapping trades, a surge in volatility and an increase in correlations, that its response had been to reduce risk and leverage, and that it and other investors were putting $3 billion of equity into one of its funds, Global Equity Opportunities, whose net asset value was about $3.6 billion. Khandani and Lo’s study of the week, which Book 7 and Book 8 discuss, hypothesised that the losses were initiated by the rapid unwind of one or more sizable quantitative equity market-neutral portfolios, and that those losses then put pressure on a broader set of equity portfolios.
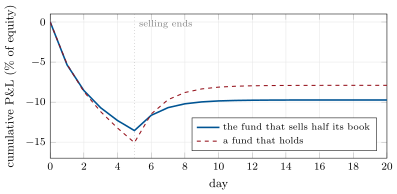
fm_cases1.august.The model is Book 7’s, and the numbers are synthetic: the point is the shape. The seller’s own trades move the prices of the stocks it holds, and the holder, whose book overlaps it, marks the same moves. Through the selling days the holder loses slightly more, since it still holds its whole book while the seller’s shrinks. When the selling stops, the temporary part of the impact decays and prices partly return: the holder recovers most of it, while the seller has sold at the bottom of its own move and recovers only on the half it kept. At day 20 the seller is down 9.7% and the holder 7.9%.
What the seller’s choice buys is protection against the scenario in which it cannot hold: a lender that calls, a risk limit that forces the cut, an investor who redeems. A fund with funding that lasts through the episode, and limits set in advance for it, can choose; one without is the seller whether it chooses or not. The overlap is what turns one firm’s decision into everyone’s loss: at an overlap of 0.52 the holder loses 4.3% by day 20, and with an unrelated book nothing, while the seller’s own loss hardly changes.
28.6 What the three share
Method 28.5 (Reading a failure for the decisions)
- Keep to the public record: official reports, court findings, filings. Put every number in a ledger with its source.
- Reconstruct the firm’s capital, positions and funding through the episode from those numbers, stating each derivation.
- List the decisions taken before the episode that set its terms: leverage, funding term, concentration, limits, who else held the same trades.
- Rerun the reconstruction with one decision changed, and state what the counterfactual assumes and ignores.
- Turn the result into a limit or a test the firm can run on itself: a leverage and funding-term pairing, a days-to-liquidate limit, a crowded-exit stress.
The three cases share a structure. Each firm held positions whose risk looked small in normal markets: spreads between close relatives, calendar spreads in one commodity, a hedged equity book. Each held them at a size, and with a leverage, that made its exit a market event. And each depended on others’ behaviour: lenders who could raise margins, a market with no one else on the other side, funds with the same trades. The firm-level decision that recurs is not the trade but the pairing of size, leverage and funding term with the market’s capacity to absorb the exit.
28.7 Build: the casebook, part 1
Purpose. The public record of the book’s case studies as small tables, each figure tied to its ledger row, and the reconstructions and counterfactuals of chapters 28 and 29.
Interface. firm.casebook: LTCM, AMARANTH, ltcm_returns, capital_path, days_to_liquidate, quant_unwind; the unwind simulator of firm.capacity.
Rules. Only figures from the ledger enter the tables; every derived figure states its derivation; illustrative inputs are named as such.
Acceptance tests. code/firm/casebook/tests/: the returns derived from the GAO figures, the capital path at scaled leverage, days to liquidate, and the seller and holder under a crowded exit.
Stretch. A funding-term counterfactual on firm.treasury.survival_horizon; a margin spiral for the natural-gas fund; the unwind with several sellers.
Sources and further reading
- US General Accounting Office, Long-Term Capital Management: Regulators Need to Focus Greater Attention on Systemic Risk, GAO/GGD-00-3, October 1999.
- US Senate, Permanent Subcommittee on Investigations, Excessive Speculation in the Natural Gas Market, hearing, S. Hrg. 110-235, 2007.
- The Goldman Sachs Group, Inc., Form 8-K, Exhibit 99.1, 13 August 2007.
- A. E. Khandani and A. W. Lo, “What happened to the quants in August 2007?”, 2007.
28.8 Exercises
Exercise 28.1 ★
From the GAO figures, derive the 1998 fund’s capital at the end of July and its return on capital from the end of August to 28 September.
Solution
Solution of Exercise 28.1.
billion at the end of July. On 28 September the $3.6 billion was 90% of the net asset value, so the existing investors held billion: a return of since the end of August.
Exercise 28.2 ★
Define funding liquidity risk and market liquidity risk, and say which of the two dominates each of the chapter’s three cases.
Solution
Solution of Exercise 28.2.
See Definition 28.1. In 1998, funding: lenders and counterparties could call margin faster than the spreads recovered. In 2006, market: the fund held most of the open interest in some contracts and had no one to sell to. In August 2007, market liquidity through crowding, turned into funding pressure by leverage and risk limits.
Exercise 28.3 ★
How many days does it take to liquidate 100 000 contracts at 10% of an average daily volume of 25 000?
Solution
Solution of Exercise 28.3.
days.
Exercise 28.4 ★★
At 28 to 1, what fall in the value of the balance sheet’s assets, net of hedges, wipes out the capital of $4.67 billion, and what size was the balance sheet?
Solution
Solution of Exercise 28.4.
; the balance sheet was about billion. Net of hedges, the spread positions moved far less than their gross value on a normal day, which is why the leverage looked acceptable.
Exercise 28.5 ★★
Prove Proposition 28.4. What does it imply for a position that is 75% of the open interest?
Solution
Solution of Exercise 28.5.
See the proof of Proposition 28.4. At 75% of the open interest the volume available to the position is small against its size, so any participation low enough to limit impact means weeks of exposure, and the fund’s own sales are most of the market’s selling.
Exercise 28.6 ★★
Why does the holder in Figure 28.4 lose more than the seller by day 5 and less by day 20?
Solution
Solution of Exercise 28.6.
Through day 5 the holder keeps its whole book while the seller’s shrinks, so the holder marks more of each day’s move. After the selling stops the temporary impact decays: the holder recovers on its whole book, the seller only on the half it kept, having sold the rest at the moved prices.
Exercise 28.7 ★★★
Coding. Rerun quant_unwind with an overlap of 0.5 and of 0. What are the seller’s and the holder’s losses at day 20?
Solution
Solution of Exercise 28.7.
At an overlap of 0.5 (0.52 measured) the seller is down 9.8% at day 20 and the holder 4.3%; with unrelated books the seller is down 9.7% and the holder 0.1% up. The seller’s loss is its own impact; the holder’s is the overlap.
Exercise 28.8 ★★★
Find the flaw. “The position’s one-day value at risk is only 5% of our capital, so it cannot hurt us badly.”
Solution
Solution of Exercise 28.8.
A one-day value at risk assumes the position can be exited within a day near the model’s prices. A position of weeks to liquidate carries weeks of price risk, and its own sales move the price; the natural-gas fund’s positions were most of the open interest in some contracts.
28.9 Problem: Three Firms, Three Decisions
Problem 28.1
Weekend problem — three firms, three decisions
A new chief risk officer is asked by the board which lessons of the best-known quantitative failures apply to the firm, and what to change.
Part I — The reading.
- What does a useful reading of a failure keep to, and what does it avoid?
- Define funding liquidity risk and market liquidity risk.
- Describe the loop that joins them.
- Define days to liquidate.
Part II — The record.
- Summarise the public record on the 1998 fund.
- Why did the Federal Reserve facilitate a private recapitalisation?
- Summarise the public record on the natural-gas fund.
- What did Goldman Sachs state on 13 August 2007?
Part III — The reconstructions.
- Derive the 1998 fund’s returns on capital by period.
- Give its capital path, actual and at half the leverage.
- What does the half-leverage counterfactual assume and ignore?
- Give the natural-gas fund’s days to liquidate at 20% and 10% participation.
- State and prove Proposition 28.4.
- Give the seller’s and the holder’s losses at days 1, 5 and 20, and explain the crossing.
Part IV — The lessons.
- What do the three cases share?
- Which limits would you add to the firm’s framework?
- How would you stress a crowded exit on the firm’s own book?
- Why are leverage and funding term one decision?
- State the named result: on the public figures, the 1998 fund’s capital at the end of September had it run half the leverage; the natural-gas fund’s days to liquidate at a stated share of volume; and the August 2007 seller’s loss against the holder’s.
- In two sentences, write the recommendation.
Solution
Solution of Problem 28.1.
- The public record and the numbers reconstructed from it; it avoids villains, hindsight and motives the record does not state.
- See Definition 28.1.
- Losses raise margin calls, calls force sales, sales move prices, and moved prices are losses for everyone holding the same positions (Figure 28.1).
- See Definition 28.2.
- See Box 28.1: $4.67 billion of capital at the end of 1997 at 28 to 1, $2.3 billion at the end of August after a 44% loss, and $3.6 billion from 14 firms on 28 September, 90% of the net asset value.
- It judged that a rapid liquidation of the fund’s positions, and of related positions of others, might threaten already unsettled markets.
- Up to 100 000 contracts in a month, about 40% of the winter 2006–07 NYMEX contracts and 75% of November’s; more than $2 billion lost from late August to mid-September, and the natural gas portfolio liquidated.
- Overlapping trades, higher volatility and correlations; risk and leverage reduced; $3 billion of equity into a quantitative fund worth about $3.6 billion.
- January to July, in August, to 28 September.
- Actual $4.67, 4.11, 2.30 and 0.40 billion; at half the leverage $4.67, 4.39, 3.42 and 2.01 billion.
- The same asset returns, when part of September’s fall was trading against a fund in distress; no credit for fewer margin calls; and nothing taken from the years before, which half the leverage would have halved.
- 20 days and 40 days, at the illustrative 25 000 contracts a day.
- See Proposition 28.4.
- Seller , , ; holder , , ; the holder keeps more of the book through the selling and so more of the recovery after it.
- Small-looking risk at a size and leverage that made the exit a market event, and dependence on lenders, the other side and other funds.
- A pairing of leverage with funding term, limits on share of open interest and days to liquidate, and a crowded-exit stress.
- Estimate the overlap of the book with public holdings or crowding measures (Book 7), then run an unwind of a large overlapping seller and charge the book for the moves.
- Leverage sets how far losses reach the capital; the funding term sets how long the firm can wait for them to reverse.
- $2.01 billion instead of $0.40 billion at half the leverage; 20 days at 20% of the illustrative volume (40 at 10%); the seller down 9.7% at day 20 against 7.9% for the holder.
- Pair every leverage limit with a minimum funding term and cap each position’s days to liquidate and share of open interest. Stress the book for a crowded exit, and decide in advance whether it would sell or hold.
28.10 Interview questions
Interview question 28.1 ★ risk
What is the difference between funding liquidity risk and market liquidity risk? Give an example of each.
Solution
Solution of Interview question 28.1.
Funding: a lender raises haircuts and the firm cannot meet the call. Market: a position is so large against volume that selling it moves the price.
What the interviewer is looking for: both definitions and how they feed each other.
Interview question 28.2 ★ trader, risk
A fund runs its balance sheet at 25 times capital. What fall in its assets wipes it out, and why might that overstate its risk?
Solution
Solution of Interview question 28.2.
. Gross assets overstate the risk of hedged spread positions; the relevant measure is the net risk under stress, when spreads move together.
What the interviewer is looking for: gross against net.
Interview question 28.3 ★★ risk
One of your traders holds 40% of the open interest in a futures contract. How do you measure the risk, and what limit would you set?
Solution
Solution of Interview question 28.3.
By the days to liquidate and the impact of an exit, not by a one-day risk measure; limit the share of open interest and the days to liquidate.
What the interviewer is looking for: exit cost over one-day risk.
Interview question 28.4 ★★ researcher, trader
Your statistical-arbitrage book is losing three times its usual daily risk for the third day running and your competitors seem to be too. Do you sell or hold?
Solution
Solution of Interview question 28.4.
It depends on funding and limits: if the loss is a crowded exit and the firm can hold through it, holding recovers more; if a call or limit will force the cut later, cutting early costs less. Check the overlap and the funding horizon first.
What the interviewer is looking for: the decision depends on funding, not only on the signal.
Interview question 28.5 ★★ risk, trader
Why would a fund’s creditors recapitalise it rather than let it fail?
Solution
Solution of Interview question 28.5.
A forced liquidation would move prices against their own positions in the same trades and against their exposures to the fund.
What the interviewer is looking for: the creditors’ own books.
Interview question 28.6 ★★★ researcher, risk
Design a stress test of a crowded exit for a long-short equity book. What inputs does it need that the firm does not observe?
Solution
Solution of Interview question 28.6.
The book’s positions, their volumes and volatilities, an impact model, and the size and overlap of other holders’ books, which it must estimate from public holdings, crowding measures or past episodes.
What the interviewer is looking for: the unobserved overlap.