The Desk and the Firm · The firm
6The Head of Desk’s Job
The budget meeting in December sets next year’s revenue target at this year’s result plus ten per cent, and leaves the desk’s risk limits where they were. This year’s result was exactly what the desk expects to make; its revenue has a Sharpe ratio of 1.3. With those limits the desk meets the new target in 45 years out of a hundred. The head of desk has been handed a plan that fails more often than it succeeds, before a single trade; to meet it three years in four, the desk would have to run more than twice its risk. This chapter is about the numbers a head of desk agrees to in December and runs by for the rest of the year.
6.1 The budget: revenue, costs and the plan
Definition 6.1 (Revenue budget, allocated cost)
A desk’s revenue budget is the revenue it commits to produce in the coming year, agreed with the firm’s management and used to plan its costs, its pay pool and its capital. An allocated cost is a share of the firm’s shared costs, technology, premises, control functions, market data, charged to the desk by an allocation key (headcount, revenue, usage).
A desk’s plan has three parts: revenue by business, costs (its own direct costs and those allocated to it), and the capital and limits it will use (chapter 7). The chapter’s desk (illustrative, $ millions a year) runs three businesses: client flow, expected revenue 30 and volatility 25; inventory trading, 15 and 20; structured solutions, 10 and 12; correlated 0.3, 0.2 and 0.4. Its expected revenue is 55, its volatility 42.2 and its Sharpe ratio 1.30. Direct costs of 18 and allocated costs of 10 leave, after variable pay of 20% of a positive result, an expected profit of 20.5, and a 26% chance that revenue does not cover costs.
Proposition 6.2 (What a target above expectation costs)
Let annual revenue be normal with mean and volatility , Sharpe ratio , and let the budget be . The probability of meeting it is
For it is below one half and falls as the Sharpe ratio rises. Scaling every position by (mean and volatility both scale) meets the budget with probability if and only if , , which requires .
Proof. , decreasing in when . After scaling, revenue is normal with mean and volatility : iff , i.e. , which has a positive solution only if . ∎
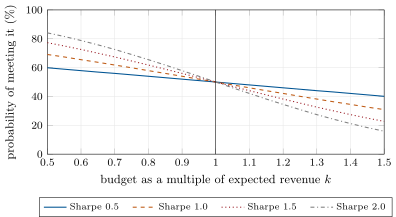
The counter-intuitive half of the proposition is the useful one: a steadier desk is less likely to beat a stretch target, because its results cluster closer to their mean (Figure 6.1). At and the desk meets its budget with probability 44.8% (45.0% in 20 000 simulated years); to meet it with probability 75% it must scale every position by 2.28. A budget that sits above the desk’s expected revenue does not ask for effort: it asks for risk.
fm_head.p_meet_closed.Method 6.3 (Negotiating a budget)
- Estimate each business’s expected revenue and volatility from its own history, on current limits, not from last year’s result alone.
- Compute the desk’s expected revenue, volatility and Sharpe ratio, and the probability of meeting the proposed budget (Proposition 6.2).
- If the budget is above expectation, state the risk scale it requires and ask for the limits that go with it, or for a budget at expectation.
- Agree the costs allocated to the desk and the key that allocates them; check that the desk covers its full costs in its expected year.
6.2 Risk appetite: from a loss the firm can bear to limits
Definition 6.4 (Risk appetite, risk appetite statement)
A firm’s risk appetite is the aggregate level and types of risk it is willing to take, within the maximum it could take given its capital, liquidity and obligations, to achieve its strategy and business plan. Its risk appetite statement is the written form: qualitative statements and quantitative measures relative to earnings, capital, risk and liquidity, which its risk limits then allocate to business lines, desks and risk types.
The definitions follow the Financial Stability Board’s principles of 2013, which also name the upper bound, risk capacity, the most risk a firm can take before breaching its regulatory capital and liquidity constraints. A statement such as “the firm accepts a loss of at most $20 million in a one-in-twenty year from this desk” becomes limits in three steps (Figure 6.2).
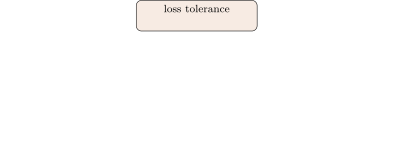
firm.deskplan.cascade.With expected revenue , a loss of at most at 95% confidence allows a volatility of : the desk, at 42.2, may scale up by 8%. At 99% one day, the corresponding value at risk (One Quant Book 6, chapter 21) is . The $20 million of tolerance, shared by each business’s volatility, gives stops of 8.8, 7.0 and 4.2. The cascade is the risk hierarchy of One Quant Book 6, chapter 29, read from the top: the limits are the risk appetite statement in numbers.
def risk_multiple(plan: Plan, prob: float) -> float:
    """Scale lambda of every position (mean and volatility both scale) so that P(revenue >= budget) = prob:
    lambda (mu - z sigma) = budget, possible only if the desk's Sharpe ratio exceeds z = Phi^-1(prob)."""
    s = plan_stats(plan)
    z = _inv_phi(prob)
    edge = s["mu"] - z * s["sigma"]
    if edge <= 0:
        return math.inf
    return plan.budget / edge


def simulate(plan: Plan, n: int, rng, days: int = 252) -> dict:
    """n simulated years of daily revenue for the whole desk: annual totals and maximum drawdowns."""
    s = plan_stats(plan)
    d = rng.normal(s["mu"] / days, s["sigma"] / math.sqrt(days), (n, days))
    path = np.cumsum(d, axis=1)
    peak = np.maximum.accumulate(np.maximum(path, 0.0), axis=1)
    return {"annual": path[:, -1], "max_drawdown": (peak - path).max(1)}


def cascade(plan: Plan, loss_tolerance: float, conf: float = 0.95, var_conf: float = 0.99, days: int = 252) -> dict:
    """The firm bears a loss of at most loss_tolerance in a 1-in-(1/(1-conf)) year. With the desk's expected
    revenue mu, the volatility budget is (mu + L) / z_conf; the daily VaR limit is z_var * vol_budget / sqrt(days);
    each business's stop is its share of the volatility budget (by its own sigma) times the loss tolerance."""
    s = plan_stats(plan)
    vol = (s["mu"] + loss_tolerance) / _inv_phi(conf)
    sig = np.array([b.sigma for b in plan.businesses])
    stops = {b.name: loss_tolerance * w for b, w in zip(plan.businesses, sig / sig.sum(), strict=True)}
    return {"vol_budget": vol, "scale": vol / s["sigma"], "daily_var": _inv_phi(var_conf) * vol / math.sqrt(days),
            "stops": stops}
Remark 6.5 (The budget and the appetite must agree)
The desk’s risk appetite allows a volatility of 45.6; its budget, to be met three years in four, needs 2.28 times 42.2, or 96. A plan that sets one without the other asks the head of desk to break one of them. The planning round is where the firm chooses: a lower budget, a larger appetite, or a better Sharpe ratio, and only the first two can be chosen in December.
6.3 Product scope and new-product approval
Definition 6.6 (Product scope, new-product approval)
A desk’s product scope is the list of instruments, markets and client types it is authorised to trade. New-product approval is the process by which a firm reviews a new or modified product, market or activity before a desk may trade it: its risks, pricing and valuation, booking and settlement, legal and tax treatment, capital and compliance, each signed off by the function responsible.
A new product is where a desk’s risks are least understood and its controls least tested: the pricing model is new, the booking may be manual, the settlement process may not exist. US bank supervisors’ guidance expects banks to manage the risks of “new, modified, or expanded products and services” with appropriate approvals before a new activity starts and with controls to identify, measure, monitor and report its risks. For the head of desk, the approval process is the price of growth: every function that signs is one that will support the product when it goes wrong. Product scope also fixes what the desk may not do; a trader who finds a profitable trade outside it has found a request for approval, not a trade.
Method 6.7 (Taking a new product through approval)
- Write the product’s description: payoff, clients, expected volume, the desk’s risk and its hedges.
- For each function (risk, product control, operations, legal, tax, compliance, technology) list what it must build or check, and get its sign-off with conditions.
- Start with limits on size and a review date; move the product to business as usual only after the first review.
6.4 The rhythm: the day, the week, the year
A head of desk runs to a calendar that repeats. The contents vary by firm; the structure is common, because it follows the controls:
| when | what the head of desk does |
|---|---|
| every morning | read the previous day’s P&L and its explanation (One Quant Book 1, chapter 7), limit usage and breaks; the morning meeting on markets, positions and client flow |
| during the day | approve trades above delegated limits; watch intraday risk and stops; client calls |
| every evening | sign off the day’s P&L with product control (chapter 15); check positions against limits |
| every week | review each business against plan, its risk and its attribution; hiring and projects |
| every month | plan against actual (Figure 6.3); the risk committee’s review (chapter 12) |
| every year | budget and limits; pay pool and its allocation (chapter 10); product scope |
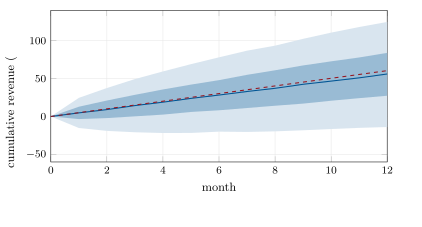
The monthly review compares cumulative revenue with the plan. A plan spread evenly over the year is a line; the desk’s revenue is a random path around its expectation, and the band it can wander in without meaning anything widens with the square root of time (Figure 6.3). In month three, a desk exactly on its expected path is already $1.4 million behind a budget ten per cent above it, well inside its noise; a head of desk who reacts to that gap by adding risk is reacting to noise.
fm_head.fan.6.5 Tutorial: next year’s plan
Goal. Build a desk’s plan, measure how likely it is to be met, and derive its limits from a loss tolerance. End state: Figure 6.3 and the numbers of Remark 6.5.
- The plan.
fm_head.PLANis afirm.deskplan.Planof three businesses, their correlations, costs and the budget;plan_statsgives expected revenue 55, volatility 42.2, Sharpe ratio 1.30. - The odds.
p_meetgives 44.8%;simulateconfirms it on 20 000 years and returns the maximum drawdowns (median $30.0 million, 90th percentile $50.4 million). - The risk the budget needs.
risk_multiple(PLAN, 0.75)gives 2.28 (Listing 6.1). - The cascade.
cascade(PLAN, 20)gives the volatility budget, the daily VaR limit and the stops. - The year.
fm_head.fan()gives the monthly percentiles of Figure 6.3.
What to change next. Raise the correlation between flow and inventory to 0.8 and redo the cascade; set the budget at expectation and compare the drawdowns the desk must live with.
6.6 Build: the desk plan
Purpose. The head of desk’s numbers in one place: the plan, its odds, the risk it needs and the limits the firm’s appetite allows.
Interface. firm.deskplan: Business(name, mu, sigma), Plan(businesses, corr, direct_cost, allocated_cost, var_pay, budget); plan_stats, p_meet, risk_multiple(plan, prob), simulate(plan, n, rng), cascade(plan, loss_tolerance, conf, var_conf), plan_vs_actual(plan, actual_monthly).
Rules. Revenue is normal over the year (the chapter says so where it matters); a budget that needs a Sharpe ratio above returns an infinite risk multiple; stops add up to the loss tolerance.
Acceptance tests. code/firm/deskplan/tests/: the closed form against simulation; the risk multiple solves its equation and is infinite when the Sharpe ratio is too low; the cascade’s volatility budget and stops; the plan-against-actual rows.
Stretch. Fat-tailed revenue (a Student-) and its effect on the cascade; stops by business from each business’s contribution to the desk’s volatility (chapter 7) instead of its stand-alone volatility.
Sources and further reading
- Financial Stability Board, Principles for an Effective Risk Appetite Framework, 18 November 2013.
- Office of the Comptroller of the Currency, Bulletin 2017-43, New, Modified, or Expanded Bank Products and Services: Risk Management Principles, 20 October 2017.
6.7 Exercises
Exercise 6.1 ★
A desk with a Sharpe ratio of 1 is given a budget at 1.1 times its expected revenue. What is its probability of meeting it?
Solution
Solution of Exercise 6.1.
.
Exercise 6.2 ★
The chapter’s desk expects 55 with volatility 42.2 and has costs of 28. What is the probability that revenue does not cover its costs?
Solution
Solution of Exercise 6.2.
.
Exercise 6.3 ★
Compute the volatility budget of a desk expecting 55 whose firm accepts a loss of at most 20 in a one-in-twenty year, and its daily 99% VaR limit.
Solution
Solution of Exercise 6.3.
; daily 99% VaR .
Exercise 6.4 ★★
Show that a desk of Sharpe ratio 1.3 cannot meet any budget with probability 95% by scaling its positions, whatever the budget.
Solution
Solution of Exercise 6.4.
Scaling needs , i.e. ; the desk’s 1.3 falls short, so no scale achieves 95% for any positive budget.
Exercise 6.5 ★★
From Figure 6.1, at what budget multiple does a desk of Sharpe ratio 2 have the same probability of success as a desk of Sharpe ratio 0.5 at ?
Solution
Solution of Exercise 6.5.
Sharpe 0.5 at : . Sharpe 2 needs : .
Exercise 6.6 ★★
In month three the desk of Figure 6.3 is exactly on its expected path. How far behind the budget is it, and how many standard deviations of its three-month revenue is that?
Solution
Solution of Exercise 6.6.
Budget to date against : $1.4 million behind. The three-month standard deviation is : 0.065 standard deviations, noise.
Exercise 6.7 ★★★
Coding. Rerun firm.deskplan.risk_multiple for the chapter’s desk with the budget at 1.2 times expectation and a target probability of 75%. What scale is needed, and what daily VaR would it imply?
Solution
Solution of Exercise 6.7.
Budget 66: ; daily 99% VaR , against 6.7 allowed.
Exercise 6.8 ★★★
Find the flaw. “We missed budget two years running although our Sharpe ratio is 1.3. The desk is underperforming.”
Solution
Solution of Exercise 6.8.
With a budget 10% above expectation the desk misses with probability 55% a year, and two years running with probability 30.5% if the years are independent. Two misses say little; compare revenue with expectation and the Sharpe ratio with its history.
6.8 Problem: Plus Ten Per Cent
Problem 6.1
Weekend problem — plus ten per cent
A head of desk is handed next year’s budget, ten per cent above this year’s result, with unchanged limits. She has a week to answer.
Part I — The plan.
- Define a revenue budget and an allocated cost.
- Give the desk’s expected revenue, volatility and Sharpe ratio from its three businesses.
- Give its expected profit after costs and variable pay, and the probability that revenue does not cover costs.
- What is the budget, in $ million?
Part II — The odds.
- State and prove Proposition 6.2.
- Give the probability of meeting the budget, in closed form and simulated.
- Why is a steadier desk less likely to beat a stretch budget?
- Give the median and 90th percentile of the desk’s maximum drawdown in a year.
- What risk scale meets the budget three years in four?
Part III — The appetite.
- Define risk appetite and a risk appetite statement, and name the upper bound on risk appetite.
- Turn a $20 million loss tolerance at 95% into a volatility budget.
- Give the daily 99% VaR limit and the stops by business.
- By how much may the desk scale up under its appetite?
- Compare the risk the appetite allows with the risk the budget needs.
Part IV — The answer.
- Define product scope and new-product approval, and say why a new product is where controls are weakest.
- In month three the desk is on its expected path. How far behind the budget is it, in $ million and in standard deviations?
- What should the head of desk not do in response?
- Which of the plan’s inputs can be changed in December, and which cannot?
- State the named result: the probability of meeting a budget of times expected revenue at Sharpe ratio , its value for this desk, and the risk scale needed to meet it three years in four.
- In two sentences, write her answer to the budget.
Solution
Solution of Problem 6.1.
- See Definition 6.1.
- 55, 42.2 and 1.30.
- About $20.5 million after costs and pay; 26% that revenue falls short of the $28 million of costs.
- $60.5 million.
- See Proposition 6.2.
- 44.8% in closed form, 45.0% in 20 000 simulated years.
- Its results cluster near the mean, so a target above the mean is further in units of its volatility.
- $30.0 million and $50.4 million.
- 2.28 times every position.
- See Definition 6.4; the upper bound is the firm’s risk capacity.
- .
- 6.7 a day; stops 8.8, 7.0 and 4.2.
- By 8% (45.6 against 42.2).
- The appetite allows 45.6 of volatility; meeting the budget three years in four needs about 96.
- See Definition 6.6; its pricing, booking and settlement are new and untested.
- $1.4 million, 0.065 standard deviations.
- Add risk to catch up: the gap is noise, and adding risk after losses breaks the appetite.
- The budget and the limits; the desk’s Sharpe ratio is not a December decision.
- : 44.8% at , ; a risk scale of 2.28 to meet it with probability 75%.
- The budget is above the desk’s expected revenue and so is met less than half the time on current limits; either set it at expectation, or raise the limits by the factor it needs, which the firm’s risk appetite does not allow.
6.9 Interview questions
Interview question 6.1 ★ trader
Your desk’s Sharpe ratio is 1. What is the probability it makes less than its expected revenue in a year? Less than zero?
Solution
Solution of Interview question 6.1.
50%, and for a loss.
What the interviewer is looking for: normal quantiles in Sharpe units.
Interview question 6.2 ★ risk
What is a risk appetite statement, and how does it become a desk’s limits?
Solution
Solution of Interview question 6.2.
A written statement of the losses and risks the firm accepts, in earnings, capital and liquidity; cascaded into volatility budgets, VaR limits and stops by desk and business.
What the interviewer is looking for: the top-down cascade.
Interview question 6.3 ★★ trader, researcher
Management raises your budget 20% and keeps your limits. What does that do to your odds, and what would you ask for?
Solution
Solution of Interview question 6.3.
At a Sharpe ratio of 1.3 the odds fall from 50% to ; ask for the limits the budget needs or a budget at expectation.
What the interviewer is looking for: and the link between budget and risk.
Interview question 6.4 ★★ trader
You are three months into the year and behind a budget spread evenly. When should that worry you?
Solution
Solution of Interview question 6.4.
When the gap is large relative to the volatility of revenue to date, which grows with the square root of time; a quarter in, most gaps are noise.
What the interviewer is looking for: scaling the band with .
Interview question 6.5 ★★ bank, risk
A trader wants to trade a product the desk has never traded. What has to happen first, and why?
Solution
Solution of Interview question 6.5.
New-product approval: risk, product control, operations, legal, tax, compliance and technology review it and sign off, often with initial size limits; its controls are the least tested.
What the interviewer is looking for: the approval process and why.
Interview question 6.6 ★★★ researcher, risk
Why can a higher Sharpe ratio lower the probability of meeting a budget? When does it raise it?
Solution
Solution of Interview question 6.6.
falls in when (a stretch budget) and rises when (a conservative one).
What the interviewer is looking for: the sign of .