The Desk and the Firm · The firm
1The Economics of a Trading Firm
In 2020, a year of high volatility, a listed electronic market maker’s revenue rose from $1 517 million to $3 239 million, 2.13 times the year before. Its pay rose by 2.6% and its communication and data bill by 2.1%. The same cost base that had left it with a pre-tax loss of $116 million in 2019 left it with a pre-tax profit of $1 383 million in 2020. A listed quantitative asset manager, paid on the assets it manages and on the performance it delivers, lived a different cycle over the same years: its revenue rose when its trend-following funds did well and fell when they did not, whatever the volatility index did, and it paid a large share of each marginal dollar out in bonuses. This chapter reads both firms, and a bank’s markets division, through one standard set of lines, and asks of each the same two questions: which costs are fixed, and how far can revenue fall before profit is gone.
1.1 The income statement of a trading firm
Every trading firm, whatever it calls its lines, spends its revenue in the same four places: on costs that grow with the business it does (exchange and clearing fees, payments for order flow, the financing of the positions it holds), on pay, on the fixed machinery of the firm (technology, market data, premises, administration), and on what is left for its owners and the tax authority.
Definition 1.1 (Net trading revenue, volume-driven cost)
A trading firm’s volume-driven costs are the costs that grow in proportion to the business it does: exchange, clearing and brokerage fees, payments for order flow, and the financing of its positions and of the margin behind them. Its net trading revenue is its trading and commission revenue, including interest and dividends earned on positions, less its volume-driven costs.
Net trading revenue is the market maker’s revenue capture (One Quant Book 11, chapter 1) summed over a year’s volume, and the right top line for comparing firms: two firms that earn the same after fees are the same business, whatever their gross revenue. A market maker that holds large inventories financed by securities lending reports both the interest it earns and the interest it pays; netting them is what makes its revenue comparable with an asset manager’s fees.
Definition 1.2 (Fixed cost base)
A firm’s fixed cost base is the part of its costs that does not move with its revenue within a year: fixed pay, technology and communication, market data, premises, administration and depreciation. Its operating margin is operating profit, net trading revenue less pay less the other fixed costs, as a share of net trading revenue.
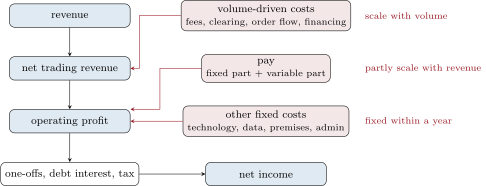
firm.firmecon); the costs on the right are taken off in order, and what each one does when revenue moves is written beside it.The mapping is a table from each filer’s reported lines to the standard ones (Listing 1.1). Three filers of three business models run through the chapter: an electronic market maker’s annual reports on Form 10-K for 2019–2025, a listed quantitative asset manager’s annual results for 2020–2025, and a bank’s markets segment for 2023–2025. Their figures, in $ millions as filed, are committed as small derived tables with the chapter’s code.
MAP_VIRTU = {
    "net_revenue": [("trading_income", 1), ("commissions_tech", 1), ("interest_div_income", 1),
                    ("brokerage_fees", -1), ("interest_div_expense", -1)],
    "volume_cost": [("brokerage_fees", 1), ("interest_div_expense", 1)],
    "comp": [("comp", 1)],
    "other_fixed": [("comm_data", 1), ("ops_admin", 1), ("dep_amort", 1)],
}
MAP_MAN = {
    "net_revenue": [("net_revenue", 1), ("asset_servicing", -1)],
    "volume_cost": [("asset_servicing", 1)],
    "comp": [("comp", 1)],
    "other_fixed": [("other_costs", 1), ("other_employment", 1)],
}
MAP_GS = {  # the segment does not split out volume-driven fees: all its revenue counts as net
    "net_revenue": [("net_revenues", 1), ("provision", -1)],
    "comp": [("comp", 1)],
    "other_fixed": [("other_opex", 1)],
}Example 1.3 (The market maker’s 2025 net trading revenue)
Virtu Financial’s 2025 income statement reports trading income of $2 436.7 million, commissions and technology services of $617.0 million, interest and dividends income of $508.8 million, and among its expenses brokerage, exchange, clearance fees and payments for order flow of $769.8 million and interest and dividends expense of $647.4 million. Its net trading revenue is million; the volume-driven costs take of the revenue before other income. Pay ($528.1 million) and the other fixed costs (communication and data $249.2 million, operations and administration $97.9 million, depreciation and amortisation $64.4 million, $411.5 million in all) leave an operating profit of $1 205.7 million, a margin of 56.2% on net trading revenue.
The firm itself reports the same $2 145.3 million under another name, adjusted net trading income, and calls it a non-GAAP measure. Most listed trading firms publish such measures, because the accounting standards were not written for their businesses; the reader’s task is to find the reconciliation and check that the adjustments go both ways.
Definition 1.4 (Non-GAAP measure)
A non-GAAP measure is a figure of performance or position that a company publishes alongside its statutory accounts but that excludes amounts the accounting standards include, or includes amounts they exclude: adjusted revenue, core profit, adjusted earnings. Securities regulators require it to be labelled, defined and reconciled to the nearest statutory figure.
As of September 2026 — The rules on non-GAAP and alternative measures
In the United States, Regulation G (17 CFR 244.100–102) requires a registrant that discloses a non-GAAP financial measure to present the most directly comparable GAAP measure with it and a quantitative reconciliation of the two; Item 10(e) of Regulation S-K applies the same to filings with the SEC. In the European Union, ESMA’s Guidelines on Alternative Performance Measures (ESMA/2015/1415, 5 October 2015) require such measures to be defined, given meaningful labels and reconciled to the most directly reconcilable line of the financial statements. Man Group, for example, states that its “core” measures are alternative performance measures and reconciles them to statutory profit.
1.2 Costs that scale and costs that do not
The three firms spend their revenue in very different proportions (Figure 1.2). The market maker gives four dollars in ten to exchanges, clearing houses, brokers and lenders before it pays anyone; the asset manager’s volume-driven costs, its asset servicing, are five in a hundred, but it pays almost half its revenue to its staff; the bank segment reports no volume-driven line of its own, because its fees sit inside other operating expenses, and those are larger than its pay.
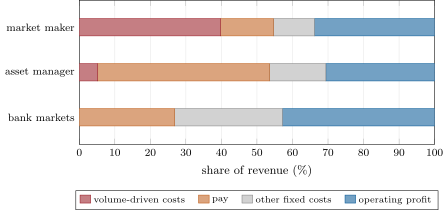
fm_econ.latest_shares.The split between costs that scale and costs that do not decides what a bad year does to a firm. Write net trading revenue as (net of volume-driven costs), the fixed part of the costs, fixed pay included, as , and let variable pay take a share of each dollar of net revenue. Operating profit is
Proposition 1.5 (Break-even fall and operating leverage)
If , operating profit reaches zero when net trading revenue falls by the fraction
and the elasticity of operating profit to net trading revenue, the operating leverage, is
For given total costs at the current revenue, a larger variable share raises the break-even fall and lowers the operating leverage.
Proof. Solve for ; differentiate . For the comparison, hold total costs fixed: then does not depend on , while , the numerator of the leverage, falls as rises, and rises. ∎
Operating leverage is Book 11’s proposition for a market maker’s volume (chapter 1 there) written for the whole firm: there the fixed costs faced volume, here they face net revenue after every volume-driven cost. The one new ingredient is pay. A firm that pays a fixed share of every marginal dollar in bonuses shares its bad years with its staff; a firm whose pay is mostly salary does not.
Example 1.6 (A firm of 100)
A firm has net trading revenue of 100, fixed pay of 15, variable pay of 30% of net revenue and other fixed costs of 35: operating profit is . With pay that flexes, and : the break-even fall is and the operating leverage 3.5. Were the same 45 of pay all salary, and : the break-even fall is and the operating leverage 5. Flexible pay turns a firm that loses money after a 20% fall into one that survives a 28% fall.
Method 1.7 (Reading a firm’s cost structure from its filings)
- Map every reported line onto the standard lines and check that they add up to reported pre-tax profit, the one-off items apart.
- Compute net trading revenue, pay and other fixed costs for every year available (five at least).
- Regress pay on net trading revenue across the years: the slope estimates , the intercept fixed pay. Read the slope’s standard error before the slope.
- Take the other fixed costs at their latest level, and compute and the operating leverage at the latest year’s revenue, with the estimated and with .
1.3 Pay: the largest line, and how much of it is variable
Definition 1.8 (Compensation ratio)
A firm’s compensation ratio is its total pay, salaries, bonuses, deferred awards and payroll taxes, as a share of its net revenue over the same period. Firms that publish it state their own definition of net revenue.
A compensation ratio is not a cost structure. The asset manager’s ratio was 40% in 2021 and 2022 and 50% in 2023 (Man Group’s own figures, pay over core net revenue before asset-servicing costs); its stated policy is a ratio “between 40% and 50% of core net revenue, depending on the mix and level of revenue”. The ratio rose in 2023 because revenue fell by more than pay did: a ratio moves against revenue whenever part of pay is fixed. The slope of pay against revenue across years says how much of pay is in fact variable (Figure 1.3).
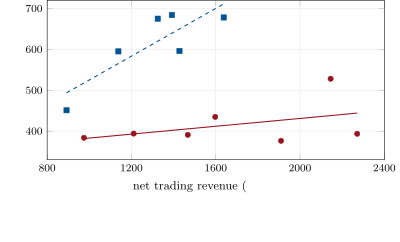
fm_econ.pay_fit.The market maker’s pay was between $376 million and $394 million in every year from 2019 to 2023, while its net trading revenue ranged from $975 million to $2 271 million; the slope is 0.048 with a standard error of 0.045, indistinguishable from zero. Its 2025 pay, $528 million, sits far above the line, the first sign that it had begun to change. The asset manager’s slope, 0.29 with a standard error of 0.094, says that about three dimes of each marginal dollar of its revenue went to pay. The bank segment’s three years give a slope of 0.20; three points make a line but not an estimate. The asset manager also reports the split directly for 2021: fixed compensation $208 million, variable $388 million.
Remark 1.9 (What six points can say)
A slope from six or seven annual points has four or five degrees of freedom and moves a great deal when one year is dropped: without 2020, the asset manager’s slope falls from 0.29 to 0.13, with a standard error of 0.13 (exercise 7). Growth in headcount, an acquisition or a change in the mix of fees shifts pay for reasons that have nothing to do with the year’s revenue. The regression is a first reading of the cost structure, to be checked against whatever the firm says about its fixed and variable pay, never a measurement of it.
| 2025 | market maker | asset manager | bank markets |
|---|---|---|---|
| net trading revenue ($ million) | 2 145.3 | 1 325 | 41 075 |
| pay / net trading revenue | 24.6% | 50.9% | 26.8% |
| operating margin | 56.2% | 32.3% | 42.8% |
| net trading revenue per head ($ million) | 2.09 | 0.77 | – |
| pay per head ($ million) | 0.51 | 0.39 | – |
1.4 Capital, financing and return on equity
Definition 1.10 (Return on equity)
A firm’s (or a business’s) return on equity, ROE, is its net income over a period divided by its average shareholders’ equity over the period; for a division of a larger firm, the equity is the share of the group’s equity the firm attributes to it.
The market maker earned net income, non-controlling interests included, of $912.3 million in 2025 on average total equity of $1 730 million: an ROE of 52.7%. In 2023, the quiet year, the same calculation gives 17.3%. The bank segment reports a return on average common equity of 16.4% for 2025, on attributed equity of $79.7 billion. The two numbers do not measure the same thing. A market maker’s equity is what its owners have left in the firm; it is bound by the capital rules for brokers and investment firms (chapter 2), and the balance sheet it finances with its brokers’ and lenders’ money is far larger than the equity. A bank’s segment equity is an allocation, set by whichever of the group’s capital constraints binds (chapter 5), and the group holds more of it than its markets business could ever lose in a year, by rule.
As of September 2026 — Three firms in their 2025 filings
Virtu Financial (Form 10-K for 2025): total revenue $3 632.1 million; volume-driven lines $1 417.2 million (brokerage, exchange, clearance fees and payments for order flow $769.8 million, interest and dividends expense $647.4 million); employee compensation $528.1 million; adjusted net trading income, a non-GAAP measure, $2 145.3 million; about 1 027 employees in February 2026. Man Group (results for 2025): core net revenue $1 398 million, of which net management fees $1 077 million and performance fees $281 million; core compensation $675 million, a compensation ratio of 48% (47% in 2024); core profit before tax $407 million; 1 719 staff at the end of the year. Goldman Sachs, Global Banking & Markets (Form 10-K for 2025): net revenues $41 453 million; compensation and benefits $11 025 million; other operating expenses $12 476 million; pre-tax earnings $17 574 million; average common equity $79 748 million; return on average common equity 16.4% (13.8% in 2024, 11.3% in 2023).
Remark 1.11 (Financing is a volume-driven cost)
Between 2021 and 2025 the market maker’s interest and dividends expense rose from $140 million to $647 million, and its interest and dividends income from $75 million to $509 million: higher rates raised both sides of the financing of its inventory. Net, the change was small; gross, it more than doubled the reported volume-driven costs. That is why this book nets financing into net trading revenue, and why a firm’s reported revenue can rise with interest rates while its business does not grow.
1.5 The cycle: volatility, volume and revenue
A market maker’s net revenue is volume times capture (One Quant Book 11), and both rise with volatility. Regressing the market maker’s net trading revenue on the year’s mean of the VIX index gives a slope of $52 million per index point (standard error 33) and a correlation of 0.58 over seven years. The asset manager’s net revenue has a correlation of with the same index: its revenue follows its assets and its funds’ performance, not market volatility. Over the seven years the market maker’s pay and fixed costs moved within a narrow band while revenue swung by a factor of 2.3 (Figure 1.4).
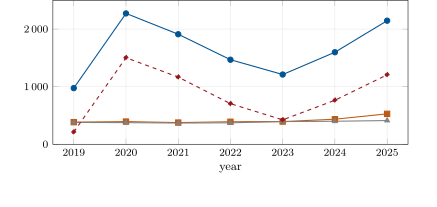
fm_econ.table.Applying Method 1.7 at each firm’s latest year gives its break-even fall and operating leverage, with pay flexing at the estimated slope and with pay held at its latest level:
| pay flexes | pay held fixed | |||
| break-even fall | leverage | break-even fall | leverage | |
| market maker (2025) | 59.0% | 1.69 | 56.2% | 1.78 |
| asset manager (2025) | 45.6% | 2.19 | 32.3% | 3.10 |
| bank markets (2025) | 53.3% | 1.88 | 42.8% | 2.34 |
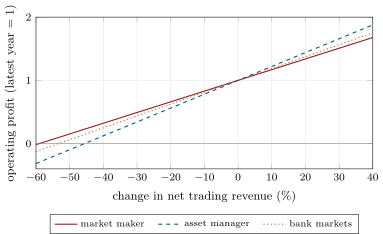
fm_econ.profit_curves on the 2025 filings.The market maker, the firm with the most rigid pay, is the most robust of the three at its 2025 revenue, because its margin is widest: a high margin is a large distance to break-even, however it was earned. The asset manager’s flexible pay is what keeps it alive in a bad year: held fixed, its pay would put break-even at a 32% fall instead of 46%. In 2019 the market maker’s margin was 21.8%, and its break-even fall at that year’s revenue, with the same pay slope, was 22.9%, against 59.0% in 2025. A firm’s robustness is a property of its cost base and of where it stands in the cycle.
1.6 Tutorial: three firms through one set of lines
Goal. Read three firms’ filings through one chart of accounts and measure each one’s cost structure. End state: the table of break-even falls and Figure 1.5.
- The data.
data/desk/filings_virtu.csv,filings_man.csvandfilings_gsgbm.csvhold each filer’s lines, in $ millions, with the filing and page recorded indata/desk/LICENSES.md;vix_annual.csvholds the index’s yearly mean, written byfm_fetch_vix.py(the only step that needs the network). - Map.
fm_econ.table(firm)maps each year onto the standard lines withfirm.firmecon.statementsand the tables of Listing 1.1. Check that the market maker’s net trading revenue reproduces its own non-GAAP figure, $2 145.3 million in 2025 and $1 597.7 million in 2024. - Fit pay.
fm_econ.pay_fit(firm)regresses pay on net trading revenue (Figure 1.3). Break-even.
fm_econ.structure(firm, flex)builds the cost structure and computes and the leverage (Listing 1.2);profit_curves()traces Figure 1.5.def cost_structure(sts, flex_pay: bool = True) -> CostStructure: """Fixed and variable parts from the firm's history. Pay: intercept and slope of comp on net revenue (flex_pay) or all fixed at its latest level; other fixed costs: their latest level.""" last = sts[-1] if flex_pay: a, b, _, _ = fit_line([s.net_revenue for s in sts], [s.comp for s in sts]) b = min(max(b, 0.0), 1.0) fixed_pay = last.comp - b * last.net_revenue return CostStructure(fixed_pay + last.other_fixed, b) return CostStructure(last.comp + last.other_fixed, 0.0) def profit(cs: CostStructure, nr): return (1.0 - cs.var_share) * np.asarray(nr, float) - cs.fixed def breakeven_fall(cs: CostStructure, nr: float) -> float: """Relative fall of net revenue that takes operating profit to zero: 1 - F / ((1 - b) NR).""" return 1.0 - cs.fixed / ((1.0 - cs.var_share) * nr) def operating_leverage(cs: CostStructure, nr: float) -> float: """Elasticity of operating profit to net revenue: (1 - b) NR / profit.""" p = float(profit(cs, nr)) if p <= 0: raise ValueError("operating leverage is defined only above break-even") return (1.0 - cs.var_share) * nr / pListing 1.2. The cost structure from a firm’s own years, and the break-even fall and operating leverage of Proposition 1.5. code/firm/firmecon/firm_firmecon.py - The cycle.
fm_econ.vix_fit(firm)regresses net trading revenue on the index’s yearly mean.
What to change next. Drop one year at a time and watch each slope move (exercise 7); add a fourth filer from its annual report, writing only a new mapping table.
1.7 Build: the firm’s economics as code
Purpose. One chart of accounts for every business model in the book, so that later chapters (the partnership, the platform, the fund, the bank desk, the entry plan) state their economics in the same lines.
Interface. firm.firmecon: Statement(year, net_revenue, comp, other_fixed, volume_cost, headcount, equity) with operating_profit; map_lines(row, mapping), statements(rows, mapping); ratios(st); fit_line(x, y) with standard errors; CostStructure(fixed, var_share), cost_structure(sts, flex_pay); profit, breakeven_fall, operating_leverage, cycle.
Rules. A mapping names every reported column it uses, with its sign; nothing is estimated from fewer than three years; operating leverage is undefined at or below break-even and raises an error there.
Acceptance tests. code/firm/firmecon/tests/: a mapping reproduces a hand-built statement; the fitted line is exact on exact data; profit is zero after the break-even fall; the leverage equals the numerical elasticity; flexible pay lowers leverage and raises the break-even fall at equal total cost.
Stretch. A parser from a filer’s XBRL facts to the mapping’s columns; a cycle scenario in which volume-driven costs, net revenue and variable pay all move with a volatility path.
Sources and further reading
- Virtu Financial, Inc., Forms 10-K for 2019 to 2025 (SEC EDGAR), and the SEC’s XBRL company facts for the firm.
- Man Group plc, Results for the years ended 31 December 2021, 2023 and 2025.
- The Goldman Sachs Group, Inc., Form 10-K for 2025, segment results.
- Cboe Global Markets, VIX index daily history (derived annual means only).
- US Code of Federal Regulations, 17 CFR Part 244 (Regulation G); ESMA, Guidelines on Alternative Performance Measures, ESMA/2015/1415.
1.8 Exercises
Exercise 1.1 ★
From the market maker’s 2025 lines in Example 1.3, compute its net trading revenue and the share of its revenue before other income taken by volume-driven costs.
Solution
Solution of Exercise 1.1.
million. Volume-driven costs against revenue before other income : 39.8%.
Exercise 1.2 ★
The asset manager paid $675 million on core net revenue of $1 398 million in 2025 and $678 million on $1 696 million in 2022. Compute its compensation ratio in each year, as it defines it, and say why the ratio rose although pay fell.
Solution
Solution of Exercise 1.2.
in 2025 and in 2022. Pay fell by $3 million while revenue fell by $298 million: most pay does not follow revenue within a year, so the ratio moves against revenue.
Exercise 1.3 ★
The bank segment’s net earnings to common were $13 117 million in 2025 on average common equity of $79 748 million. Check its reported return on equity.
Solution
Solution of Exercise 1.3.
, as reported.
Exercise 1.4 ★★
For the firm of Example 1.6, compute operating profit after a 25% fall in net trading revenue with pay flexing, and with all pay fixed.
Solution
Solution of Exercise 1.4.
Net revenue 75. Pay flexing: . All pay fixed: , a loss.
Exercise 1.5 ★★
From 2019 to 2020 the market maker’s net trading revenue rose from $974.7 million to $2 271.4 million and its operating profit from $212.4 million to $1 502.8 million. Compute both percentage changes and their ratio, and compare the ratio with its operating leverage in 2019.
Solution
Solution of Exercise 1.5.
Net revenue , operating profit , ratio 4.57. The operating leverage at the 2019 revenue is with the fitted pay slope (4.59 with pay fixed): the arc ratio over a doubling is close to the point elasticity because costs barely moved.
Exercise 1.6 ★★
In Figure 1.3, which of the market maker’s points lies furthest above its line, and what two readings of it would you check against the filing?
Solution
Solution of Exercise 1.6.
2025: pay $528.1 million against $438.0 million on the line. Check whether pay began to follow revenue (a larger variable award in a strong year) and whether the firm grew: its headcount rose from about 969 to about 1 027 between the two filings.
Exercise 1.7 ★★★
Coding. Refit the asset manager’s pay on its net trading revenue without 2020. What are the slope and its standard error, and what does the change say about the estimate?
Solution
Solution of Exercise 1.7.
Without 2020 the slope is 0.13 with a standard error of 0.13, against : one low-revenue, low-pay year carried the estimate. The slope is a first reading, and the firm’s own split of fixed and variable pay is the better source.
Exercise 1.8 ★★★
Find the flaw. “The market maker earned 52.7% on its equity in 2025 and the bank’s markets business 16.4%: market making is more than three times as good a business as banking.”
Solution
Solution of Exercise 1.8.
The denominators differ: a market maker’s equity is what its owners left in the firm, which finances a much larger balance sheet through brokers and lenders; a bank segment’s equity is an allocation set by the group’s capital rules. The years differ too: the market maker’s ROE was 17.3% in 2023. Returns on equity compare businesses only when equity is measured the same way and over a cycle.
1.9 Problem: Three Firms, One Bad Year
Problem 1.1
Weekend problem — three firms, one bad year
A board asks how each of three listed businesses would survive a year in which its net trading revenue falls by a third. You have their filings.
Part I — The lines.
- Define net trading revenue and volume-driven costs, and say why financing belongs among the latter.
- Compute the market maker’s net trading revenue in 2025, and check it against the figure it publishes.
- Give each firm’s 2025 operating profit and operating margin on net trading revenue.
- Give the market maker’s and the asset manager’s net trading revenue and pay per head.
- State what Regulation G and ESMA’s guidelines require of a non-GAAP or alternative measure.
Part II — The cost structure.
- Write operating profit as a function of net trading revenue with fixed costs and a variable share .
- Derive the break-even fall and the operating leverage, and show that one is the reciprocal of the other.
- Give each firm’s estimated pay slope with its standard error, and say which estimates you trust.
- Give each firm’s with pay flexing.
- Why does the asset manager’s compensation ratio move against its revenue?
Part III — The bad year.
- Give each firm’s break-even fall with pay flexing and with pay held fixed.
- Give each firm’s operating leverage in both cases.
- What share of its 2025 operating profit does each firm keep after a 30% fall, with pay flexing?
- Which firm survives a fall of a third, and which only because its pay flexes?
- What was the market maker’s operating margin in 2019, and its break-even fall at that year’s revenue?
Part IV — The verdict.
- Give the slope and correlation of the market maker’s and the asset manager’s net trading revenue against the VIX index’s yearly mean.
- Compute the market maker’s return on equity in 2025 and in 2023.
- Why do its return on equity and the bank segment’s measure different things?
- State the named result: each firm’s break-even fall and operating leverage with pay flexing and held fixed.
- In two sentences, what should the board of a firm with rigid pay and a thin margin do first?
Solution
Solution of Problem 1.1.
- Revenue less the costs that grow with the business done; financing of positions and margin grows with the positions, so it is one.
- $2 145.3 million, equal to the firm’s adjusted net trading income.
- Market maker $1 205.7 million, 56.2%; asset manager $428 million, 32.3%; bank segment $17 574 million, 42.8%.
- Market maker $2.09 million and $0.51 million per head; asset manager $0.77 million and $0.39 million.
- Label and define it, present the nearest statutory (GAAP) figure with it, and reconcile the two quantitatively.
- .
- ; the leverage is .
- Market maker ; asset manager ; bank segment 0.20 from three years. Only the asset manager’s is distinguishable from zero, and even it moves to 0.13 without 2020.
- $836.8 million, $510.8 million and $15 399.9 million.
- Part of its pay is fixed: when revenue falls, pay falls by less.
- Flexing: 59.0%, 45.6%, 53.3%. Held fixed: 56.2%, 32.3%, 42.8%.
- Flexing: 1.69, 2.19, 1.88. Held fixed: 1.78, 3.10, 2.34.
- 49.2%, 34.2% and 43.7% of 2025’s operating profit.
- All three survive a fall of a third with pay flexing; the asset manager only because its pay flexes (32.3% break-even with pay fixed).
- 21.8%; break-even fall 22.9% at the 2019 revenue.
- Market maker $52 million per index point (standard error 33), correlation 0.58; asset manager million (23), correlation .
- 52.7% in 2025 and 17.3% in 2023.
- The market maker’s equity is its owners’ capital behind a larger financed balance sheet; the bank segment’s is an allocation of group equity under capital rules.
- The table of the chapter: 59.0%/1.69 and 56.2%/1.78; 45.6%/2.19 and 32.3%/3.10; 53.3%/1.88 and 42.8%/2.34.
- Make more of pay variable, so that it moves with revenue, and cut fixed costs: both raise the break-even fall. A thin margin cannot be fixed by hoping for a volatile year.
1.10 Interview questions
Interview question 1.1 ★ trader, researcher
What is a compensation ratio, and why can it rise in a year when pay falls?
Solution
Solution of Interview question 1.1.
Pay over net revenue for the period. Part of pay is fixed, so when revenue falls faster than pay the ratio rises, even as pay falls.
What the interviewer is looking for: the definition and the fixed-part argument.
Interview question 1.2 ★ trader
Why is a market maker’s revenue higher in volatile years? Name the two channels.
Solution
Solution of Interview question 1.2.
Volume rises with volatility, and capture per unit (wider spreads) does too; both multiply into revenue.
What the interviewer is looking for: revenue as volume times capture, and both channels.
Interview question 1.3 ★★ risk
Two firms have the same revenue and the same total costs this year; one pays 30% of each marginal dollar as bonus, the other only salaries. Which has the higher operating leverage, and which survives a larger fall?
Solution
Solution of Interview question 1.3.
The salaried firm: with equal total costs its operating leverage exceeds , and its break-even fall is smaller. The bonus firm survives the larger fall.
What the interviewer is looking for: Proposition 1.5 and the reciprocal relation.
Interview question 1.4 ★★ trader, risk
A firm has net revenue of 100, fixed costs of 50 and variable costs of 20% of net revenue. What is its operating profit after a 40% fall in revenue?
Solution
Solution of Interview question 1.4.
Revenue 60: , a loss; profit before the fall was 30.
What the interviewer is looking for: variable costs scale down with revenue, fixed costs do not.
Interview question 1.5 ★★ bank
A proprietary market maker reports a return on equity above 50%; a bank’s markets division reports 16%. Give three reasons they cannot be compared directly.
Solution
Solution of Interview question 1.5.
Equity is measured differently (owners’ capital against an attributed share of group equity); the balance sheet is financed differently; the year and the cycle differ; capital rules differ in kind (chapter 2 against chapter 5).
What the interviewer is looking for: the denominator, not the numerator.
Interview question 1.6 ★★★ researcher
You regress a firm’s pay on its revenue over six years and find a slope of . How much do you trust it, and what else could produce it?
Solution
Solution of Interview question 1.6.
Four degrees of freedom: about three standard errors from zero, but one year can move it a lot (dropping 2020 halves it here). Headcount growth, an acquisition or a change in fee mix can raise pay and revenue together. Check the firm’s own split of fixed and variable pay.
What the interviewer is looking for: degrees of freedom, leave-one-out fragility, and confounders.