The Desk and the Firm · The firm
5The Bank Markets Division
A large US bank’s annual report for 2025 allocates $149.5 billion of its common equity to its commercial and investment bank and reports that the business earned 18% on it. The same report explains how the number was chosen: the allocation “incorporates Basel III Standardized risk-weighted assets and the global systemically important banks surcharge … as well as a simulation of capital depletion in a severe stress environment”. Every desk inside that business answers for its share of the equity, and its share depends on which of those rules binds for it. A repo desk that looks nearly free by one rule is the most expensive desk in the building by another.
5.1 What a markets division sells: flow, financing and structuring
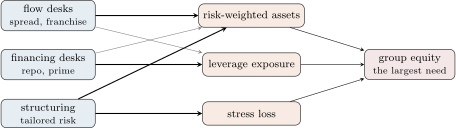
A bank’s markets division (One Quant Book 1, chapter 2) earns its revenue in three ways. Flow desks make markets for clients in rates, FX, credit, equities and commodities and earn the spread and the franchise (Book 1, chapter 2; Book 9, chapter 24). Financing desks lend cash and securities to clients, in repo, securities lending and prime services, and earn a spread on the balance sheet they lend. Structuring desks sell tailored derivatives and structured products and earn a margin that pays for the risk they warehouse (One Quant Book 5, chapter 19).
The three lines use the bank’s resources in very different proportions. A flow desk turns its inventory over and uses risk capital for the market risk it holds; a financing desk holds large, low-risk assets on the balance sheet for a thin spread; a structuring desk holds long-dated, complex risk that is capital-intensive per dollar of notional. What the division sells, therefore, is priced not in revenue but in revenue per unit of the constraint each business consumes.
5.2 The capital stack: common equity, leverage and stress buffers
Definition 5.1 (Common equity tier 1 capital)
A bank’s common equity tier 1 capital (CET1) is its ordinary shareholders’ equity, retained earnings and reserves, less deductions (goodwill and other intangibles, certain deferred tax assets); it is the capital that absorbs losses first while the bank is a going concern. Its CET1 ratio is CET1 capital over risk-weighted assets.
Definition 5.2 (Leverage ratio, leverage exposure measure)
A bank’s leverage ratio is its Tier 1 capital divided by its leverage exposure measure: its on-balance-sheet assets, less amounts deducted from Tier 1 capital, plus certain off-balance-sheet exposures (derivative potential exposure, securities financing, commitments), with no weighting by risk.
Definition 5.3 (Stress capital buffer, G-SIB surcharge)
A stress capital buffer is a capital buffer set from the capital a bank would lose in the supervisor’s severe stress scenario, added to its minimum ratio. A G-SIB surcharge is an additional capital buffer required of a global systemically important bank, set by a score of its size, interconnectedness, complexity, cross-jurisdictional activity and substitutability.
As of September 2026 — One bank’s capital stack at the end of 2025
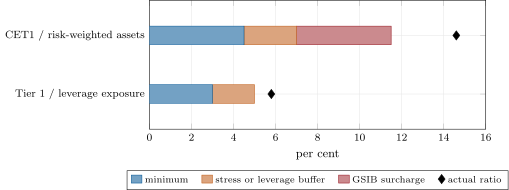
JPMorgan Chase & Co. (Form 10-K for 2025), Standardized approach: CET1 capital $288.5 billion on RWA of $1 981.7 billion, a CET1 ratio of 14.6% against a requirement of 11.5% including buffers (a 4.5% minimum, a stress capital buffer of 2.5%, the floor, in effect through 30 September 2027, and a GSIB surcharge of 4.5% under method 2; 2.5% under method 1). Supplementary leverage ratio 5.8% on total leverage exposure of $5 302.0 billion, against a 3.0% minimum plus a 2.0% buffer. In November 2025 the Federal Reserve, the OCC and the FDIC replaced the static enhanced-SLR buffers of the largest banks with a buffer of 50% of the holding company’s method 1 GSIB surcharge (capped at 1% for its bank subsidiaries). Equity allocated to the commercial and investment bank: $149.5 billion at the end of 2025, $166.5 billion from 1 January 2026; the business’s 2025 net income was $27 761 million and its ROE 18%.
The stack sets two requirements that bind in different places (Figure 5.2). For the bank of the dated box, the risk-based rules require Tier 1 capital of 13.0% of RWA, $257.6 billion; the leverage rule requires 5.0% of its leverage exposure, $265.1 billion. At the level of the whole bank the leverage rule binds, by a small margin; its leverage exposure is 2.7 times its RWA. A markets division whose financing business makes its leverage exposure four times its RWA faces a leverage rule that binds by a wide one.
5.3 Return on capital by desk
Definition 5.4 (Allocated equity, binding capital constraint)
A desk’s allocated equity is the share of the group’s equity it is charged with, computed from what it consumes of each constraint the group faces. The binding capital constraint of a desk, or of the group, is the constraint that requires the most equity for it: risk-weighted assets, leverage exposure or stress loss.
A desk’s return on allocated equity is its after-tax profit over its allocated equity, the desk-level version of the return on equity of chapter 1, and it is compared with the bank’s hurdle rate (One Quant Book 6, chapter 19). The division of the chapter (illustrative) has six desks. With equity of 13% of risk-weighted assets, 5% of leverage exposure, or the desk’s stress loss, a tax rate of 25% and the desks’ figures in the module (fm_bank.DESKS), their returns are:
| desk | RWA key | leverage key | binding (largest) | binds |
|---|---|---|---|---|
| flow rates | 15.4% | 9.6% | 9.6% | leverage |
| repo | 53.8% | 5.2% | 5.2% | leverage |
| prime services | 23.1% | 13.5% | 13.5% | leverage |
| equity derivatives | 18.1% | 27.5% | 18.1% | RWA |
| FX | 28.8% | 28.1% | 28.1% | leverage |
| credit | 10.4% | 22.5% | 10.4% | RWA |
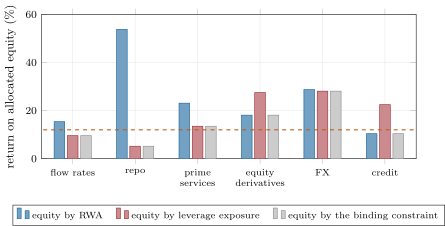
fm_bank.roae_table.The repo desk is the division’s best business by risk-weighted assets and its worst by leverage. Its assets are short-term secured loans with low risk weights, and they fill the balance sheet: $400 billion of leverage exposure for $15 billion of RWA. Equity derivatives and credit are the opposite: risk-heavy and balance-sheet-light, they are bound by RWA.
Proposition 5.5 (Allocating by each desk’s own maximum over-allocates)
Let desk need of equity under one constraint and under another, and let the group hold . Then , with equality only if the same constraint binds for every desk.
Proof. and for every ; sum each inequality. Equality in both sums requires for all or for all . ∎
The chapter’s desks need $35.1 billion of equity by RWA and $55.5 billion by leverage; the group holds $55.5 billion, but the desks’ own maxima add up to $62.1 billion. Charged each by its own binding constraint, the division would report a return of 11.4% on equity it does not have. A consistent allocation scales one key to the group’s binding constraint, or blends the keys with weights that add to the group’s equity, as the bank of the dated box does when it combines RWA, its GSIB surcharge and a stress simulation.
5.4 The balance sheet as a scarce input
Definition 5.6 (Balance-sheet charge)
A balance-sheet charge is an internal price per unit of balance sheet, usually of leverage exposure, charged to a desk for what it uses: the cost of the equity the leverage requirement makes the group hold against it.
Method 5.7 (Setting a balance-sheet charge)
- Take the equity the leverage requirement holds per unit of leverage exposure (5% here, or the bank’s target including buffers).
- Multiply by the hurdle rate: at 12% the charge is a year of leverage exposure.
- Deduct the charge from each desk’s pre-tax profit, alongside funds-transfer pricing (One Quant Book 6, chapter 24) for its funding.
- A desk whose profit after the charge is negative does not earn its cost of capital on the balance sheet it uses.
At 0.6% a year the repo desk’s $400 billion of leverage exposure costs $2.4 billion, and its after-tax profit of $1.05 billion becomes a loss of $0.75 billion. It breaks even at a charge of 0.35% (35 basis points) a year. The prime services desk earns $0.45 billion after the charge and equity derivatives $1.11 billion. The charge does not say that repo should close; it says that every dollar of balance sheet it uses must be priced at 60 basis points a year, and that the business is viable only at a spread above that.
def allocate(desks, keys: Keys) -> dict:
    rwa = np.array([d.rwa for d in desks]) * keys.k_rwa
    lev = np.array([d.le for d in desks]) * keys.k_le
    st = np.array([d.stress for d in desks])
    return {"rwa": rwa, "leverage": lev, "stress": st, "binding": np.maximum.reduce([rwa, lev, st])}


def roae(desks, equity, tax: float) -> np.ndarray:
    return np.array([d.profit(tax) for d in desks]) / np.asarray(equity, float)


def binding(desk: Desk, keys: Keys) -> str:
    parts = {"rwa": keys.k_rwa * desk.rwa, "leverage": keys.k_le * desk.le, "stress": desk.stress}
    return max(parts, key=parts.get)


def balance_sheet_charge(desk: Desk, rate_per_le: float, tax: float) -> float:
    """After-tax profit after a charge of rate_per_le per unit of leverage exposure (the charge is deductible)."""
    return (desk.revenue - desk.cost - rate_per_le * desk.le) * (1 - tax)


def breakeven_charge(desk: Desk) -> float:
    """The charge per unit of leverage exposure that takes the desk's profit to zero."""
    return (desk.revenue - desk.cost) / desk.le


def optimal_mix(desks, equity: float, keys: Keys, x_max: float = 1.5) -> np.ndarray:
    """Scale x_i in [0, x_max] of each desk (x = 1 today) maximising after-tax profit, subject to the group's
    equity covering the RWA-based and the leverage-based requirements of the whole mix."""
    c = -np.array([d.profit(keys.tax) for d in desks])
    A = np.array([[keys.k_rwa * d.rwa for d in desks], [keys.k_le * d.le for d in desks]])
    res = linprog(c, A_ub=A, b_ub=[equity, equity], bounds=[(0.0, x_max)] * len(desks), method="highs")
    if not res.success:
        raise RuntimeError(res.message)
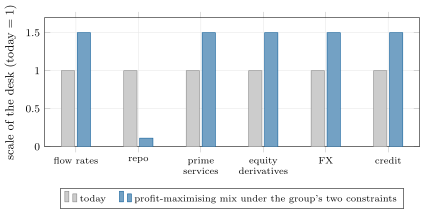
return res.xWith the group’s equity fixed at the $55.5 billion its leverage requirement holds today, the desk mix that maximises the division’s after-tax profit (a linear programme, firm.bankdesk.optimal_mix, each desk scaled between zero and 1.5 times its size) shrinks repo to about a tenth of its size and grows every other desk to the cap (Figure 5.4): profit rises from $7.05 billion to $9.12 billion. The programme assumes each desk can grow without lowering its margins and that the desks are independent. The second assumption is the one a franchise breaks.
fm_bank.mix, firm.bankdesk.optimal_mix.5.5 The client franchise
A client who finances its positions with a bank also clears, borrows and trades with it. The flow desks’ franchise (One Quant Book 1, chapter 2) is built partly on the financing desks’ balance sheet: prime services clients choose the bank that lends to them, and trade with it; the central risk book (One Quant Book 9, chapter 25) nets the flows of all of them. A desk that looks value-destroying alone may be what keeps clients in the building.
Example 5.8 (Cutting repo)
The division halves its repo desk, and prime services loses 20% of its revenue, with its costs unchanged, as some clients follow their financing elsewhere. After-tax profit falls from $7.05 billion to $6.08 billion; the equity the desks need falls from $62.1 billion to $50.1 billion (each by its binding constraint); the return on that equity rises from 11.4% to 12.1%. Whether the cut is right depends on what the freed equity earns: returned to shareholders, or given to the desks the linear programme wanted to grow.
Remark 5.9 (Why banks specialise)
Because each bank’s binding constraint differs, the same business earns different returns in different banks: a bank bound by leverage prices repo dearly and equity derivatives cheaply; a bank bound by risk-weighted assets does the reverse. The rules are the same for all large banks; their balance sheets are not, and the businesses each bank wins follow its constraints (One Quant Book 17 surveys the result).
5.6 Tutorial: six desks and three keys
Goal. Allocate a division’s equity by each constraint, compute each desk’s return, price the balance sheet, and find the best mix. End state: the table of returns and Figures 5.3 and 5.4.
- The bank.
fm_bank.jpm_requirements()reads the published figures and computes the Tier 1 each rule requires: $257.6 billion by RWA, $265.1 billion by leverage exposure. - Keys.
firm.bankdesk.allocate(DESKS, KEYS)gives each desk’s equity by RWA, leverage and stress, and the largest;roaedivides after-tax profit by each (Listing 5.1). - The charge.
fm_bank.charged_profits()deducts 0.6% of leverage exposure;breakeven_chargefinds each desk’s break-even. - The mix.
fm_bank.mix()solves the linear programme;franchise()runs Example 5.8.
What to change next. Raise the leverage requirement by the new eSLR buffer and redo the allocation; add a constraint that prime services cannot exceed repo’s size, a crude franchise link, and rerun the programme.
5.7 Build: the division’s capital model
Purpose. The capital side of a bank’s markets division: what each desk costs in equity under each rule, what it earns on it, and what the balance sheet is worth.
Interface. firm.bankdesk: Desk(name, revenue, cost, rwa, le, stress); Keys(k_rwa, k_le, tax); allocate, roae, binding; balance_sheet_charge, breakeven_charge; optimal_mix(desks, equity, keys, x_max).
Rules. Each requirement is linear in the desk’s size; the binding allocation is reported with a warning that it sums above the group’s equity (Proposition 5.5); the linear programme’s constraints are the group’s, never the desks’.
Acceptance tests. code/firm/bankdesk/tests/: equity by key and binding constraint on a two-desk example; the break-even charge zeroes profit; the optimal mix respects both constraints and favours the balance-sheet-light desk.
Stretch. A stress constraint in the programme; a blended allocation that adds to the group’s equity; FRTB capital from One Quant Book 6’s firm.frtb as the RWA input for the trading desks.
Sources and further reading
- JPMorgan Chase & Co., Form 10-K for 2025 (segment results, line-of-business equity, capital risk management).
- The Goldman Sachs Group, Inc., Form 10-K for 2025 (segment results).
- One Quant Book 6, chapters 19, 23 and 24 (hurdle rate, trading-book capital, funds-transfer pricing).
5.8 Exercises
Exercise 5.1 ★
The bank of the dated box had Tier 1 capital of $307.6 billion and total leverage exposure of $5 302.0 billion. Compute its supplementary leverage ratio and the Tier 1 its 5.0% requirement holds.
Solution
Solution of Exercise 5.1.
; the 5.0% requirement holds billion of Tier 1.
Exercise 5.2 ★
Divide the commercial and investment bank’s $27 761 million of 2025 net income by its $149.5 billion of allocated equity and compare with the reported ROE of 18%. Why may they differ?
Solution
Solution of Exercise 5.2.
. The bank’s segment ROE uses net income applicable to common equity, after the preferred dividends it allocates to the segment, which is lower than net income.
Exercise 5.3 ★
The repo desk earns $2.0 billion of revenue for $0.6 billion of costs, uses $15 billion of RWA and $400 billion of leverage exposure. Compute its after-tax return on equity by each key, at 13% and 5% and a 25% tax rate.
Solution
Solution of Exercise 5.3.
After-tax profit billion. By RWA: . By leverage: .
Exercise 5.4 ★★
At a 12% hurdle rate and a 5% leverage requirement, what is the balance-sheet charge, and at what charge does the repo desk break even?
Solution
Solution of Exercise 5.4.
a year of leverage exposure. Break-even: (35 basis points).
Exercise 5.5 ★★
Show that the desks’ own-maximum allocations add up to $62.1 billion while the group holds $55.5 billion, and explain the gap with Proposition 5.5.
Solution
Solution of Exercise 5.5.
Desk maxima: . The group needs . Equity derivatives and credit are bound by RWA while the group is bound by leverage, so their RWA equity is counted on top of a leverage requirement that already covers it.
Exercise 5.6 ★★
In Figure 5.3, which desks clear a 12% hurdle under the binding allocation, and which only under the RWA key?
Solution
Solution of Exercise 5.6.
Under the binding allocation: prime services (13.5%), equity derivatives (18.1%) and FX (28.1%). Under the RWA key only: flow rates (15.4%) and repo (53.8%).
Exercise 5.7 ★★★
Coding. Rerun fm_bank.franchise with prime services losing 40% of its revenue instead of 20%. What happens to profit and to the return on the desks’ equity?
Solution
Solution of Exercise 5.7.
Profit falls to $5.625 billion (from $7.05 billion), equity to $48.1 billion, and the return to 11.7%: most of the gain in return from cutting repo is lost once more of the prime business follows it.
Exercise 5.8 ★★★
Find the flaw. “The linear programme says repo should shrink by 89%. Let us do it this quarter.”
Solution
Solution of Exercise 5.8.
The programme assumes that the other desks can grow by half at unchanged margins and that the desks are independent; clients who finance with the bank also trade and clear with it. Cut in steps, measure the effect on prime and flow revenue, and reprice repo with a balance-sheet charge before shrinking it.
5.9 Problem: The Desk That Uses No Capital
Problem 5.1
Weekend problem — the desk that uses no capital
The head of a markets division is told that the repo desk “uses no capital” and earns 54% on it. You are asked to check.
Part I — The rules.
- Define CET1 capital, the leverage ratio and the leverage exposure measure.
- Decompose the published bank’s 11.5% CET1 requirement.
- Compute the Tier 1 its risk-based and its leverage requirements hold, and say which binds.
- What did the November 2025 rule change in the leverage buffers of the largest banks?
- How does the published bank allocate equity to its lines of business?
Part II — The desks.
- Define allocated equity and the binding capital constraint.
- Give the repo desk’s return by RWA, by leverage and by the binding constraint.
- Which desks are bound by RWA, and why?
- State and prove Proposition 5.5.
- Give the equity by RWA, by leverage and by desk-level maxima, and the division’s return on the last.
Part III — The balance sheet.
- Define a balance-sheet charge and compute it at a 12% hurdle.
- Give each desk’s after-tax profit after the charge.
- At what charge does the repo desk break even?
- What does the linear programme do with today’s equity, and what profit does it reach?
- Which two assumptions of the programme are the weakest?
Part IV — The franchise.
- What happens to profit, equity and return when repo is halved and prime services loses 20% of its revenue?
- Why may a bank bound by leverage and one bound by RWA run different businesses?
- What would you ask the prime services desk before cutting repo?
- State the named result: the repo desk’s return under the RWA and the leverage keys, and its break-even balance-sheet charge.
- In two sentences, answer the claim that repo “uses no capital”.
Solution
Solution of Problem 5.1.
- See Definitions 5.1 and 5.2.
- 4.5% minimum, 2.5% stress capital buffer, 4.5% GSIB surcharge (method 2).
- Risk-based Tier 1: billion; leverage: billion; leverage binds, narrowly.
- The static enhanced-SLR buffers were replaced by 50% of the holding company’s method 1 GSIB surcharge, capped at 1% for bank subsidiaries.
- By Standardized RWA and the GSIB surcharge, and by a simulation of capital depletion in a severe stress.
- See Definition 5.4.
- 53.8%, 5.2% and 5.2%.
- Equity derivatives and credit: their risk weights are high relative to their balance sheet.
- See Proposition 5.5.
- $35.1, 55.5 and 62.1 billion; 11.4% on $62.1 billion.
- The cost of the equity the leverage rule holds per unit of leverage exposure: a year.
- Flow rates 0.075, repo , prime services 0.45, equity derivatives 1.11, FX 0.765, credit 0.405 ($ billion).
- 0.35% of leverage exposure a year.
- It shrinks repo to about 0.11 of its size and grows the other desks to 1.5 times; profit $9.12 billion against $7.05 billion.
- That desks can grow without lowering margins, and that they are independent.
- Profit $6.08 billion (from 7.05), equity $50.1 billion (from 62.1), return 12.1% (from 11.4%).
- Their binding constraints differ, so the same business costs them different amounts of equity.
- How much of its revenue comes from clients who also finance with the repo desk, and how much of it would move with the financing.
- 53.8% by RWA, 5.2% by leverage; break-even balance-sheet charge 35 basis points of leverage exposure a year.
- It uses little risk capital and a great deal of balance sheet, and for this division the balance sheet is what binds. Priced at the cost of the equity the leverage rule holds, it does not earn its hurdle.
5.10 Interview questions
Interview question 5.1 ★ bank
What is the difference between a risk-based capital ratio and a leverage ratio, and why do regulators impose both?
Solution
Solution of Interview question 5.1.
A risk-based ratio weights exposures by risk; a leverage ratio does not. The leverage ratio is a backstop against risk weights that are too low or gamed.
What the interviewer is looking for: the backstop role and that each binds for different businesses.
Interview question 5.2 ★ bank, trader
Why is a repo desk capital-light by risk-weighted assets and heavy by leverage?
Solution
Solution of Interview question 5.2.
Repo assets are short, secured loans with low risk weights, but they are on the balance sheet at full size.
What the interviewer is looking for: risk weights against balance-sheet size.
Interview question 5.3 ★★ bank
A desk earns $1 billion after tax and uses $200 billion of leverage exposure. At a 5% leverage requirement and a 12% hurdle, does it create value?
Solution
Solution of Interview question 5.3.
Equity held billion; cost at 12% is $1.2 billion a year, more than the $1 billion it earns: it destroys value.
What the interviewer is looking for: equity from the leverage rule times the hurdle.
Interview question 5.4 ★★ bank, risk
Why can allocating each desk equity by its own binding constraint overstate the equity the group needs?
Solution
Solution of Interview question 5.4.
The sum of desk-level maxima exceeds the maximum of the sums unless one constraint binds for every desk (Proposition 5.5).
What the interviewer is looking for: .
Interview question 5.5 ★★ bank
Two banks face identical rules. Why might one of them run a large repo business and the other a large equity-derivatives business?
Solution
Solution of Interview question 5.5.
Different balance sheets make different constraints bind: a leverage-bound bank prices balance sheet high and risk low, and the reverse.
What the interviewer is looking for: the binding constraint as a competitive position.
Interview question 5.6 ★★★ bank, researcher
You are asked to set the desk mix for next year with a fixed amount of equity. What would you add to a linear programme before trusting its answer?
Solution
Solution of Interview question 5.6.
Margins that fall as a desk grows, links between desks (clients who finance and trade), the stress constraint, limits on how fast desks can grow, and the cost of shrinking a franchise.
What the interviewer is looking for: concave revenue, franchise links and adjustment costs.