The Desk and the Firm · The firm
3The Multi-Manager Platform
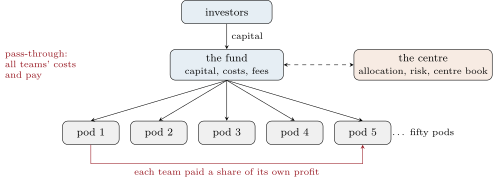
A large multi-manager platform’s regulatory brochure lists, among the expenses its funds bear, the salaries, bonuses and performance-based compensation of the portfolio managers who run its teams, their recruiters’ fees, their computers and their offices. It calls the arrangement an “expense pass-through”. It adds that a portfolio manager is paid a share of the profit of his own team, “without taking into account the performance of other Portfolio Managers or of the Millennium Partners Funds generally”, and that portfolio managers with positive performance “will receive performance-based compensation even if the Millennium Partners Funds’ overall returns are negative”. The investor pays each winning team’s bonus, including in the years the fund loses. This chapter prices that promise.
3.1 Pods, the centre and the platform’s promise
A multi-manager platform (One Quant Book 1, chapter 1) is a hedge fund run as many independent teams, each a pod (One Quant Book 8, chapter 28), under a centre that allocates capital, sets risk limits, nets and hedges the sum, and pays for the infrastructure. Its promise to investors is diversification of talent: fifty teams with modest Sharpe ratios and low correlation add up to a fund with a high one. Its promise to portfolio managers is a formulaic share of what their own team makes, paid whatever the others do.
Proposition 3.1 (Diversification of talent)
Let pods have the same volatility and Sharpe ratio and pairwise correlation , and let the fund hold them in equal weights. The fund’s Sharpe ratio is
Proof. The fund’s mean is and its variance per unit of capital split equally; divide. The limit follows as the term dominates. ∎
| fund Sharpe ratio (pods at ) | ||||
|---|---|---|---|---|
| 2.63 | 3.37 | 3.81 | 4.10 | |
| 2.29 | 2.71 | 2.91 | 3.03 | |
| 1.89 | 2.08 | 2.15 | 2.19 |
The table is the platform’s business case and its limit. Correlation, not the number of teams, sets the ceiling: at it is times a pod’s Sharpe ratio, and fifty pods already reach 2.91 of it. Past a few dozen teams, adding pods buys little unless they are less correlated with the ones already there; lowering correlation, by hiring different strategies or hedging what they share (Definition 3.8), buys more than hiring.
firm.podshop.Definition 3.2 (Pass-through fee)
A pass-through fee is a fund’s charge to its investors of the actual costs of running it, the pay of its investment teams and staff, its data, systems and offices, instead of, or in addition to, a fixed management fee out of which the manager would pay them.
Definition 3.3 (Payout rate)
A team’s payout rate is the share of its own trading profit, net of its costs and of any losses it carries forward, that is paid to the team as performance compensation.
As of September 2026 — What one platform’s brochure says
Millennium Management LLC, Form ADV Part 2A (25 August 2026): its funds “generally bear, directly or indirectly, all expenses incurred in connection with” their operation, an arrangement it calls an “expense pass-through”, including the compensation of portfolio managers and other employees, recruiters’ fees, equipment and offices; this is “separate from and in addition to” the performance- and asset-based compensation the adviser receives, and is deducted before it. A portfolio manager’s compensation is “generally determined as a percentage of profits earned by such Portfolio Manager during the preceding calendar year”; losses are carried forward; there is “generally no carryback or clawback”. The adviser allocates and reallocates capital among portfolio managers and makes direct investments of the funds’ capital, including “hedges, or contra trades that seek to establish a reduction in certain exposures” and trades that increase exposure “to netted positions held by a number of Portfolio Managers”.
3.2 Pass-through fees and the investor’s bill
The chapter’s platform (illustrative) runs 50 pods, each with a Sharpe ratio of 1.0 and a volatility of 20% a year on its share of the fund’s capital, correlated at 0.1 through one shared factor. Teams are paid 20% of their own profit, losses carried forward; a team that loses more than 10% of its capital in a year is replaced by a new one. Pods’ costs of 3% a year and the platform’s 1% pass through; the manager takes a 20% performance allocation on what is left. Over twenty simulated years and twenty seeds, a hundred dollars of capital earns this a year (Figure 3.2): $20.09 gross, of which teams receive $4.27, costs take $4.00 and the manager $2.38, leaving the investor $9.44. The fund lost money in 9 of its 400 years.
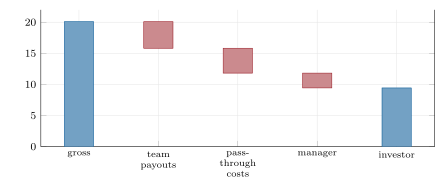
fm_platform.waterfall.A classic fund charging 2% of capital and 20% of profit on the same pods would leave its investors $14.47, charging them $5.62. It could not exist: out of $5.62 of fees its manager would have to pay the teams $4.27 and the costs $4.00, losing $2.65 on every hundred dollars. The pass-through is the fee structure a platform needs once talent and infrastructure cost more than a fixed fee can pay; the investor’s question is whether what is left after them, $9.44 here, is worth the fund’s risk.
def payouts(ann: np.ndarray, rate: float, carry: bool = True, fire: float | None = None) -> np.ndarray:
    """Each pod: rate * (profit above the losses it carries forward); carried losses are reduced by profits;
    nothing is clawed back and other pods' results do not count. carry=False pays on each year alone. With
    `fire`, a pod that loses more than `fire` in a year is replaced by a new team, whose carried loss starts at 0."""
    years, n = ann.shape
    c = np.zeros(n)
    out = np.zeros((years, n))
    for t in range(years):
        net = ann[t] - c if carry else ann[t]
        out[t] = rate * np.maximum(net, 0.0)
        c = np.maximum(-net, 0.0) if carry else c
        if fire is not None:
            c[ann[t] < -fire] = 0.0
    return out


def netting_cost(ann: np.ndarray, rate: float, carry: bool = True, fire: float | None = None) -> np.ndarray:
    """What the pods' payouts cost each year beyond rate * max(total profit, 0)."""
return payouts(ann, rate, carry, fire).sum(1) - rate * np.maximum(ann.sum(1), 0.0)3.3 Paying winners: the netting problem
Definition 3.4 (Netting risk)
A multi-manager fund’s netting risk is the cost to its investors of paying each team a share of its own profit without netting it against other teams’ losses: the difference between the sum of the teams’ payouts and the same payout rate applied to the fund’s total profit.
Proposition 3.5 (The price of paying winners)
Let a pod’s annual profit be , with Sharpe ratio , and pay a rate on each year with no loss carried forward. If the fund’s total profit is positive, the netting cost per pod is
a share of the pod’s expected profit.
Proof. for ; subtract and use . When the fund’s total is positive the payout on the total is times the sum of the ’s, whose expectation is times the sum of the . ∎
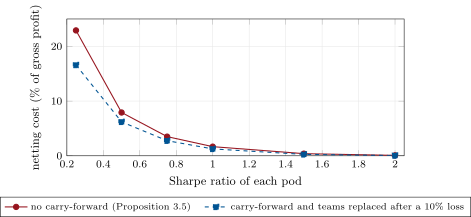
At the netting cost is 1.7% of gross profit for pods of Sharpe ratio 1, 7.9% at 0.5 and 22.9% at 0.25 (Figure 3.3). Carrying losses forward removes most of it for a team that stays: in the chapter’s platform with no team ever replaced, netting costs 0.1% of gross profit. Replacing losing teams restores it, because a replaced team’s carried loss dies with it and its successor starts at zero: with teams replaced after a 10% loss, the simulated cost is 1.3% of gross profit at a Sharpe ratio of 1 and 6.2% at 0.5, close to the formula’s bound. A platform’s netting risk is therefore set by the quality of its teams and the rate at which it turns them over, not by the payout rate alone.
fm_platform.netting_vs_sr.Example 3.6 (Two pods)
Two pods of $100 million each; one makes $10 million, the other loses $10 million. The fund’s profit is zero. At a 20% payout rate the first team receives $2 million and the second nothing: the investors pay $2 million, plus both pods’ costs, for a year in which the fund made nothing. If the losing team stays, its first $10 million of later profit earns it nothing; if it is replaced, its successor is paid from its first dollar.
3.4 Capital allocation and drawdown rules
The centre allocates capital to teams and takes it back. One Quant Book 8, chapter 28 simulated the central trade-off: a drawdown limit (defined there) stops good teams in bad luck and lets dead ones run, and its rate of false stops is set by the limit in units of the team’s own volatility. Platforms describe their rules in general terms; the specific thresholds of named firms are not in their public documents, and this book does not repeat second-hand figures. The model therefore uses an illustrative two-step ladder: a team’s capital is halved after a 10% drawdown within a year and withdrawn after 15%, and restored at the next year’s start.
Method 3.7 (Evaluating a platform’s drawdown ladder)
- Express each threshold in units of the team’s volatility on its capital (a 10% cut is half a year’s volatility at 20%).
- Simulate the platform’s pods with and without the ladder, on the same random draws.
- Report the share of team-years cut and stopped, and the fund’s return, volatility and Sharpe ratio in both cases.
- Report separately what the ladder does to dead teams (chapter 8): a ladder that improves nothing in the good-team world must earn its cost in the bad-team one.
In the chapter’s platform the ladder cuts 88.4% of team-years and stops 26.6%: with a volatility of 20%, a 10% drawdown within a year is ordinary. The fund’s return falls from 20.1% to 13.4% and its volatility from 6.9% to 4.8%; its Sharpe ratio falls from 2.92 to 2.77. Every pod in this model has a live edge, so the ladder can only cost; chapter 8 measures what it buys when some edges die.
3.5 Centre books and overlays
Definition 3.8 (Centre book, factor overlay)
A platform’s centre book is the book the centre trades itself with the fund’s capital, alongside the pods: to hedge exposures the pods share, to add to positions many pods hold, or to trade its own strategies. A factor overlay is a centre-book position that offsets the sum of the pods’ exposures to a common factor, so that the fund keeps the pods’ specific returns without their shared risk.
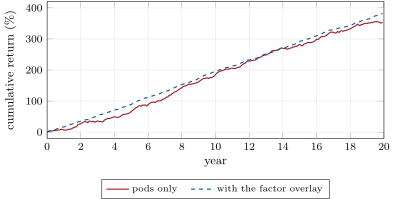
Fifty pods correlated at 0.1 give a fund whose volatility is dominated by what they share: is 6.9% for pods of 20% volatility, against 2.7% if the shared part is hedged. In the model the overlay leaves the fund’s mean return at 20.1% and lifts its Sharpe ratio from 2.9 to 7.5 (Figure 3.4). That is an upper bound: here all the shared risk is one factor the centre can trade. Real pods share crowded positions and liquidity as well as market and style factors (One Quant Book 7, chapter 28), and only the tradable part can be hedged; the brochure of the hook describes both uses of the centre’s own trades, hedging netted exposures and adding to them.
fm_platform.sim, firm.podshop.overlay.Remark 3.9 (Who owns the centre book’s P&L)
A centre book’s profit belongs to the fund, not to any team, so it earns no team payout; its costs pass through like any other. When the centre adds to positions many pods hold, it increases the concentration the pods already create, and its risk belongs in the same limits as theirs (chapter 7).
3.6 Tutorial: the investor’s bill
Goal. Price a platform’s fee structure and its netting risk. End state: Figures 3.2 and 3.3.
- Pods.
firm.podshop.pods(50, 20, 1.0, 0.20, 0.1, rng)simulates daily pod returns;annualsums them by year. - Payouts.
payouts(ann, 0.20, carry=True, fire=0.10)pays each team on its own profit (Listing 3.1). - The bill.
fm_platform.waterfall()andclassic()compare the pass-through structure with a 2-and-20 fund on the same pods. - Netting.
fm_platform.netting_vs_sr()compares the simulation with Proposition 3.5. - Ladder and overlay.
ladder_effect()andoverlay_effect().
What to change next. Keep every team forever (exercise 7); correlate the pods at 0.4 and see the overlay’s gain shrink once only part of the shared risk is a tradable factor.
3.7 Build: the platform model
Purpose. The economics of a platform in one module: payouts, pass-through, the manager’s allocation, netting risk, a drawdown ladder and a centre-book overlay.
Interface. firm.podshop: pods(n, years, sr, vol, rho, rng, days, beta), annual; payouts(ann, rate, carry, fire), netting_cost; expected_positive(mu, sigma); Terms, waterfall(ann, terms, fire), classic(ann, mgmt, perf); ladder(daily, cut, stop); overlay(daily, beta, factor).
Rules. A team’s payout never depends on another team’s result; carried losses reduce only its own later payouts; a replaced team’s carry is forgotten; the waterfall adds up exactly.
Acceptance tests. code/firm/podshop/tests/: carry-forward and no clawback on a hand example; the closed form against Monte Carlo; pods’ mean, volatility and correlation; the waterfall identity; the ladder cuts then stops; the overlay lowers fund volatility; replacement restores payouts.
Stretch. Allocate capital by trailing risk-adjusted return (firm.multistrat’s allocate); a guaranteed first-year payout for new teams; the centre book adding to the pods’ consensus positions and its effect on concentration.
Sources and further reading
- Millennium Management LLC, Form ADV Part 2A brochure, 25 August 2026 (SEC Investment Adviser Public Disclosure).
- One Quant Book 8, chapter 28 (pods, drawdown limits), and One Quant Book 7, chapter 28 (crowding).
- S. J. Grossman and Z. Zhou, “Optimal investment strategies for controlling drawdowns”, Mathematical Finance 3(3), 1993.
3.8 Exercises
Exercise 3.1 ★
A team runs $500 million of the fund’s capital and makes 12% in a year. At a payout rate of 20%, what is it paid?
Solution
Solution of Exercise 3.1.
million.
Exercise 3.2 ★
The same team lost 5% the year before and was kept. What is it paid on this year’s 12%, with losses carried forward?
Solution
Solution of Exercise 3.2.
The $25 million loss is made up first: million.
Exercise 3.3 ★
A pod’s annual profit is normal with a Sharpe ratio of 1. Compute in units of its volatility.
Solution
Solution of Exercise 3.3.
.
Exercise 3.4 ★★
In Example 3.6, each pod costs $3 million a year to run. What does the investor pay in total, and what does the fund earn for it?
Solution
Solution of Exercise 3.4.
The winning team’s $2 million plus both pods’ $6 million of costs: $8 million, for a fund profit of zero.
Exercise 3.5 ★★
Use Proposition 3.5 to compute the netting cost as a share of gross profit at a payout rate of 20% for pods of Sharpe ratio 0.5.
Solution
Solution of Exercise 3.5.
of gross profit.
Exercise 3.6 ★★
The chapter’s ladder cuts 88% of team-years. Explain why from the pods’ volatility, and propose thresholds that would cut about a quarter.
Solution
Solution of Exercise 3.6.
A 10% drawdown is half a year’s volatility for a pod at 20%, reached within a year by most pods whatever their edge. Thresholds of about one volatility, a cut at 20% and a stop at 30%, cut about 26% of team-years in the model.
Exercise 3.7 ★★★
Coding. Rerun fm_platform.waterfall(fire=None): no team is ever replaced. What do team payouts and the investor’s share become, and what is the netting cost as a share of gross profit?
Solution
Solution of Exercise 3.7.
Team payouts fall from $4.27 to $4.04 per $100 and the investor’s share rises from $9.44 to $9.63; the netting cost falls to 0.1% of gross profit. Carried losses offset later profits of the same team, so paying winners costs little when losers stay.
Exercise 3.8 ★★★
Find the flaw. “Our teams’ average Sharpe ratio is 1.5 over their track records, so netting risk costs us almost nothing.”
Solution
Solution of Exercise 3.8.
Track records are measured on survivors and in sample; the teams that will lose are the ones not yet replaced, and new teams’ Sharpe ratios are unknown. Netting risk depends on the Sharpe ratio of the pods as they will be, and on turnover: replacing losers restores it.
3.9 Problem: Paid for the Winners
Problem 3.1
Weekend problem — paid for the winners
An investor is offered a platform fund with fifty pods and a pass-through fee structure. You have its brochure and a simulator.
Part I — The structure.
- Define a pass-through fee and a payout rate.
- From the brochure, how is a portfolio manager’s compensation determined, and what happens to a team’s losses?
- What does the centre do with the fund’s capital besides allocating it to teams?
- Why can a platform’s investors pay bonuses in a year the fund loses?
Part II — The bill.
- Give the waterfall per $100 of capital: gross, team payouts, costs, manager, investor.
- In how many of the 400 simulated years did the fund lose?
- What would a 2-and-20 fund leave its investors on the same pods, and why can it not exist?
- What is the investor’s share of gross profit?
Part III — Netting.
- Define netting risk and state Proposition 3.5.
- Compute the closed-form cost for Sharpe ratios 1, 0.5 and 0.25.
- Give the simulated cost with teams replaced after a 10% loss, at Sharpe ratios 1 and 0.5.
- Give the simulated cost when no team is ever replaced, and explain the difference.
- Which two properties of a platform set its netting risk?
Part IV — The centre.
- Give the fund’s volatility and Sharpe ratio with and without the factor overlay, and explain why the gain is an upper bound.
- Give the shares of team-years cut and stopped by the ladder and its effect on return, volatility and Sharpe ratio.
- Why does the ladder only cost in this model?
- Define a centre book and say who owns its P&L.
- How should the centre book’s risk be limited?
- State the named result: the netting cost per pod in closed form, its value at Sharpe ratios 1 and 0.5, and the pass-through share of gross profit (payouts plus costs) for fifty pods.
- In two sentences, what should the investor ask the platform before investing?
Solution
Solution of Problem 3.1.
- A charge of the fund’s actual costs, team pay included, to investors; the share of a team’s own profit, net of costs and carried losses, paid to the team.
- A percentage of the team’s own profit in the preceding year, marked to market, regardless of other teams and of the fund; losses are carried forward, with generally no clawback.
- Direct investments: hedges or contra trades against shared exposures, and trades that add to netted positions held by several teams.
- Each team is paid on its own profit; winners are paid while losers’ losses fall on the fund.
- $20.09 gross; $4.27 team payouts; $4.00 costs; $2.38 manager; $9.44 investor.
- 9 of 400.
- $14.47, at $5.62 of fees; the manager would pay $8.27 of team pay and costs out of $5.62 and lose $2.65 per $100.
- 47.0%.
- The cost of paying teams on their own profit instead of on the total; per pod when the fund is profitable.
- 1.7%, 7.9% and 22.9% of gross profit.
- 1.3% and 6.2%.
- 0.1%: a team that stays must earn back its losses before it is paid again.
- The quality of its teams (their Sharpe ratios) and how often it replaces losing ones.
- Volatility 6.9% and Sharpe ratio 2.9 without; 2.7% and 7.5 with; all the shared risk is one tradable factor in the model.
- 88.4% cut and 26.6% stopped; return 20.1% to 13.4%, volatility 6.9% to 4.8%, Sharpe ratio 2.92 to 2.77.
- Every pod has a live edge, so stopping any pod only removes profit.
- The centre’s own trading with the fund’s capital; the fund owns it, no team is paid on it.
- Inside the same limits as the pods, since it can add to their concentration.
- per pod, 1.7% of gross profit at and 7.9% at ; payouts plus costs take 41.2% of gross profit.
- How often teams are replaced and how good they are, which set the netting cost; and what the centre book does and is limited by.
3.10 Interview questions
Interview question 3.1 ★ trader, researcher
What is a pass-through fee, and why do multi-manager platforms use it instead of a fixed management fee?
Solution
Solution of Interview question 3.1.
The fund’s costs, team pay included, charged at cost to investors; talent and infrastructure cost more than a fixed fee can pay.
What the interviewer is looking for: that the fee follows the cost base, and who bears it.
Interview question 3.2 ★ trader
You run a pod that lost 5% last year and made 12% this year. How is your payout computed, and what if you had been replaced?
Solution
Solution of Interview question 3.2.
Payout on 12% less the carried 5%: 7% of capital times the rate. A replaced team’s successor starts without the carry.
What the interviewer is looking for: carry-forward and its reset.
Interview question 3.3 ★★ researcher, risk
Two pods with the same Sharpe ratio: why does paying each on its own profit cost more than paying on their sum? Give the formula.
Solution
Solution of Interview question 3.3.
; with a positive total the cost is per pod.
What the interviewer is looking for: convexity of the payout and the closed form.
Interview question 3.4 ★★ risk
Fifty pods with volatility 20% each and pairwise correlation 0.1: what is the fund’s volatility, and what if the shared part were hedged?
Solution
Solution of Interview question 3.4.
; hedging the shared part leaves .
What the interviewer is looking for: the equicorrelated variance formula.
Interview question 3.5 ★★ trader
Why is a 10% drawdown cut a harsh rule for a pod with 20% volatility? What would you propose?
Solution
Solution of Interview question 3.5.
It is half a year’s volatility, reached by most pods by chance. Set thresholds in volatility units, about one volatility, and act gradually.
What the interviewer is looking for: thresholds in units of the pod’s own volatility.
Interview question 3.6 ★★★ researcher
A platform says its centre book only hedges. What in its P&L and positions would you examine to test that claim?
Solution
Solution of Interview question 3.6.
Its P&L against the pods’ summed exposures: a pure hedge has negative correlation with the pods’ shared factor P&L and little stand-alone drift; positions that grow with the pods’ consensus add to it.
What the interviewer is looking for: correlation with the netted book and position sizes.