The Industry: Firms, Roles and Careers · Careers
12Revenue and Profit across the Industry
Put every firm that files side by side and revenue per employee ranges over more than a factor of twenty. In 2025 dollars, one exchange group took in $0.48 million a head in 2023, and one London systematic investment manager $13.0 million a head in its year to January 2022. Within a firm it moves almost as much: a listed market maker’s revenue per head was 4.5 times as high in 2020, the most volatile year of the period, as in 2023, one of the quietest. The table this chapter builds is the industry’s income as the filings show it, and its gaps are part of the result: the firms that file nothing include most of the private market makers that the earlier chapters described. The chapter builds the table from sources, says what a per-head figure measures and hides, measures how revenue per head moves with the market’s volatility for each kind of firm, and names who is missing.
12.1 A sourced table of filed numbers
Definition 12.1 (Revenue per head, profit per head)
Revenue per head is a firm’s revenue for a year, after the costs that pass straight through it to others, divided by its headcount; profit per head is a stated profit line (operating profit, profit before tax, or net profit) divided by the same headcount. Both are reported with the revenue or profit line, the basis of the headcount (at the year end, or the year’s average), the currency and the price level used.
Each part of the definition is a choice that changes the answer, so the table records all of them. The revenue line is the filer’s top line after pass-through costs, because a gross line inflates the figure for firms that collect money for others. An exchange group that reports total revenues of $12 640 million for 2025 also reports transaction-based expenses of $2 709 million: $412 million of regulatory (section 31) fees it collects and passes on, and $2 297 million of cash liquidity payments, routing and clearing. Its revenue after those, $9 931 million, equals its operating expenses plus its operating income, which is how the table derives it from the tagged facts. A market maker’s revenue is taken after the brokerage, exchange and clearance fees and the financing costs that Book 16, chapter 1, calls volume-driven; a bank’s and a broker’s after interest expense (net revenues); a fund manager’s is its fees. The headcount is whatever the filing states: most US filers give a count at the year end, UK companies the year’s monthly average, one bank a figure rounded to thousands, and one European market maker full-time equivalents.
As of December 2025 — Revenue per head from filings, latest year
| filer | kind | year | revenue, m | staff | $m a head |
|---|---|---|---|---|---|
| Nasdaq | exchange | 2025 | $5 249.0 | 9 525 | 0.55 |
| Man Group | asset manager | 2025 | $1 325.0 | 1 719 | 0.77 |
| Intercontinental Exchange | exchange | 2025 | $9 931.0 | 12 844 | 0.77 |
| Morgan Stanley | bank (firm) | 2025 | $70 645.0 | 83 000 | 0.85 |
| Flow Traders | market maker | 2025 | € 485.8 | 635 | 0.86 |
| MarketAxess | venue | 2024 | $817.1 | 891 | 0.94 |
| Goldman Sachs | bank (firm) | 2025 | $58 283.0 | 47 400 | 1.23 |
| Tradeweb | venue | 2025 | $2 052.4 | 1 569 | 1.31 |
| Coinbase | crypto exchange | 2025 | $7 181.3 | 4 951 | 1.45 |
| Cboe Global Markets | exchange | 2025 | $2 429.1 | 1 661 | 1.46 |
| CME Group | exchange | 2025 | $6 520.6 | 3 875 | 1.68 |
| Interactive Brokers | broker | 2024 | $5 185.0 | 2 998 | 1.77 |
| Virtu Financial | market maker | 2025 | $2 214.9 | 1 027 | 2.16 |
| Optiver | market maker | 2025 | € 4 556.0 | ||
| Quadrature Capital | asset manager | FY25 | £1 224.8 | 173 | 9.29 |
Revenue after pass-through costs; headcount at the year end except Quadrature (average) and Optiver (a stated lower bound); FY25 is the year to January 2025. Per head in 2025 US dollars: ECB annual average rates and the US consumer price index. Every cell with its filing in data/industry/filings_perhead.csv and headcounts.csv.
The fifteen filers are the panel of this chapter, 2019 to 2025 where the filings allow: six exchanges and trading venues, three market makers, two banks as whole firms, two asset managers, one broker and one crypto exchange, with 87 firm-years in all once the years without a headcount are dropped. Nine are read from SEC company facts with firm.filings (chapter 11), two from Book 16’s derived tables, and the rest from annual reports, results releases and the UK register, transcribed with their pages.
Profit per head is harder to pool, because the natural profit line differs by kind of firm. Four examples, each on its own line: Quadrature’s operating profit was £3.22 million a head in its year to January 2025 ($4.11 million); CME Group’s operating income $1.09 million in 2025; Virtu’s income before taxes $1.07 million in 2025; Optiver’s net profit € 0.65 million in 2024 ($0.71 million), on its stated 2 100 employees.
12.2 Per head: what it measures and what it hides
Revenue per head measures how much income a firm’s people produce between them, at the firm’s own prices, in its own year. It is not pay, and it is not productivity in any sense a manager could act on. What it hides is best seen firm by firm (Figure 12.1).
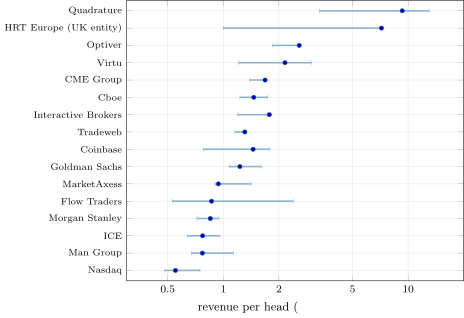
data/industry/filings_perhead.csv, through in_industry.firm_ranges.- The business model. The exchanges’ figures cluster between $0.5 million and $1.7 million a head and barely move; a market maker’s range is wide. Flow Traders’ highest year is 4.5 times its lowest, Virtu’s 2.5 times; CME Group’s 1.2 times.
- Acquisitions. Nasdaq’s headcount rose from 6 377 to 8 525 in 2023, “primarily due to our acquisition of Adenza”, and its revenue per head fell to its lowest, $0.48 million; the Intercontinental Exchange’s rose from 8 911 to 13 222 the same year. An acquisition adds people at once and revenue over the following years.
- The whole firm, not the desk. The two banks enter as whole firms, with their wealth, lending and investment banking staff. Their markets divisions publish revenue (chapter 7) but no headcount, so the division’s figure cannot be computed from filings.
- The entity, not the firm. Hudson River Trading’s UK subsidiary had 96 employees on average in 2022 and 21 in 2025, while its revenue after transaction costs rose; its revenue per head went from $1.00 million to $7.18 million. It also books service income from other group companies. Chapter 11’s pitfalls apply: the table keeps such entities out of every pooled number.
- The count. A count at the year end, an average and a full-time-equivalent count differ most when a firm grows or cuts fast; “more than 2 000” is a lower bound, so the revenue per head it gives is an upper bound.
- Currency and price level. A European firm’s euro revenue converted at the year’s average rate moves with the exchange rate; and 2019 dollars bought about a quarter more than 2025 dollars, which the deflator removes.
Example 12.2 (Normalising one cell)
Flow Traders’ net trading income for 2020 was € 933.4 million with 554 full-time equivalents at the year end: € 1.68 million a head. At 2020’s average rate of $1.1422 to the euro that is $1.92 million, and at 2025’s price level, with the consumer price index at 135.83 against 109.20, $2.39 million. The same firm’s 2023 figure, € 300.3 million over 646, becomes $0.53 million. Each step is small; together they decide whether two firms in two currencies and two years can be compared at all.
Method 12.3 (Building the industry table)
- For each filer and year, take the revenue line after pass-through costs, in the filer’s currency, with its source; derive it from tagged facts where the filer does not report it as one line.
- Take the headcount the filing states, with its basis, and a quoted phrase as evidence.
- Convert to dollars at the year’s average rate and to the base year’s price level.
- Divide; mark lower bounds and entities; never fill a missing year.
12.3 Volatility regimes: how results move with the market
The market’s volatility sets how much trading there is and how wide spreads are, and so much of the revenue of anyone who earns from trading. The chapter measures it by the yearly mean of the VIX index’s daily closes (Book 16’s table): 15.39 in 2019, 29.25 in 2020, 19.66 in 2021, 25.64 in 2022, 16.85 in 2023, 15.55 in 2024 and 18.93 in 2025. Figure 12.2 shows five filers through those years.
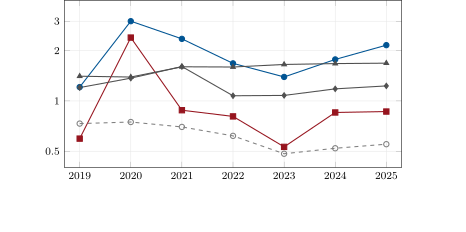
The medians by kind tell the same story with more firms behind them (whole firms only, $ million of 2025 a head):
| kind | 2019 | 2020 | 2021 | 2022 | 2023 | 2024 | 2025 |
|---|---|---|---|---|---|---|---|
| market makers | 0.90 | 2.70 | 1.62 | 1.24 | 0.96 | 1.77 | 1.51 |
| exchanges and venues | 1.31 | 1.27 | 1.23 | 1.13 | 1.05 | 1.10 | 1.31 |
| banks (whole firms) | 1.20 | 1.37 | 1.28 | 0.90 | 1.08 | 0.99 | 1.04 |
The market makers’ median tripled from 2019 to 2020 and fell back by 2023; the exchanges’ moved within a band of a quarter, and the banks’ was highest in 2020 and 2021. (Two or three firms stand behind each market-maker cell, so a median there is close to a single firm’s figure.)
The two market makers’ revenue per head in 2020 was 2.16 (Virtu) and 4.51 (Flow Traders) times their 2023 figure, while the mean VIX was 1.74 times as high. A regression puts a number on the pattern for every kind of firm at once.
Method 12.4 (Elasticity of revenue per head to volatility)
Fit, over all firm-years of whole firms with a point headcount,
where is revenue per head in constant dollars, a fixed effect for firm (its own level), the year’s mean VIX and the elasticity for firms of kind . The firm effects remove every difference of level between firms, so each is estimated from how each firm’s own figure moves across years. Report with its standard error, the number of firm-years and firms, and the share of within-firm variance explained.
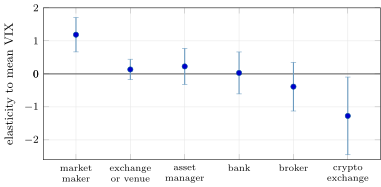
in_industry.fit.The market makers’ elasticity is 1.19 with a standard error of 0.26: a year whose mean VIX is 10% higher comes with revenue per head about 12% higher, for the same firm. For the exchanges and venues it is 0.13 (0.16), for the asset managers 0.23 (0.27) and for the banks as whole firms 0.03 (0.32): none distinguishable from zero. The broker’s is (0.37), and the crypto exchange’s (0.59), because its revenue follows the prices of crypto assets, which fell hardest in 2022, a year of high equity volatility (chapter 10). The slopes explain 30% of the variance within firms (Figure 12.3).
Remark 12.5 (What the elasticity is and is not)
Seven years are seven observations of the market; the standard errors assume independent residuals, which the shared years do not give, so they are too small if anything. The elasticity describes the filers in the panel over one period with one large volatility event, 2020. It is a description of how the kinds of firm differed, not a forecast: the next volatile year may be driven by rates or credit, where a different set of firms earns.
For a job seeker the regression has a plain reading. A market maker’s income per person, and with it the variable part of its pay (chapter 13), rises and falls with the market; an exchange’s, a venue’s or a bank’s does much less. The two asset managers, whose fees follow their funds’ assets and results, show no clear link either.
12.4 Who is missing: survivorship and disclosure bias
Definition 12.6 (Disclosure bias)
Disclosure bias is the bias in a statistic over firms that arises because the firms that publish the data differ systematically from those that do not: listed, regulated or registered where accounts are public, rather than private and registered where they are not.
The table’s high end is set by the firms that publish, and the industry’s high end by firms that do not. The largest private market makers of chapter 2 file no consolidated income statement anywhere public: their US broker-dealers file balance sheets, their UK subsidiaries file entity accounts that chapter 11 showed cannot be read as the firm’s, and press reports of their revenues are, by this book’s rule, context and never data. A reader who wants the industry’s revenue per head at the top has no filed number to use, and should say so rather than fill the cell.
Survivorship bias (Book 7, chapter 3) compounds it. The panel is built from firms that exist and file in 2025; a firm that was acquired, delisted or closed during the period leaves no row, and a firm that closed because its revenue collapsed takes its worst years with it. Both biases push in known directions: disclosure bias leaves out the most profitable private firms, so the table understates the top; survivorship leaves out the failures, so the averages flatter the survivors. What the table measures reliably is the shape of the industry’s income, kind by kind, among firms that can be checked.
12.5 Tutorial: the industry table
Goal. Build the firm-year panel from sources, normalise it, and estimate the elasticities. End state: the dated table, Figures 12.1, 12.2 and 12.3.
- Sources.
data/industry/headcounts.csvholds each headcount with its filing and a quoted phrase;revenue_manual.csvthe filers read from reports and the register. The chapter’s scriptin_panel_derive.py, run with a scratch directory, reads SEC company facts withfirm.filingsand Book 16’s tables, and writesfilings_perhead.csv; the tests read only the committed files. - Normalise.
firm.industrypnl.per_head(rows, fx, cpi, 2025)converts at the ECB annual rates of chapter 7 and deflates withdata/industry/cpi_usa.csv. Fit.
fe_fit(ph, vix)builds the design matrix of firm dummies and kind-specific slopes (Listing 12.1).def fe_fit(ph, x, kinds=None): """Least squares of log rph on firm dummies and log(x[year]) interacted with kind.""" ph = [p for p in ph if p["year"] in x and (kinds is None or p["kind"] in kinds)] firms = sorted({p["firm"] for p in ph}) ks = sorted({p["kind"] for p in ph}) n, nf, nk = len(ph), len(firms), len(ks) X = np.zeros((n, nf + nk)) y = np.empty(n) for i, p in enumerate(ph): X[i, firms.index(p["firm"])] = 1.0 X[i, nf + ks.index(p["kind"])] = math.log(x[p["year"]]) y[i] = math.log(p["rph"]) beta, *_ = np.linalg.lstsq(X, y, rcond=None) resid = y - X @ beta dof = n - nf - nk s2 = float(resid @ resid) / dof cov = s2 * np.linalg.pinv(X.T @ X) # within R^2: share of the variance left after firm means explained by the slopes dm = y.copy() for f in firms: idx = [i for i, p in enumerate(ph) if p["firm"] == f] dm[idx] -= y[idx].mean() r2 = 1.0 - float(resid @ resid) / float(dm @ dm) out = {k: (float(beta[nf + j]), float(math.sqrt(cov[nf + j, nf + j]))) for j, k in enumerate(ks)} out.update(n=n, firms=nf, dof=dof, r2_within=r2) return outListing 12.1. Firm fixed effects and one slope per kind of firm, by least squares, with classical standard errors. code/firm/industrypnl/firm_industrypnl.py - Read.
in_industry.firm_ranges,spreadandmm_ratiosgive the numbers of sections 2 and 3.
What to change next. Replace the VIX with a measure closer to each kind’s business (a bond volatility index for the venues that trade bonds, crypto prices for the crypto exchange) and compare the fits; cluster the standard errors by year.
12.6 Build: the industry panel
Purpose. One sourced firm-year panel of revenue and headcount, normalised, for this chapter and for chapter 14’s comparison of pay with revenue.
Interface. firm.industrypnl: Row; load_panel, load_fx, load_cpi; real_usd(row, fx, cpi, base); per_head(rows, fx, cpi, base); ranges(ph); ratio(ph, firm, y1, y0); fe_fit(ph, x, kinds). NumPy; wraps firm.bankmix’s rates, and the panel is built with firm.filings.
Rules. Rows without a headcount are dropped, never filled; revenue is in the filer’s currency until converted; the regression uses whole firms with point headcounts only; standard errors are classical and reported as indicative.
Acceptance tests. code/firm/industrypnl/tests/: on a panel built exactly from known slopes the fit recovers them with zero residual; with noise the estimates fall within four standard errors; conversion and deflation match hand arithmetic; a row without a headcount is not loaded.
Stretch. Standard errors clustered by year or by firm; a random-effects version; operating profit per head where the lines can be aligned.
Sources and further reading
- Forms 10-K and SEC company facts of CME Group, Intercontinental Exchange, Nasdaq, Cboe Global Markets, MarketAxess, Tradeweb, Goldman Sachs, Morgan Stanley and Interactive Brokers, 2019–2025.
- Flow Traders, Annual Reports 2019 and 2021 and results releases for 2023 and 2025.
- Hudson River Trading Europe Ltd., accounts for 2023 and 2025 (Companies House).
- OECD, consumer price indices; ECB, euro reference rates.
- Book 16’s derived tables for Virtu Financial, Man Group and the VIX; chapters 3, 10 and 11 for Optiver, Coinbase and Quadrature Capital.
12.7 Exercises
Exercise 12.1 ★
An exchange group reports total revenues of $12 640 million, operating expenses of $5 002 million and operating income of $4 929 million. What are its revenues less transaction-based expenses, and how large were those expenses?
Solution
Solution of Exercise 12.1.
Revenues less transaction-based expenses are operating expenses plus operating income, million; the transaction-based expenses are million.
Exercise 12.2 ★
From the dated table, which filers’ revenue per head was below $1 million in their latest year, and what is the ratio of the highest whole-firm figure to the lowest?
Solution
Solution of Exercise 12.2.
Nasdaq ($0.55 million), Man Group and the Intercontinental Exchange ($0.77 million each), Morgan Stanley ($0.85 million), Flow Traders ($0.86 million) and MarketAxess ($0.94 million). The highest whole-firm figure, Quadrature’s $9.29 million, is 16.9 times Nasdaq’s.
Exercise 12.3 ★
Compute CME Group’s operating income per head in 2025 and Optiver’s net profit per head in 2024 in euros.
Solution
Solution of Exercise 12.3.
CME Group: million. Optiver: million.
Exercise 12.4 ★★
Nasdaq’s revenue per head fell to its lowest in 2023. Using its 10-K, give the explanation that is not about the market.
Solution
Solution of Exercise 12.4.
Its headcount rose from 6 377 to 8 525 during 2023, “primarily due to our acquisition of Adenza”: the acquired staff count in full at the year end while the acquired revenue arrives over the following years.
Exercise 12.5 ★★
With an elasticity of 1.19, by how much should a market maker’s revenue per head change from a year with a mean VIX of 16.85 to one of 29.25? Compare with Virtu’s and Flow Traders’ actual ratios.
Solution
Solution of Exercise 12.5.
: revenue per head about 92% higher. Virtu’s actual ratio was 2.16 and Flow Traders’ 4.51: the fitted elasticity averages two firms whose sensitivity differs, and a year’s mean VIX is one of several things that set a market maker’s revenue.
Exercise 12.6 ★★
Why is Hudson River Trading’s UK subsidiary kept out of the regression, although its figures are sourced?
Solution
Solution of Exercise 12.6.
It is a subsidiary whose revenue includes service income set by the group’s transfer pricing and whose headcount fell from 96 to 21 as work moved elsewhere in the group: its revenue per head ($1.00 million to $7.18 million) describes the entity’s accounts, not the firm’s people.
Exercise 12.7 ★★★
Coding. Refit the regression without the crypto exchange and the broker. How do the market makers’ and the exchanges’ elasticities and standard errors change, and why so little?
Solution
Solution of Exercise 12.7.
The market makers’ elasticity stays 1.19 and the exchanges’ 0.13; their standard errors change only in the third decimal. With firm effects and one slope per kind, each kind’s slope is estimated from its own firms’ variation; the other kinds enter only through the pooled residual variance.
Exercise 12.8 ★★★
Find the flaw. “Filed numbers show that the industry’s revenue per head peaks at about $13 million, at a systematic investment manager; market makers are well below that.”
Solution
Solution of Exercise 12.8.
The table’s top is the top of those who file, not of the industry: the largest private market makers publish no consolidated income, so disclosure bias removes them. The $13 million is also a different line (a fund manager’s fees) from a market maker’s net trading revenue, and it comes from 98 people in one exceptional year.
12.8 Problem: The Good Year
Problem 12.1
Weekend problem — the good year
Two offers: one from a listed market maker, one from an exchange group. A friend says the market maker “has good years”. How good, and how often?
Part I — The table.
- Define revenue per head and profit per head, and list what must be reported with them.
- Why use revenue after pass-through costs? Give the exchange group’s example.
- Name the bases on which filers state headcount and how each biases revenue per head.
- How are figures in euros and pounds, and from different years, made comparable?
- How many firms and firm-years are in the panel, and where do they come from?
Part II — What it hides.
- Give the lowest and highest whole-firm revenue per head, with firm and year.
- Give the ratio of highest to lowest year for Flow Traders, Virtu and CME Group.
- Explain Nasdaq’s and the Intercontinental Exchange’s figures in 2023.
- Why can a bank’s markets division not be placed in the table?
- What happened to the UK subsidiary’s revenue per head from 2022 to 2025, and why is it not the firm’s?
Part III — The regimes.
- Give the yearly mean VIX for 2019–2025.
- Write the regression and say what the firm effects do.
- Give each kind’s elasticity and standard error.
- Why is the crypto exchange’s elasticity negative?
- Give the market makers’ 2020 to 2023 ratios of revenue per head.
Part IV — The verdict.
- State the named result: the elasticity of revenue per head to the mean VIX by kind of firm with standard errors, and the range of the 2020 to 2023 ratio across the market makers.
- Why are the standard errors optimistic?
- Define disclosure bias and say which way it pushes the table’s top.
- How does survivorship bias push the averages?
- In two sentences, answer the friend.
Solution
Solution of Problem 12.1.
- Revenue (after pass-through costs) or a stated profit line, divided by headcount; with the line, the headcount’s basis, the currency and the price level.
- A gross line counts money collected for others; the exchange group’s total revenues of $12 640 million include $2 709 million of transaction-based expenses, leaving $9 931 million.
- Year end, average, full-time equivalents, rounded thousands, stated lower bounds; year-end counts overstate the denominator for a growing firm, and a lower bound gives an upper bound per head.
- ECB annual average rates to dollars, then the US consumer price index to 2025 dollars.
- Fifteen whole firms (plus one UK entity shown apart), 87 firm-years, from SEC company facts, Book 16’s tables, annual reports, results releases and the UK register.
- Lowest: Nasdaq, $0.48 million in 2023. Highest: Quadrature, $13.0 million in its year to January 2022.
- Flow Traders 4.5, Virtu 2.5, CME Group 1.2.
- Acquisitions: Nasdaq’s headcount rose from 6 377 to 8 525 with Adenza; the Intercontinental Exchange’s from 8 911 to 13 222.
- Banks file markets revenue but no division headcount.
- It rose from $1.00 million to $7.18 million as its average headcount fell from 96 to 21; its revenue is set within the group.
- 15.39, 29.25, 19.66, 25.64, 16.85, 15.55, 18.93.
- ; the firm effects remove each firm’s level, so the slopes come from movements within firms.
- Market makers 1.19 (0.26); exchanges and venues 0.13 (0.16); asset managers 0.23 (0.27); banks 0.03 (0.32); broker (0.37); crypto exchange (0.59).
- Its revenue follows crypto prices, which fell hardest in 2022, a year of high equity volatility.
- Virtu 2.16, Flow Traders 4.51.
- Market makers 1.19 (0.26), exchanges and venues 0.13 (0.16), asset managers 0.23 (0.27), banks 0.03 (0.32), broker (0.37), crypto exchange (0.59); the 2020/2023 ratio of revenue per head ranges from 2.16 to 4.51 across the market makers.
- The residuals share years and are not independent; seven years hold one large volatility event.
- The bias from the publishing firms differing from those that do not; it leaves out the most profitable private firms, so it understates the top.
- Upward: firms that failed leave with their bad years.
- Yes, the market maker has good years: its revenue per person roughly doubled or more from 2023 to 2020, and it moves with the market far more than an exchange’s. The exchange’s is steadier and the market maker’s variable pay will be too (chapter 13).
12.9 Interview questions
Interview question 12.1 ★ trader
Why does a market maker earn more in a volatile year? Give two mechanisms.
Solution
Solution of Interview question 12.1.
More volume (more trades to earn a spread on) and wider spreads (more earned per trade, as inventory risk rises); also more dislocations between related instruments.
What the interviewer is looking for: volume and spread, with the inventory-risk reason for the spread.
Interview question 12.2 ★ bank, risk
An exchange reports total revenues and revenues less transaction-based expenses. Which do you use to compare it with a bank, and why?
Solution
Solution of Interview question 12.2.
Revenues less transaction-based expenses, because the rest is collected for others (regulatory fees) or paid back to liquidity providers; a bank’s net revenues are likewise after interest expense.
What the interviewer is looking for: netting pass-through costs before comparing.
Interview question 12.3 ★★ researcher
You regress log revenue per head on log VIX with firm fixed effects over seven years. What does the fixed effect remove, and what would a year fixed effect do to your slope?
Solution
Solution of Interview question 12.3.
The firm effect removes each firm’s permanent level, so the slope comes from within-firm movement. A year effect would absorb every common year shock, including the VIX itself, which varies only by year: the slope would no longer be identified, except as differences between kinds.
What the interviewer is looking for: identification: a year-level regressor cannot coexist with year effects.
Interview question 12.4 ★★ researcher, mle
Your panel has fifteen firms and seven years. How would you compute honest standard errors?
Solution
Solution of Interview question 12.4.
Cluster by year (the shock is common), but seven clusters are too few for the usual formula; use a wild bootstrap by year, or report the range of slopes firm by firm.
What the interviewer is looking for: few clusters, and a method that respects them.
Interview question 12.5 ★★ developer, mle
Design the storage for a panel whose every cell must carry its source and whose sources restate. What are the keys?
Solution
Solution of Interview question 12.5.
Key each fact by (filer, concept, period start, period end, filing); keep every filing’s value so restatements are new rows; a view picks the latest filing per period. Store the unit and currency with the value.
What the interviewer is looking for: bitemporal keys: period and filing.
Interview question 12.6 ★★★ researcher, trader
The largest market makers do not publish. How would you estimate their revenue per head, and what would you refuse to conclude?
Solution
Solution of Interview question 12.6.
From public pieces only: headcount from their own statements (as ranges), revenue ranges from the listed peers’ revenue per head scaled by any public activity measure, stated as a range with its assumptions. I would refuse to present it as a number, to rank firms by it, or to use press figures as data.
What the interviewer is looking for: ranges, stated assumptions, and refusing false precision.