The Industry: Firms, Roles and Careers · Careers
9Exchanges, Brokers, Vendors and Regulators as Employers
Listed exchange groups publish what private trading firms do not: their revenue, their operating income and the number of people they employ, every year. In 2025 the four largest US groups employed between 1 661 and 12 844 people each and earned between $0.24 million and $1.09 million of operating income per employee. The market’s regulator publishes even more: the pay band of every grade of its staff and the supplement for each city, up to a cap of $292 300 in 2026. The rest of the ecosystem — exchanges, clearing houses, brokers, data and technology vendors, regulators — is the most transparent part of the industry to work in, and the one whose jobs are closest to engineering and public service. This chapter describes it as an employer.
9.1 Exchange groups and clearing houses
Definition 9.1 (Financial market infrastructure)
A financial market infrastructure is a multilateral system among its participants for clearing, settling or recording payments, securities, derivatives or other transactions: a systemically important payment system, a central securities depository, a securities settlement system, a central counterparty or a trade repository. Exchanges and trading venues are the markets these systems serve and are often owned by the same groups.
An exchange group sells trading, clearing, data, index licences and connectivity (Book 1, chapter 4; Book 14). It is a technology company regulated as a utility: its engineers build and run matching engines, market-data systems and clearing platforms (Book 10, chapter 27, builds a simulator of one); its quants design margin models, index methodologies and surveillance; its product staff design contracts and fee schedules. The work is on the other side of the trading firms’ problems: the latency they race for is the latency an exchange engineer measures and makes fair.
As of December 2025 — Four exchange groups in their filings
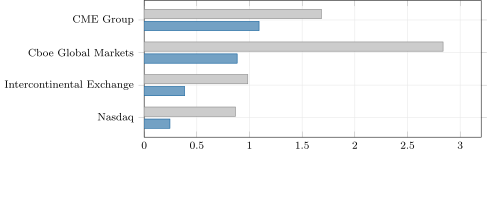
| group (10-K 2025) | revenue, $m | op. income, $m | staff | revenue/head | op. income/head |
|---|---|---|---|---|---|
| CME Group | 6 520.6 | 4 229.5 | about 3 875 | $1.68m | $1.09m |
| Cboe Global Markets | 4 714.2 | 1 467.1 | 1 661 | $2.84m | $0.88m |
| Intercontinental Exchange | 12 640 | 4 929 | 12 844 | $0.98m | $0.38m |
| Nasdaq | 8 262 | 2 331 | 9 525 | $0.87m | $0.24m |
Revenue is each group’s total revenue as reported, which for three of them includes transaction-based expenses (rebates and fees passed through to participants); operating income is after them. Two of the groups report segments outside trading: one reports exchanges, fixed income and data services, and mortgage technology; another capital access platforms, financial technology and market services.
The four differ more in operating income per head than in anything else (Figure 9.1): the group whose revenue is mostly derivatives trading and clearing earns $1.09 million per employee, 4.5 times the group that reports a financial-technology segment. Revenue per head is less comparable, because pass-through fees inflate the revenue of groups that pay rebates. For an employee the difference is the business: a derivatives exchange employs people close to trading and clearing, a diversified group many more in software, data and services.
in_infra.exchanges.9.2 Brokers and trading-technology vendors
Brokers sell access and execution: agency brokers route and work orders (Book 10, chapter 20), prime brokers finance and custody (Book 1, chapter 6), clearing brokers stand between their clients and the clearing houses (Book 1, chapter 30). Trading-technology vendors sell the systems that firms do not build themselves: order and execution management systems, market-data feeds and ticker plants, risk and compliance software, connectivity (Book 14, chapter 27, maps them). For a quant or an engineer these employers offer the same technical problems as a trading firm — latency, correctness, scale — with the firm’s customers’ P&L instead of its own at stake, and pay that follows a software company’s economics: salaries and equity rather than a share of trading profit.
9.3 Data vendors
Market-data vendors collect, normalise, store and redistribute data: exchange feeds, reference data, prices of instruments that trade over the counter, alternative data (Book 7, chapter 12). Their quantitative jobs are in data quality, evaluated pricing (models that price bonds and derivatives that did not trade), index construction and analytics. Their engineering jobs are those of a large-scale data platform (Book 15). The work is closest to what a research platform team does inside a trading firm, but for many clients at once.
9.4 Regulators and central banks
Regulators employ economists, quantitative analysts, examiners, lawyers and technologists. Their market-structure and surveillance teams use the methods of this series on the market as a whole: the race study of chapter 2 is regulators’ research, and surveillance uses the detectors of Book 9 (chapter 29) on the consolidated audit trail. Central banks employ quants in market operations, reserve management and financial-stability analysis. The pay is public.
Definition 9.2 (Pay band)
A pay band is the published range of basic pay for a grade of an employer’s pay scale, from a minimum to a maximum; a public employer’s scale also publishes the supplements (for example, by city) that apply to it and any cap on total pay.
As of April 2026 — One regulator’s pay scale
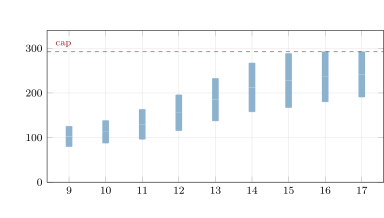
The SEC’s 2026 basic pay for its SK scale, effective 5 April 2026, runs from $24 728–$36 213 at grade 1 to $138 383–$239 449 at grade 17 (supervisory). Selected grades: SK-12 $83 718–$141 843; SK-13 $99 557–$168 668; SK-14 $114 315–$193 670; SK-16 $130 550–$221 711. Locality rates apply to basic pay by duty station: New York 37.95%, San Francisco 46.34%, Washington DC 33.94%, Chicago 30.86%. “The salary cap, including locality pay, is $292 300 for all SK staff.”
Method 9.3 (A public band as an annual range)
- Take the grade’s minimum and maximum of basic pay.
- Multiply both by one plus the duty station’s locality rate.
- Cap each end at the scale’s cap.
- Compare the resulting range with the range another source gives for the same occupation (chapter 14), by the share of the other range the band covers.
In New York, an SK-14 position pays $157 698 to $267 168; an SK-16 position $180 094 to $292 300, the upper end capped (Figure 9.2). The bands are wide — the top of a grade is about 1.7 times its bottom — because they cover a career’s progression within a grade, and a new hire is usually placed near the bottom. The cap binds the top grades: from SK-16 up, the upper end in New York is the cap, not the grade.
firm.payband.at.9.5 What the infrastructure offers in the filings
The four exchange groups also file labour condition applications (chapter 14), and their offers can be set beside the banks’ and the market makers’, and beside the regulator’s band.
As of September 2025 — Exchange groups in the filings
Fiscal 2025 labour condition applications, median offered base: exchange groups, all titles $130 800 (462 applications, 4 employers), software $140 400 (329), quantitative research $107 100 (35), machine learning and data $108 500 (60); banks $154 260, $155 688, $158 100 and $140 714; market makers $175 000 in each of the four. Base salary only.
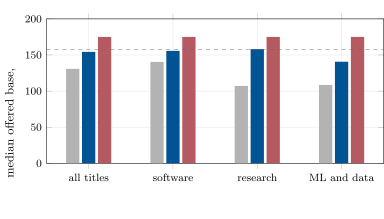
data/industry/lca_ranges.csv, through in_infra.filings.The exchanges’ offers sit below the banks’ in every family, and well below the market makers’ (Figure 9.3): $130 800 against $154 260 and $175 000 for all titles; for research, $107 100 against $158 100 and $175 000. The regulator’s band sits between: an SK-14 position in New York starts at $157 698 and runs to $267 168, above the exchanges’ median offers and in the range of the banks’. None of these counts bonus, which is larger at the trading firms (chapter 14); the public band is the whole of the regulator’s pay.
9.6 Moving between the sides
People move between the industry and its infrastructure in both directions: engineers from exchanges to trading firms and back, quants from regulators to banks and from banks to regulators, market-structure economists from venues to regulators. Moves out of a regulator are subject to the post-employment rules of public service, and moves into one to conflict-of-interest rules; both are the employer’s rules, set out in its own codes. For a career, the infrastructure is where one learns how the market works from the inside — its plumbing, its rules and its data — at pay that is published and more stable, and usually lower at the top than the trading firms’ (chapter 14).
9.7 Tutorial: revenue per head at the infrastructure
Goal. Compute exchange groups’ revenue and operating income per head from their filings, and turn a regulator’s published scale into annual ranges. End state: Figures 9.1 and 9.2.
- The filings.
data/industry/infrastructure_employers.csvholds each group’s total revenue and operating income (from SEC XBRL company facts where tagged, else the income statement) and its year-end employees (from the 10-K text);in_infra.exchanges()computes the per-head measures and the operating margin. The scale.
firm.payband.load_scalereads the SK grades, the locality rates and the cap;firm.payband.at(scale, grade, station)returns the annual range (Listing 9.1).def at(scale, grade, station): b = scale.bands[str(grade)] k = 1 + scale.locality[station] lo, hi = b.lo * k, b.hi * k if scale.cap is not None: lo, hi = min(lo, scale.cap), min(hi, scale.cap) return lo, hi def overlap(a, b): lo, hi = max(a[0], b[0]), min(a[1], b[1]) return max(hi - lo, 0.0) / (b[1] - b[0])Listing 9.1. A grade’s annual range at a duty station, and the overlap of two ranges. code/firm/payband/firm_payband.py - Compare.
firm.payband.overlap(a, b)gives the share of a range that a band covers, for chapter 14’s comparison with labour-condition filings.
What to change next. Compute each group’s revenue per head net of transaction-based expenses where the 10-K reports it (exercise 7); tabulate the SK bands for Chicago and Washington and compare.
9.8 Build: public pay scales
Purpose. Read published public-sector pay scales as annual ranges, so that chapter 14 can set them beside the private-sector ranges of labour-condition filings and chapter 24 beside control functions’ pay.
Interface. firm.payband: Band(grade, lo, hi), Scale(name, bands, locality, cap); load_scale(name, bands_csv, locality_csv, cap); at(scale, grade, station); overlap(a, b).
Rules. Locality applies to basic pay; the cap applies to the total, at each end of the range; an unknown station or grade is an error.
Acceptance tests. code/firm/payband/tests/: locality and cap on a constructed scale; overlap of disjoint and overlapping ranges; loading from CSV.
Stretch. Step tables within a grade (pay by years of service); several scales in one currency for cross-country comparison (chapter 27).
Sources and further reading
- Forms 10-K for 2025 of CME Group, Intercontinental Exchange, Nasdaq and Cboe Global Markets; SEC XBRL company facts.
- SEC, Compensation overview (2026 SK pay scale and locality rates).
- CPMI-IOSCO, Principles for financial market infrastructures (2012), BIS publication page.
9.9 Exercises
Exercise 9.1 ★
Compute each exchange group’s operating margin in 2025.
Solution
Solution of Exercise 9.1.
CME Group ; Cboe ; ICE ; Nasdaq .
Exercise 9.2 ★
Compute the New York range of an SK-13 position, and its ratio of top to bottom.
Solution
Solution of Exercise 9.2.
to ; ratio 1.69.
Exercise 9.3 ★
Which grades’ New York upper end is set by the cap rather than the grade?
Solution
Solution of Exercise 9.3.
SK-16 and SK-17: their maxima times 1.3795 exceed $292 300 (SK-15’s is $288 543, below it).
Exercise 9.4 ★★
Why is revenue per head a poorer comparison across the four exchange groups than operating income per head?
Solution
Solution of Exercise 9.4.
Three groups’ revenue includes rebates and fees passed through to participants, in different proportions, so revenue per head mixes pass-through with value added; operating income is after those costs.
Exercise 9.5 ★★
An SK-14 position in Chicago and one in New York: compute both ranges and the difference in their midpoints.
Solution
Solution of Exercise 9.5.
Chicago $149 593–$253 437, midpoint $201 515; New York $157 698–$267 168, midpoint $212 433; difference $10 918.
Exercise 9.6 ★★
From Figure 9.1, which group has the widest gap between revenue and operating income per head, and what might explain it?
Solution
Solution of Exercise 9.6.
Cboe: $2.84 million of revenue per head against $0.88 million of operating income. Much of its revenue is passed back as rebates and fees (its cost of revenue), and its headcount is small for its volume.
Exercise 9.7 ★★★
Coding. Nasdaq reports total revenues less transaction-based expenses of $5 249 million. Recompute its revenue per head on that basis and its operating margin on it. How much of the gap in operating margin with the derivatives exchange closes?
Solution
Solution of Exercise 9.7.
million per head; margin . The margin gap with CME Group (64.9%) falls from 36.7 to 20.5 percentage points: about 16 points of it were pass-through.
Exercise 9.8 ★★★
Find the flaw. “An SK-16 examiner in New York earns $292 300 and a quant at a trading firm earns less than that in base salary, so the regulator pays more.”
Solution
Solution of Exercise 9.8.
$292 300 is the cap, the most any SK employee in any grade can earn in basic plus locality pay, not a typical salary; SK-16 in New York runs from $180 094 to the cap, and hires start near the bottom. A trading firm’s base salary is part of its pay; the comparison needs total pay at the same seniority (chapter 14).
9.10 Problem: Revenue per Head at the Infrastructure
Problem 9.1
Weekend problem — revenue per head at the infrastructure
An engineer with offers from an exchange group and a regulator wants to understand both employers from their public numbers.
Part I — The infrastructure.
- Define a financial market infrastructure and list its five kinds.
- What does an exchange group sell, and which quant and engineering jobs does it employ?
- Give the four groups’ employees in 2025.
- Give their revenue and operating income per head.
- What inflates the revenue of three of them, and how?
Part II — The comparison.
- Give the four operating margins.
- How many times the lowest is the highest operating income per head?
- Which segments outside trading do two of the groups report?
- What does a broker sell, and a data vendor?
- What distinguishes a trading-technology vendor’s pay from a trading firm’s?
Part III — The regulator.
- Define a pay band.
- State the method that turns a band into an annual range.
- Give the New York ranges of SK-12, SK-14 and SK-16.
- Which grades are capped in New York, and at what?
- Why are the bands so wide, and where is a new hire placed?
Part IV — The verdict.
- State the named result: the range of operating income per head across the four groups, and the New York range of an SK-14 position.
- What rules govern moves out of and into a regulator?
- What does the infrastructure teach that a trading firm does not?
- Where does chapter 14 compare these bands with private pay?
- In two sentences, how should the engineer compare the two offers?
Solution
Solution of Problem 9.1.
- A multilateral system for clearing, settling or recording transactions: payment systems, central securities depositories, securities settlement systems, central counterparties, trade repositories.
- Trading, clearing, data, index licences and connectivity; engineers for matching, data and clearing systems; quants for margin, index and surveillance models.
- About 3 875; 1 661; 12 844; 9 525.
- CME Group $1.68m and $1.09m; Cboe $2.84m and $0.88m; ICE $0.98m and $0.38m; Nasdaq $0.87m and $0.24m.
- Transaction-based expenses (rebates and fees paid to participants) counted in revenue and deducted below.
- 64.9%, 31.1%, 39.0%, 28.2%.
- times.
- Fixed income and data services and mortgage technology; capital access platforms and financial technology.
- Access, execution, financing and clearing; collected, cleaned and redistributed data and evaluated prices.
- Salaries and equity, following a software company’s economics, not a share of trading profit.
- A published range of basic pay for a grade, with supplements and any cap.
- Grade minimum and maximum, times one plus the locality rate, each capped; compare by overlap.
- $115 489–$195 672; $157 698–$267 168; $180 094–$292 300.
- SK-16 and SK-17, at $292 300.
- They cover progression within a grade; new hires are placed near the bottom.
- Operating income per head $0.24 to $1.09 million; SK-14 in New York $157 698 to $267 168.
- The employer’s post-employment and conflict-of-interest rules, set out in its own codes.
- The market’s plumbing, rules and consolidated data, from the inside.
- Chapter 14, against labour-condition filings for the same occupations.
- Compare the work (engineering for a market against for a regulator) and pay at the same seniority, reading the exchange’s pay from filings and the regulator’s from its band; the regulator’s is published and capped, the exchange’s includes equity.
9.11 Interview questions
Interview question 9.1 ★ developer
What does an exchange’s matching-engine team worry about that a trading firm’s strategy engineers do not?
Solution
Solution of Interview question 9.1.
Fairness and determinism: every participant’s order processed in the stated priority, identical behaviour under load, no lost or duplicated messages, recovery without disadvantaging anyone, and regulatory audit. A trading firm cares about its own speed and P&L.
What the interviewer is looking for: the venue’s obligations, not its speed.
Interview question 9.2 ★ risk
What does a clearing house’s margin model have to do, and who bears the risk if it is wrong?
Solution
Solution of Interview question 9.2.
Set margins that cover a defaulting member’s potential loss over the close-out period at a high confidence, and size the default fund for extreme but plausible losses; if it is wrong, the default waterfall spreads losses to surviving members’ contributions and the clearing house’s capital (Book 1, chapter 5).
What the interviewer is looking for: coverage, close-out period, and the waterfall.
Interview question 9.3 ★★ developer
An exchange wants every participant in a colocation hall to receive market data at the same time. How would you design and test that?
Solution
Solution of Interview question 9.3.
Equal-length cross-connects or delay equalisation to a common point, hardware timestamps at the hand-off, and continuous measurement of the spread of arrival times across ports, published or audited; test with synchronised captures on every port (Book 14).
What the interviewer is looking for: physical equalisation and measurement.
Interview question 9.4 ★★ researcher
A regulator asks you to estimate how much of a market’s volume is in latency races. What data do you need, and what is the first thing you measure?
Solution
Solution of Interview question 9.4.
Message-level data with timestamps for every order, cancel and failure, including failed orders; first measure races: groups of messages from different firms targeting the same quote within a short window after a price move.
What the interviewer is looking for: message data including failures, and a definition of a race.
Interview question 9.5 ★★ researcher
A data vendor prices a corporate bond that has not traded for three weeks. How, and how do you know the price is good?
Solution
Solution of Interview question 9.5.
From comparable bonds’ trades and quotes (issuer curve, sector spreads, rating), adjusted for maturity and liquidity; check against later trades (back-testing the evaluated price) and dealers’ quotes.
What the interviewer is looking for: a model from comparables, and out-of-sample checks.
Interview question 9.6 ★★★ risk, developer
An exchange pays rebates to liquidity providers and reports them as transaction-based expenses. How do rebates change the meaning of its revenue, and how would you compare two exchanges fairly?
Solution
Solution of Interview question 9.6.
Rebates paid to liquidity providers are a cost of generating volume: gross revenue overstates what the exchange keeps. Compare revenue net of transaction-based expenses, operating margins, and revenue per contract or share traded.
What the interviewer is looking for: net revenue and unit economics.