The Industry: Firms, Roles and Careers · Careers
29Education Pipelines
In the year to June 2024 US universities awarded 4 584 master’s degrees coded as financial mathematics and 870 coded as financial analytics, a code that did not exist before 2020. In 2010 the first code counted 305 master’s degrees. The same year’s completions survey counts 25 543 master’s degrees in computer science and 1 760 research doctorates in physics, and the industry hires from all of them. This chapter counts the degrees that feed the industry, reads two specialised programmes’ placement reports for what they say and do not say, and looks at doctorates, competitions and learning outside a programme.
29.1 Degrees that feed each kind of firm
Definition 29.1 (Classification of Instructional Programs)
The Classification of Instructional Programs (CIP) is the US taxonomy of fields of study, with six-digit codes and definitions, revised every ten years; institutions report their awards to the federal completions survey by CIP code and award level.
The federal completions survey counts awards, not people or curricula: each programme chooses its code. The code for financial mathematics, unchanged since the 2010 classification, is defined as “the application of mathematics and statistics to the finance industry, including the development, critique, and use of various financial models”; the 2020 revision added financial analytics, “financial big data modeling”. Neither code covers every financial engineering programme, and some of the growth in the first may reflect programmes adopting it; the counts are therefore a floor on specialised financial degrees, and a guide to the trend.
As of June 2024 — US degrees in the industry’s fields
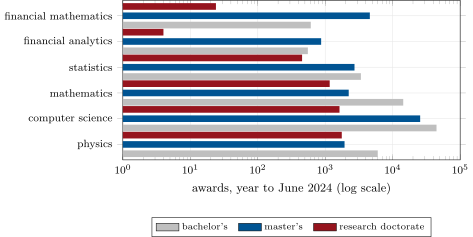
Awards to first majors in the year to June 2024 (IPEDS): financial mathematics 611 bachelor’s, 4 584 master’s, 24 research doctorates; financial analytics 553, 870, 4; statistics 3 379, 2 716, 454; mathematics 14 333, 2 230, 1 165; computer science 44 627, 25 543, 1 628; physics 6 008, 1 934, 1 760. Master’s degrees in financial mathematics: 305 in 2010, 773 in 2014, 3 554 in 2019.
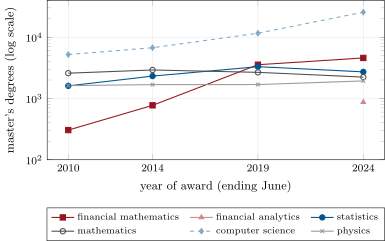
data/industry/ipeds_completions.csv, through in_edu.completions.Different firms draw on different degrees. Research roles (chapter 17) draw on doctorates and master’s degrees in mathematics, statistics, physics and computer science; engineering roles (chapters 19 and 20) on computer science at every level; bank quant roles (chapter 18) and structuring (chapter 23) on the specialised financial master’s degrees as well as on doctorates. The specialised degrees are small beside the general ones (Figure 29.1): financial mathematics’ master’s degrees were less than a fifth of computer science’s in 2024.
29.2 The specialised master’s programmes: size, cost and placement
Definition 29.2 (Placement report)
A placement report is a degree programme’s own account of what its graduates did after the degree: how many sought work, how many accepted offers by a given date, where, and the pay reported by those who reported it, under a reporting standard the programme chooses or none.
A placement report is evidence from an interested party, and one programme says so itself: “There is no common standard for reporting placement information among professional financial engineering master’s programs, and the reports of such programs are not audited.” The reader’s questions are the denominators: of how many students, how many sought work, how many accepted offers, and how many reported pay.
As of January 2026 — Two placement reports
UC Berkeley Master of Financial Engineering, class of 2025: 70 students looking for jobs, 67 accepted offers; median base salary $150 000; the report does not say how many reported pay. Carnegie Mellon MS in Computational Finance, class of 2026 (graduated December 2025): 99 students, 98 seeking work, 98 with accepted offers within three months, counting short-term employment under its reporting standard; median base salary $145 000 from 89 students reporting.
Method 29.3 (What a median from part of a cohort can say)
If of graduates report pay, the median of all lies between the reported distribution’s quantiles and , whatever the non-reporters earn: all below the reporters at one extreme, all above at the other.
For the second report, 89 of 98 reported: the median of all 98 lies between the reported pay’s 44.9th and 55.1st percentiles, a narrow range. For the first, the number reporting is not stated, and no such bound is possible. Neither report says what non-reporters earned or why they did not report, and a rate of 96% or 100% “placed” depends on what counts as a job and by when. Cost and length of study belong in the same comparison.
29.3 Doctorates and the academic route
The US awarded 1 760 research doctorates in physics, 1 628 in computer science, 1 165 in mathematics and 454 in statistics in the year to June 2024 (Figure 29.2), together about as many as the master’s degrees in financial mathematics. Doctorates enter research roles at a level above new graduates (chapter 28), often after an internship during the degree. The academic route runs in the other direction too: researchers leave the industry for faculty positions, and faculty consult for or join firms; neither flow is counted by any public source this book found.
data/industry/ipeds_completions.csv, through in_edu.completions.29.4 Competitions and what they signal
Firms that hire quantitative graduates read competition results as evidence of problem-solving under time pressure. The best known is the International Mathematical Olympiad, for students “Under 20 years old and not enrolled in post-secondary education”: national teams of up to six, “2 days, 3 problems per day, 4.5 hours each day”, each problem worth 7 points. University programming and mathematics competitions play a similar role later. What a result signals is narrow: speed and depth on well-posed problems. Research asks for problems no one has posed, data that lie, and patience over months; Book 18 discusses how interviews try to measure both.
29.5 Learning outside a programme
Much of what the industry uses is learnt outside a degree: programming in production, statistics on real data, the markets themselves. The routes are open: textbooks and open courses, open-source libraries (chapter 20’s public engineering), data competitions, and the running project of this series, whose code accompanies every book. A candidate without a specialised degree shows the same evidence a programme would: work that can be read and rerun.
29.6 Tutorial: how many quants does the world train?
Goal. Count the US degrees in the industry’s fields, read two placement reports for their response, and put the specialised degrees beside the filings of chapter 14. End state: Figures 29.1 and 29.2 and the placement bounds.
Completions.
firm.edupipe.read_ipedsstreams one year’s zip and totals first-major awards by code and level (Listing 29.1);in_ipeds_derive.pyruns it for four years.def read_ipeds(zip_path, cips, levels=tuple(LEVELS)): """Awards by (CIP code, award level) for first majors, from an IPEDS completions zip (C{year}_A).""" cips, levels = set(cips), {str(int(x)) for x in levels} out = {} with zipfile.ZipFile(zip_path) as z: name = next(n for n in z.namelist() if n.lower().endswith(".csv")) with z.open(name) as f: for row in csv.DictReader(io.TextIOWrapper(f, encoding="latin-1")): d = {k.strip().upper().lstrip("\ufeff").lstrip("\u00ef\u00bb\u00bf"): v for k, v in row.items() if k} cip = d["CIPCODE"].strip().strip('"') lvl = str(int(d["AWLEVEL"].strip())) if cip in cips and lvl in levels and d.get("MAJORNUM", "1").strip() == "1": out[(cip, lvl)] = out.get((cip, lvl), 0) + int(d["CTOTALT"] or 0) return outListing 29.1. Awards by programme code and level from one year’s completions file. code/firm/edupipe/firm_edupipe.py Placement reports.
PlacementReportrecords the denominators;median_quantile_boundsgives the bound of the method (Listing 29.2).def median_quantile_bounds(self): """The median of all `accepted` lies between these quantiles of the reported pay distribution, whatever the non-reporters earn (all below, or all above, the reporters).""" if self.reporting is None: return None k = self.accepted - self.reporting half = self.accepted / 2.0 return max(0.0, (half - k) / self.reporting), min(1.0, half / self.reporting)Listing 29.2. The quantiles between which a cohort’s median must lie. code/firm/edupipe/firm_edupipe.py - The ratio. Master’s degrees in the two financial codes against the fiscal 2025 filings in the quantitative researcher and quant developer families.
The result: 5 454 master’s degrees in 2024 against 1 466 filings in fiscal 2025, a ratio of 3.72. The two numbers count different things (degrees of all nationalities against visa filings by a sample of employers) and the ratio is a scale, not a placement rate.
What to change next. Add the other years’ files and the UK’s counts where openly licensed; split completions by citizenship (the survey reports nonresident students); collect more placement reports with their denominators.
29.7 Build: firm.edupipe
Purpose. Count degrees by field and level from the federal survey, and record placement reports with their denominators.
Interface. firm.edupipe: LEVELS; read_ipeds(zip_path, cips, levels); PlacementReport(programme, cohort, students, seeking, accepted, reporting, median_base, standard, note) with placement_rate, reporting_rate and median_quantile_bounds().
Rules. First majors only; the file is streamed; a report that does not state its reporting count gives no bound.
Acceptance tests. code/firm/edupipe/tests/: second majors and other codes are excluded and zero-padded levels are read; 89 of 98 reporting bound the median between the 44.9th and 55.1st reported percentiles.
Stretch. HESA counts; the nonresident share of completions; a placement-report parser.
Sources and further reading
- National Center for Education Statistics, IPEDS completions and the Classification of Instructional Programs 2020.
- UC Berkeley MFE and Carnegie Mellon MSCF employment reports.
- International Mathematical Olympiad, general information.
- Chapter 14’s tables from the Department of Labor’s LCA files.
29.8 Exercises
Exercise 29.1 ★
By what factor did master’s degrees in financial mathematics grow between 2010 and 2024?
Solution
Solution of Exercise 29.1.
: fifteen times.
Exercise 29.2 ★
What share of the Berkeley class looking for jobs accepted an offer?
Solution
Solution of Exercise 29.2.
.
Exercise 29.3 ★
How many points can an IMO contestant score at most?
Solution
Solution of Exercise 29.3.
42: six problems of 7 points each.
Exercise 29.4 ★★
If 60 of 98 had reported pay in the second report, between which reported percentiles would the cohort’s median lie?
Solution
Solution of Exercise 29.4.
With 38 non-reporters, between the rd and th percentiles of the reported pay: the reported median would say little about the cohort’s.
Exercise 29.5 ★★
Why is the count of financial mathematics degrees a floor on specialised financial degrees, and how could it overstate the trend?
Solution
Solution of Exercise 29.5.
Programmes choose their code, and some financial engineering programmes use others (engineering, business, statistics), so the code misses them; if programmes moved into the code over time, the count grows faster than the number of such degrees.
Exercise 29.6 ★★
Compare the research doctorates in the four general fields with the financial master’s degrees in 2024.
Solution
Solution of Exercise 29.6.
research doctorates in physics, computer science, mathematics and statistics, against master’s degrees in the two financial codes: about as many.
Exercise 29.7 ★★★
Coding. Using read_ipeds, compute the growth of computer science master’s degrees between 2019 and 2024, and compare it with financial mathematics’.
Solution
Solution of Exercise 29.7.
Computer science master’s degrees rose from 11 598 to 25 543, 2.20 times; financial mathematics from 3 554 to 4 584, 1.29 times.
Exercise 29.8 ★★★
Find the flaw. “Programme A reports a median of $150 000 and programme B $145 000, so A places its graduates better.”
Solution
Solution of Exercise 29.8.
The two reports use different denominators and standards: one does not say how many reported pay, the other counts short-term employment as placement under its standard; the cohorts graduate at different times of year and into different markets; and a median of base pay says nothing about bonus or the jobs’ kinds. A $5 000 difference is within what those choices can move.
29.9 Problem: How Many Quants Does the World Train?
Problem 29.1
Weekend problem — how many quants does the world train?
A university considers launching a financial engineering master’s and asks how large the market for its graduates is.
Part I — The codes.
- Define the Classification of Instructional Programs.
- Which codes cover financial mathematics and financial analytics, and how are they defined?
- What does the completions survey count, and over which period?
- Why do first majors matter?
- Why is the count a floor?
Part II — The numbers.
- Give the master’s degrees in financial mathematics for the four years.
- Give the 2024 awards by level in the six fields.
- How large are the specialised degrees beside computer science?
- Give the research doctorates in the four general fields.
- Which roles draw on which degrees?
Part III — Placement.
- Define a placement report.
- Give the two reports’ denominators and medians.
- State the bound on a cohort’s median and apply it.
- What does neither report say?
- What does a competition result signal, and what not?
Part IV — The verdict.
- State the named result: annual US master’s completions in the financial programme codes, and their ratio to the yearly count of LCA filings in quantitative titles at finance employers.
- Why is the ratio not a placement rate?
- What would the university’s graduates compete with?
- What should its placement report publish?
- In two sentences, answer the university.
Solution
Solution of Problem 29.1.
- As in the chapter’s definition.
- 27.0305 financial mathematics (“the application of mathematics and statistics to the finance industry”), and 30.7104 financial analytics (“financial big data modeling”), new in 2020.
- Awards by institution, code, major and level, July to June.
- So that a student with two majors is counted once.
- Other programmes use other codes.
- 305, 773, 3 554 and 4 584.
- As in the degrees box.
- Less than a fifth of computer science’s master’s degrees.
- 1 760, 1 628, 1 165 and 454: 5 007.
- Research from doctorates and general master’s; engineering from computer science; bank quant and structuring also from the specialised master’s.
- As in the chapter’s definition.
- 70 seeking, 67 accepted, $150 000, reporting count not stated; 98 seeking, 98 accepted within three months (including short-term), 89 reporting, $145 000.
- Between the reported quantiles and : 44.9% and 55.1% for 89 of 98.
- What non-reporters earned and why they did not report; bonuses; what counts as a job.
- Speed and depth on well-posed problems; not research on ill-posed ones.
- 5 454 master’s degrees in 2024 against 1 466 filings in fiscal 2025: 3.72.
- The two counts cover different people: all graduates of all nationalities against visa filings by a sample of employers.
- Graduates of computer science, statistics, mathematics and physics as well as the other financial programmes.
- Its denominators (class size, seeking, accepted, reporting), its reporting standard and the dates.
- The market is several thousand specialised master’s graduates a year beside tens of thousands of general ones, and the firms hire from both. A new programme will be judged by placement evidence it can show with its denominators.
29.10 Interview questions
Interview question 29.1 ★ researcher
What did your thesis teach you that a course could not?
Solution
Solution of Interview question 29.1.
A specific example of working on a problem without a known answer for months: dead ends, checking one’s own results, and deciding what to give up.
What the interviewer is looking for: evidence of independent research.
Interview question 29.2 ★ researcher, developer
Show us a piece of work outside your coursework and explain one decision in it.
Solution
Solution of Interview question 29.2.
Present a project that can be rerun, and explain a design choice, what was tried, and what was measured to decide.
What the interviewer is looking for: reasoning about trade-offs, not a list of tools.
Interview question 29.3 ★★ researcher
A report says 100% of a class was placed. What would you ask before believing it?
Solution
Solution of Interview question 29.3.
Of how many, how many sought work, what counts as a placement (short-term work?), by which date, and how many reported pay.
What the interviewer is looking for: denominators and definitions.
Interview question 29.4 ★★ researcher
How would you estimate the number of people who become quantitative researchers each year?
Solution
Solution of Interview question 29.4.
A Fermi estimate from the supply side (graduates in feeding fields times the share hired) and from the demand side (firms’ headcounts times turnover and growth), with the two compared; state the uncertainty.
What the interviewer is looking for: two independent estimates.
Interview question 29.5 ★★ developer
You taught yourself C++. How would you show us you can write production code?
Solution
Solution of Interview question 29.5.
With code others can read and run: a repository with tests, a build, documentation and history, and one piece you can explain line by line.
What the interviewer is looking for: evidence over assertion.
Interview question 29.6 ★★★ researcher
A counted series jumps when a new classification code is introduced. How do you tell a real change from a recoding?
Solution
Solution of Interview question 29.6.
Look for a matching fall in the codes it replaced, compare institutions that reported under both, and check totals that do not depend on the code.
What the interviewer is looking for: crosswalks and totals.