The Industry: Firms, Roles and Careers · Careers
22Portfolio Manager and Pod Analyst
One of the largest multi-manager platforms describes its portfolio managers’ pay in its filing with the US regulator: a percentage of the profits the manager earned in the preceding year, measured without regard to other managers, with losses carried forward, a salary that is an advance against the payout, and no clawback. The platform also allocates and reallocates capital among its managers, and can take it away. The deal is a call option on the manager’s own skill with a knock-out: the manager keeps a share of the upside, bears no share of a loss beyond a lost payout, and loses the job if the loss goes too deep. Its value depends on the Sharpe ratio the manager actually has, which neither side knows at the start. This chapter describes the portfolio manager’s and the analyst’s jobs, values the deal, and asks what a track record can prove.
| Role cards: the pod | |||
|---|---|---|---|
| portfolio manager | sub-portfolio manager | pod analyst | |
| owns | the pod’s P&L | a slice of it | none; supports the manager’s |
| paid by | a share of the pod’s profit | a share agreed with the manager | salary and a discretionary bonus |
| reports to | the platform’s head of strategy | the portfolio manager | the portfolio manager |
| codes in filings | 11-3031, 13-2099.01 | 13-2051, 13-2099.01 | 13-2051 |
| taught in | Book 8, ch. 28; Book 16, ch. 3 | Book 16, ch. 3 | Book 7, ch. 1 |
Definition 22.1 (Portfolio manager, sub-portfolio manager, pod analyst)
A portfolio manager is the person who decides the positions of a portfolio within the limits of an owner of the capital and answers for its result. On a platform, a sub-portfolio manager runs a slice of a portfolio manager’s capital with its own limits and a share of its own profit, inside the manager’s team. A pod analyst works for a portfolio manager on research, data and position monitoring, without capital of their own.
22.1 The deal: capital, payout, limits and costs
The platform’s brochure is the best public description of the deal’s structure; its numbers are not published. The structure has four parts.
- Capital. The platform allocates capital to the pod (Book 8, chapter 28) and “allocating and reallocating” it is its main tool: capital grows after good results and shrinks, or goes, after bad ones.
- Payout. The manager is paid a share of the pod’s own profit, at the payout rate of Book 16, chapter 3, “without taking into account the performance of other Portfolio Managers”; “the losses are carried forward and past losses must be made up before performance-based compensation becomes payable”; the salary is “generally treated as an advance”; and managers “with positive performance will receive performance-based compensation even if” the funds lose.
- Limits. Risk limits and drawdown limits (Book 8, chapter 28); the de-risking ladder of Book 16, chapter 8, cuts capital at a first drawdown and stops the pod at a second.
- Costs. The pod’s own costs (data, staff, the manager’s team’s pay) are charged against its profit before the payout, and the investors bear them through the pass-through fee of Book 16, chapter 3.
The brochure also records that the platform has agreed to “guarantee” a level of pay for a year or years, and to replace pay that a manager forfeited on leaving a previous employer: the buyouts of chapter 13.
As of August 2026 — A platform’s deal with its portfolio managers
Millennium Management’s Form ADV Part 2A of 25 August 2026: pay “generally determined as a percentage of profits earned by such Portfolio Manager during the preceding calendar year”; losses carried forward; salary an advance against the payout; “generally no "carryback" or "clawback"”; payout due even when the funds lose; guarantees and buyouts agreed at times; some managers’ teams include members “who may also be "portfolio managers"”. No payout rate or drawdown threshold is published.
22.2 The deal as an option with a knock-out
Method 22.2 (The portfolio manager’s deal)
Let the pod earn daily returns with annual Sharpe ratio and volatility on capital . Each year-end the manager is paid , where is the year’s profit, the loss carried forward, the payout rate and the salary; . A drawdown from the tenure’s peak beyond halves the capital for the rest of the tenure; beyond it ends the job, with the salary paid to that day and nothing after. The payoff is convex in the year’s profit (a call) and truncated by the stop (a knock-out).
Example 22.3 (A three-year tenure)
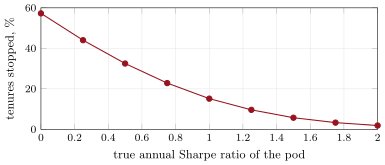
Take illustrative terms: $500 million of capital, volatility 6% a year ($30 million), payout 15%, salary $0.5 million, capital halved at a 5% drawdown and the pod stopped at 7.5%, over three years, against a salaried alternative of $1.5 million a year. With no skill () the manager’s expected three-year pay is $3.18 million (median $1.50 million) and the pod is stopped in 57.3% of tenures. At the expected pay is $10.48 million and the stop probability 15.2%; at , $23.36 million and 1.9%. The expected pay reaches the alternative’s $4.5 million at , where the pod is stopped in about 43% of tenures (Figures 22.1 and 22.2).
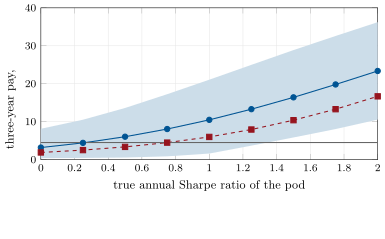
in_pm.curve.The deal pays for luck. With no skill at all, its expected value is $3.18 million over three years, about seven-tenths of the alternative, because the manager keeps a share of good years and gives back nothing in bad ones except the payouts that carried losses cancel. The investors pay for that option, which is the netting cost of Book 16, chapter 3, and the platform limits it with the stop: at more than half the tenures end early. For a risk-averse manager the calculation moves: with relative risk aversion 3 and $5 million of other wealth, the certainty equivalent reaches the alternative only at , where the stop probability is about 23%. The spread of outcomes is wide at every skill (Figure 22.3).
in_pm.curve.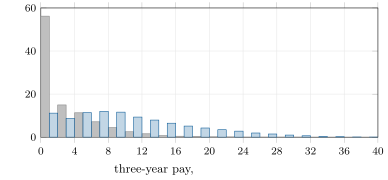
in_pm.run.22.3 The analyst: from research to running capital
A pod is a small team: a portfolio manager, one or more analysts, sometimes a quantitative researcher or developer, and on larger pods sub-portfolio managers. The brochure notes that oversight of part of a manager’s assets may be given to members of the team “who may also be "portfolio managers"”, and that some managers mainly “oversee and manage other investment personnel”. The analyst’s work is the manager’s research: models of the companies or markets the pod trades, data, the monitoring of positions and risk, and ideas.
The analyst’s pay is set by the manager, out of the pod’s economics, and is less formulaic than the manager’s. The route up is to run capital: first a slice of the manager’s book as a sub-portfolio manager, with its own record, then a pod of one’s own on the same platform or another. That record is what the next section is about.
22.4 Track records and moving
A manager moves with a track record, and the platform hiring them must judge it. The portability of a track record (Book 16, chapter 25) is limited by what it can prove. Chapter 17’s arithmetic applies: a true Sharpe ratio of 1 needs 3.85 years of daily results to be distinguishable from zero at 95%, and a three-year record of Sharpe ratio 1 has a t-statistic of about 1.73. A manager stopped in year two has a record too short to prove or disprove anything, and a manager who survived three years may have been lucky: at , 43% of the example’s tenures survive three years.
The hiring platform therefore reads more than the number: the strategy’s capacity and crowding, the risk taken for the return, how much of the result came from a few trades, whether the process can be explained, and whether the team moves with the manager. The restrictive covenants of chapter 28 decide when the manager can start, and the buyout of chapter 13 what the move costs the new employer.
22.5 Portfolio managers outside the platforms
The portfolio manager’s title is older than the platforms and covers different deals.
- At a single-manager hedge fund (chapter 4) the portfolio manager may be the founder, paid through the firm’s fees and ownership rather than a payout rate (Book 16, chapter 25, on launching a fund).
- At a systematic fund (chapter 4) portfolios are run by models; “portfolio manager” may mean the person who oversees a set of strategies and their risk.
- At an asset manager or pension fund (chapter 8) the portfolio manager runs a mandate against a benchmark and is judged against it; nothing in the mandate works like a platform’s stop.
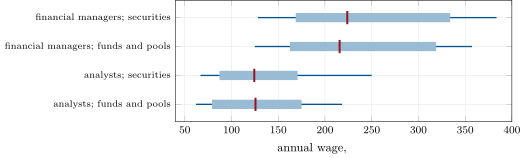
The survey’s financial managers, whose detailed occupations include investment fund managers (O*NET lists “Portfolio Manager” among their reported titles), earned in the securities industry a median wage of $223 860 in May 2025, with a 90th percentile of $383 590; the analysts $124 370 and $250 000. The survey records wages only, which for a platform manager are a small part of pay.
As of May 2025 — What portfolio managers and analysts are paid: the public evidence
Occupational survey, May 2025, securities industry: financial managers (11-3031) 70 400 employed, 10th–90th percentile $128 260–383 590, median $223 860; financial and investment analysts (13-2051) 89 390, median $124 370, 90th percentile $250 000. Other investment pools and funds: financial managers median $215 690, analysts $125 710. The labour condition applications for portfolio-manager titles at the sourced employers are too few to publish (14 in fiscal 2025). Wages only.
data/industry/oews_roles.csv, through in_pm.survey.22.6 Tutorial: valuing the deal
Goal. Value a platform portfolio manager’s deal as a function of skill, and find the skill at which it beats a salaried job. End state: Figures 22.1, 22.2 and 22.3.
- Pods. Book 16’s
firm.podshop.podsdraws daily returns for independent pods of a given Sharpe ratio and volatility. The deal.
firm.roles.pm_dealapplies the payout, the carried losses, the salary advance and the ladder over the tenure (Listing 22.1).def pm_deal(sr, years, vol, capital, rate, salary, cut, stop, n, rng, days=252): """Simulate n tenures of `years` for a portfolio manager whose pod earns an annual Sharpe ratio sr at annual volatility vol (fractions of capital). Each year-end the manager is paid max(salary, rate * max(profit - carried losses, 0) * capital); a drawdown from the tenure's peak above `cut` halves the capital for the rest of the tenure, above `stop` ends the job (salary to that day, no payout for the year, nothing after). Returns pay in dollars.""" import pathlib import sys sys.path.insert(0, str(pathlib.Path(__file__).resolve().parents[1] / "podshop")) import firm_podshop as ps daily = ps.pods(n, years, sr, vol, 0.0, rng, days)["daily"] size, eq, peak, carry = np.ones(n), np.zeros(n), np.zeros(n), np.zeros(n) alive, stop_day = np.ones(n, bool), np.full(n, years * days) pay, year_pnl, pnl = np.zeros(n), np.zeros(n), np.zeros(n) for t in range(years * days): step = np.where(alive, size * daily[t], 0.0) eq += step year_pnl += step peak = np.maximum(peak, eq) dd = peak - eq size = np.where(alive & (dd > cut), 0.5, size) out = alive & (dd > stop) pay += np.where(out, salary * ((t % days) + 1) / days, 0.0) stop_day = np.where(out, t, stop_day) alive &= ~out if (t + 1) % days == 0: net = year_pnl - carry pay += np.where(alive, np.maximum(salary, rate * np.maximum(net, 0.0) * capital), 0.0) carry = np.where(alive, np.maximum(-net, 0.0), carry) pnl += year_pnl year_pnl[:] = 0.0 return {"pay": pay, "stopped": ~alive, "stop_day": stop_day, "pnl": (pnl + year_pnl) * capital}Listing 22.1. The portfolio manager’s deal over a tenure, with a two-step drawdown ladder. code/firm/roles/firm_roles.py - Utility. Chapter 13’s
firm.payoffer.certainty_equivalentconverts the pay distribution into a sure amount. - The crossing.
in_pm.crossinginterpolates the Sharpe ratio at which expected pay, or the certainty equivalent, reaches the alternative.
With the example’s terms: expected pay reaches $4.5 million at (stop probability about 43%); the certainty equivalent at (about 23%).
What to change next. Let the platform raise capital after good years; add a guarantee in year one; make the Sharpe ratio uncertain and let the manager learn it from results; charge the pod’s costs.
22.7 Build: pod cards and the manager’s deal
Purpose. Add the pod’s roles to the registry and model the portfolio manager’s deal.
Interface. firm.roles: the cards portfolio manager, sub-portfolio manager, pod analyst; pm_deal(sr, years, vol, capital, rate, salary, cut, stop, n, rng, days) -> dict(pay, stopped, stop_day, pnl); on firm.podshop.pods.
Rules. Payout on the pod’s own profit above carried losses; the salary is an advance; no clawback; the ladder works on the drawdown from the tenure’s peak; terms are the caller’s, labelled illustrative.
Acceptance tests. code/firm/roles/tests/: a pod that cannot lose pays exactly the rate times its profit; a stop on the first day pays one day’s salary; more skill means fewer stops and more pay.
Stretch. Capital that grows with results; a manager who stops trading after a payout-maximising year; the platform’s side: expected payout against the investors’ net return.
Sources and further reading
- Millennium Management LLC, Form ADV Part 2A brochure, 25 August 2026 (SEC IAPD).
- Bureau of Labor Statistics, occupational survey, May 2025; chapter 14’s LCA tables.
- Book 16, chapters 3, 8 and 25; Book 8, chapter 28.
22.8 Exercises
Exercise 22.1 ★
A pod made $40 million last year after a $10 million loss the year before. At a 15% payout rate and a $0.5 million salary, what is the manager paid for last year?
Solution
Solution of Exercise 22.1.
The carried loss is made up first: million of net profit, and 15% of it is $4.5 million, of which the $0.5 million salary already paid is an advance. Total for the year: $4.5 million.
Exercise 22.2 ★
From the example, how much does the expected three-year pay rise between and , and how much does the stop probability fall?
Solution
Solution of Exercise 22.2.
Expected pay rises by $7.30 million ($3.18 to $10.48 million); the stop probability falls by 42.1 points (57.3% to 15.2%).
Exercise 22.3 ★
What t-statistic does a three-year daily record with Sharpe ratio 2 have?
Solution
Solution of Exercise 22.3.
About ; with Lo’s correction for 756 daily observations, 3.45.
Exercise 22.4 ★★
Why is the deal worth $3.18 million in expectation to a manager with no skill, and who pays for it?
Solution
Solution of Exercise 22.4.
The payout is a call on each year’s profit: the manager shares good years and loses nothing in bad ones but the payouts that carried losses cancel, so even a zero-mean pod has a positive expected payout. The investors pay for it, as the netting cost of Book 16, chapter 3; the stop limits it by ending unlucky tenures.
Exercise 22.5 ★★
Why does the certainty equivalent cross the alternative at a higher Sharpe ratio than the expected pay?
Solution
Solution of Exercise 22.5.
The certainty equivalent penalises the spread of outcomes: a risk-averse manager values the many low outcomes more than the few high ones, so she needs more skill before the deal is worth a sure salary.
Exercise 22.6 ★★
An analyst is offered a sub-portfolio of $50 million with a 10% share of its profit, or a $300 000 salary with a discretionary bonus. What must she know to choose?
Solution
Solution of Exercise 22.6.
The sub-portfolio’s volatility and her expected Sharpe ratio (which set the payout’s distribution: at 6% volatility, $3 million of annual profit a unit of Sharpe ratio, $300 000 at 10%); the limits and whether a stop ends her job; whether losses carry forward; what the bonus has been for analysts at her level; and what a record of her own is worth for her next move.
Exercise 22.7 ★★★
Coding. Rerun the example with the stop moved from 7.5% to 10%. What happens to the expected pay and the stop probability at and ?
Solution
Solution of Exercise 22.7.
At the stop probability falls from 57.3% to 26.8% and the expected pay rises from $3.18 to $3.56 million; at the stop probability falls from 15.2% to 2.1% and the pay rises from $10.48 to $10.76 million. After the cut at 5% the capital is halved, so a further 5% of the original capital is a 10% loss on what is left.
Exercise 22.8 ★★★
Find the flaw. “She ran a pod for three years with a Sharpe ratio of 1.2 and was never stopped: she is clearly skilled, and we should give her twice the capital.”
Solution
Solution of Exercise 22.8.
A Sharpe ratio of 1.2 over three years has a t-statistic of about , barely significant; she was one of many managers, and the ones who were stopped are not in the sample; 43% of no-skill tenures survive three years in the chapter’s example. Doubling capital also changes the strategy’s costs and capacity. Look at the process, the risk taken and how concentrated the result was, and raise capital in steps.
22.9 Problem: The Deal
Problem 22.1
Weekend problem — the deal
A senior analyst at an asset manager, paid $1.5 million a year, is offered a pod at a platform on the example’s terms. She believes her true Sharpe ratio is between 0.5 and 1.
Part I — The roles and the deal.
- Define the portfolio manager, the sub-portfolio manager and the pod analyst.
- Describe the payout structure the platform’s brochure states.
- What does the platform do with capital, and why is that its main tool?
- What is the de-risking ladder, and which book defines it?
- What costs are charged before the payout?
Part II — The model.
- State the deal’s payoff with carried losses and a salary advance.
- Why is it a call, and why a knock-out?
- State the example’s terms.
- Give the expected pay and stop probability at , 1 and 2.
- What is the certainty equivalent, and at which risk aversion and wealth is it computed?
Part III — Records and alternatives.
- How long must a Sharpe ratio of 1 run to be distinguishable from zero?
- What does the hiring platform read besides the number?
- How does a portfolio manager’s deal at an asset manager differ?
- What do the survey’s wages show, and what do they miss?
- How does an analyst move toward running capital?
Part IV — The verdict.
- State the named result: the true Sharpe ratio at which the expected three-year pay exceeds the salaried alternative, and the stop probability there.
- What happens to the answer with her risk aversion?
- Over her range of beliefs, what are the expected pay and stop probability?
- What should she negotiate?
- In two sentences, advise her.
Solution
Solution of Problem 22.1.
- As in the chapter’s definition.
- A percentage of the manager’s own profit for the year, mark-to-market, without regard to other managers; losses carried forward; salary an advance; no clawback; payout due even if the funds lose.
- It allocates and reallocates capital among managers; capital sets the pod’s size, and so its profit and risk.
- A cut in capital at a first drawdown and a stop at a second; Book 16, chapter 8.
- The pod’s own costs, including its team’s pay and data.
- each year with .
- Convex in profit (a call); ended by the stop (a knock-out).
- $500 million, 6% volatility, 15% payout, $0.5 million salary, cut at 5%, stop at 7.5%, three years.
- $3.18 million and 57.3%; $10.48 million and 15.2%; $23.36 million and 1.9%.
- The sure amount with the same expected utility; relative risk aversion 3 and $5 million of other wealth.
- 3.85 years of daily results.
- Capacity, crowding, risk taken, concentration of the result, the process and whether the team moves.
- A mandate against a benchmark, judged relative to it, with no stop in the deal.
- Median wages of $223 860 for financial managers and $124 370 for analysts in the securities industry; they miss payouts and bonuses.
- Through a sub-portfolio and a record of her own.
- , with about 43% of tenures stopped.
- With risk aversion 3 and $5 million of wealth the crossing moves to (about 23% stopped).
- From $6.04 million and 32.5% stopped at to $10.48 million and 15.2% at .
- A guarantee for the first year, the size of the stop, whether capital is cut before the stop, and what happens to carried losses if she leaves.
- If her Sharpe ratio is really 0.5 to 1, the deal’s expected pay is two to three times her salary even after risk aversion, but in a third to a sixth of tenures she will be out within three years. Take it only with savings to carry that outcome and a first-year guarantee.
22.10 Interview questions
Interview question 22.1 ★ trader, researcher
Your pod is down 4% from its peak with a stop at 7.5%. What do you do?
Solution
Solution of Interview question 22.1.
Reduce risk before the ladder does it for you, keep the positions with the best expected return per unit of risk, check whether the loss comes from the process or from one position, and tell the risk manager what you are doing.
What the interviewer is looking for: deliberate de-risking and communication, not hope.
Interview question 22.2 ★ researcher
How would you tell a portfolio manager that your best idea no longer works?
Solution
Solution of Interview question 22.2.
With the evidence: when it stopped working, how you know, what it has cost, and what you propose instead, early.
What the interviewer is looking for: honesty with evidence, early.
Interview question 22.3 ★★ trader
Why might a manager with carried losses take more risk, and how would a platform stop it?
Solution
Solution of Interview question 22.3.
With losses carried forward the payout is far out of the money, and more risk raises its value: an option holder likes volatility. Platforms answer with risk limits, capital cuts and stops, which cap the risk a manager can add.
What the interviewer is looking for: option convexity and the limits that offset it.
Interview question 22.4 ★★ researcher, trader
How much of your pod’s return is market beta, and how would you measure it?
Solution
Solution of Interview question 22.4.
Regress the pod’s daily returns on market and factor returns; the loadings times the factors’ returns is the beta part. Platforms often want it near zero and may hedge it centrally.
What the interviewer is looking for: factor regression and why the platform cares.
Interview question 22.5 ★★ trader
What would you want to know about a candidate manager’s three-year record before hiring them?
Solution
Solution of Interview question 22.5.
Daily returns, the risk and limits under which they were earned, capacity, concentration, turnover, the benchmark and factor exposures, and whether the team and the data move with the manager.
What the interviewer is looking for: the record’s statistics and its conditions.
Interview question 22.6 ★★★ researcher, trader
Value the manager’s option on one year: the pod’s profit is normal with mean zero and standard deviation $30 million, the payout 15%. What is the expected payout?
Solution
Solution of Interview question 22.6.
million.
What the interviewer is looking for: the expected positive part of a normal.