The Industry: Firms, Roles and Careers · Careers
8Asset Managers, Pensions, Sovereign Funds and Insurers
Norway’s sovereign fund was worth 21 268 billion kroner at the end of 2025, about $2.05 trillion at the year’s average exchange rate, and its manager employed 678 people. It spent 3.8 basis points of the fund on management, and 39% of that went to the external managers who ran 5% of its assets. Canada’s national pension fund, less than a third of the size, paid its external managers C$4.7 billion in base and performance fees in its latest year, 2.7 times its own operating expenses. The two institutions have made opposite choices about what to do themselves, and those choices decide how many quants they employ and what the quants do. This chapter describes the other side of the markets: the asset owners whose money the rest of the industry manages, the asset managers who serve them, and the insurers who manage against their liabilities.
8.1 Asset owners and their in-house teams
Definition 8.1 (Asset owner)
An asset owner is an institution that invests assets it holds on behalf of beneficiaries or of the state – a pension fund, a sovereign wealth fund, an endowment, an insurer’s general account – and answers for the results to them, whether it manages the assets itself or through external managers.
Definition 8.2 (Sovereign wealth fund, defined-benefit pension plan)
A sovereign wealth fund is a special-purpose investment fund owned by a general government, created for macroeconomic purposes, that invests (among other things) in foreign financial assets. A defined-benefit pension plan promises its members a fixed, pre-established benefit at retirement, so that the investment risk falls on the sponsor and the plan’s assets are managed against the promised benefits.
Book 1 (chapter 3) introduced asset owners as the clients of asset managers. As employers they differ from everyone else in this book in one way: their goal is set by a liability or a mandate from a government or a board, not by a profit to owners. A pension fund’s quants work to meet benefits; a sovereign fund’s to meet a return target with a risk budget set by its ministry; neither is paid a share of what it makes.
Definition 8.3 (Internal management)
Internal management is the management of an asset owner’s assets by its own staff rather than by external managers under mandates; its share is the fraction of assets managed that way.
8.2 Where quants sit: allocation, risk, liabilities, factors and indices
In an asset owner, quantitative work falls into five kinds.
- Asset allocation: the strategic mix and its risk, the owner’s largest single decision.
- Risk: measurement and limits across internal and external mandates (Book 6).
- Liability matching: for pension funds and insurers, the liability-driven investment of Book 2 (chapter 7): curves, duration, inflation, hedging programmes.
- Factor and quantitative equity: internal systematic portfolios and the monitoring of external ones (Book 8, chapter 29).
- Index and implementation: low-cost replication of benchmarks, trading, transition management.
The mix depends on the owner’s choice between doing and buying. An owner that manages most assets internally employs portfolio managers, traders and researchers; one that buys management employs manager selectors, risk analysts and allocators.
8.3 Two owners, two models
As of May 2026 — Two asset owners in their own numbers
Norges Bank Investment Management (annual report 2025): fund value NOK 21 268 billion; 678 employees in Oslo, London, New York and Singapore; management fee NOK 7 537 million, 3.8 basis points of assets under management, of which personnel costs NOK 2 476 million, base fees to external managers NOK 1 756 million and performance fees NOK 1 182 million; NOK 1 062 billion (5.0% of the fund) with 111 external mandates. CPP Investments (fiscal year to 31 March 2026): net assets C$793.3 billion; operating expenses C$1 757 million (an operating expense ratio of 23.1 basis points); C$1 976 million of investment management fees and C$2 758 million of performance fees paid to external managers; C$753 million of transaction costs; net investments per employee C$364 million.
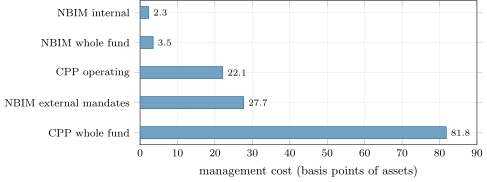
The two numbers the owners publish, 3.8 and 23.1 basis points, are not comparable: one includes external managers’ fees and the other does not. Put on the same footing from the published totals, with year-end assets as the denominator, the Norwegian fund’s total management cost is 3.5 basis points and the Canadian fund’s 81.8, of which 59.7 are external managers’ fees (Figure 8.1). Splitting the Norwegian fund by who manages the assets shows why: its internally managed 95% cost 2.3 basis points, its external mandates 27.7 basis points, of which 16.5 base fees and the rest performance fees.
in_owners.Remark 8.4 (What the two models buy)
A cost in basis points is half of the comparison: the other half is what the costs buy. An owner that pays external managers large performance fees is paying for returns it expects them to earn above their fees, in assets (private equity, credit, real assets, hedge funds) that an index team cannot run. An owner with 95% of its assets in listed securities managed close to an index needs few people per dollar. The comparison is between business models, not between efficiencies.
For an employee the models mean different jobs. The Norwegian fund manages $3.0 billion of assets per employee, and its personnel costs come to NOK 3.65 million per employee, about $352 000 at 2025 average rates: fewer people, each responsible for more money, working mostly on listed markets. The Canadian fund’s model employs more people per dollar (C$364 million of net investments per employee) and many of them select, oversee and negotiate with external managers and partners, which is a different craft from running a portfolio.
8.4 Build or hire: the internal team’s break-even
Method 8.5 (Break-even mandate size)
- Cost the internal team: headcount times staff cost per head, plus systems and data.
- Cost the external option: the fee rate in basis points of the mandate, with the expected performance fee.
- The break-even mandate size is the internal cost divided by the fee rate.
- Above it the internal team is cheaper, if it can deliver the same return; below it, the fee is.
Example 8.6 (A ten-person team)
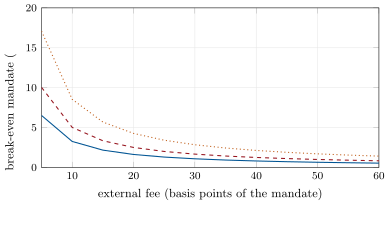
A ten-person internal team at $352 000 per head, the Norwegian fund’s 2025 personnel cost, plus $1.5 million of systems and data (an illustrative figure), costs $5.02 million a year. Against an external fee of 20 basis points it breaks even at a mandate of $2.51 billion; against 10 basis points, at $5.02 billion; against 40, at $1.255 billion (Figure 8.2). A large owner’s mandates are far above these sizes, which is why the largest owners internalise the strategies they can run.
firm.ownercost.breakeven_assets, through in_owners.team_breakeven.8.5 Long-only quantitative managers
The asset managers that serve owners are the largest employers on the buy side. One manager reports $14.0 trillion of assets under management and about 24 900 employees, some $560 million per employee. Quantitative work at a manager of that size is index engineering, portfolio construction and factor products (Book 8, chapter 29), risk systems and the trading that implements portfolio changes (Book 10, chapter 20). The pace is set by rebalancing calendars and client mandates, not by the market’s minute-to-minute moves, and pay follows the manager’s fee revenue rather than trading profit (chapter 13).
8.6 Insurers: asset-liability management and the actuarial quant
An insurer invests premiums against liabilities it owes policyholders, often decades away; its investment function is an asset owner’s, and its quants work on asset–liability management (Book 6, chapter 24): matching the duration and cash flows of assets to liabilities, hedging interest-rate and inflation risk, and holding capital against the mismatch under solvency rules. Beside them, actuaries price the liabilities themselves with mortality, lapse and catastrophe models. The two professions meet on the balance sheet, and a quant moving between banking and insurance brings interest-rate and derivatives models (Books 2 and 6) and learns liability models.
8.7 Pace, pay and stability on the asset-owner side
The asset-owner side offers a different bargain from the rest of this book. Horizons are long, feedback is slow and measured against benchmarks, and a single decision — the strategic allocation — outweighs any trade. Pay is set by boards and governments, published in aggregate (the personnel line of the Norwegian fund’s accounts), and rarely tied to a share of profit. Institutions last: a pension fund does not close after a drawdown. For a quant, the side trades upside for stability and scale for pace.
8.8 Tutorial: build or hire the team
Goal. Put two asset owners’ published costs on one footing, split one owner’s cost between internal and external management, and compute the break-even mandate for an internal team. End state: Figures 8.1 and 8.2.
- The totals.
data/industry/asset_owners.csvholds each owner’s published totals in its own currency: assets, employees, personnel and internal costs, external base and performance fees, externally managed assets where published. One footing.
firm.ownercost.cost_bp(owner)divides all management costs by year-end assets;split_bpdivides internal costs by internally managed assets and external fees by externally managed assets (Listing 8.1).def cost_bp(o): return 1e4 * (o.internal_costs + o.external_base + o.external_perf) / o.assets def split_bp(o): if o.external_assets is None: raise ValueError("the owner does not publish its externally managed assets") internal_assets = o.assets - o.external_assets return 1e4 * o.internal_costs / internal_assets, 1e4 * (o.external_base + o.external_perf) / o.external_assetsListing 8.1. The total cost and the internal-external split, in basis points. code/firm/ownercost/firm_ownercost.py - Per head.
in_owners.nbim()converts personnel costs per employee to dollars at the ECB’s average rates. - Break-even.
in_owners.team_breakeven(heads, cost_per_head_k, systems_k, fees)applies Method 8.5.
What to change next. Add a performance fee of 20% of a 1% excess return to the external option and recompute the break-even (exercise 7); add a third owner from its annual report, with its own cost lines.
8.9 Build: the owner’s cost model
Purpose. Compare doing and buying investment management on one footing, for this chapter and for chapter 12’s per-head comparisons.
Interface. firm.ownercost: Owner(name, assets, internal_costs, external_base, external_perf, external_assets); cost_bp; split_bp; internal_cost; external_cost; breakeven_assets.
Rules. One currency and one denominator per comparison; the split is refused when the owner does not publish its externally managed assets; fees in basis points of the mandate.
Acceptance tests. code/firm/ownercost/tests/: cost and split on constructed totals; the split refused without external assets; internal and external costs equal at the break-even.
Stretch. Transaction costs and the return difference between internal and external management; a team whose cost per head rises with the mandate’s complexity.
Sources and further reading
- Norges Bank Investment Management, Government Pension Fund Global, annual report 2025 (table 12.1).
- CPP Investments, results release for fiscal 2026 (20 May 2026).
- International Working Group of Sovereign Wealth Funds, Santiago Principles (2008); US Internal Revenue Service, defined benefit plans.
- BlackRock, Form 10-K for 2025; European Central Bank, annual average reference rates.
8.10 Exercises
Exercise 8.1 ★
Convert the Norwegian fund’s value to US dollars at the ECB’s 2025 average rates, and compute its assets per employee.
Solution
Solution of Exercise 8.1.
dollars per krone: NOK 21 268 billion is $2 051 billion; per employee billion.
Exercise 8.2 ★
Compute the Norwegian fund’s base fees to external managers in basis points of the externally managed assets.
Solution
Solution of Exercise 8.2.
basis points.
Exercise 8.3 ★
A pension plan promises a fixed benefit at retirement. Who bears the investment risk, and which quant work follows?
Solution
Solution of Exercise 8.3.
The sponsor: the benefit is fixed, so a shortfall of the assets falls on it. The quant work is liability-driven investment: valuing the liabilities, matching duration and inflation, hedging and measuring the funding ratio’s risk.
Exercise 8.4 ★★
Compute the Canadian fund’s external managers’ fees and its own operating expenses in basis points of year-end net assets, and explain why its published operating expense ratio (23.1) differs from your operating figure.
Solution
Solution of Exercise 8.4.
External fees basis points; operating expenses . The published 23.1 uses the fund’s own definition and denominator (average net assets over the year); a year-end denominator is larger in a growing year.
Exercise 8.5 ★★
A 20-person internal team costs $352 000 per head plus $1.5 million of systems. What mandate size breaks even against an external fee of 25 basis points?
Solution
Solution of Exercise 8.5.
Cost million; break-even billion.
Exercise 8.6 ★★
Read Figure 8.2: for a ten-person team, what fee makes a $2 billion mandate break even?
Solution
Solution of Exercise 8.6.
The team costs $5.02 million: basis points.
Exercise 8.7 ★★★
Coding. An external manager charges 20 basis points plus 20% of an expected excess return of 1% a year. Recompute the ten-person team’s break-even mandate. What must the internal team deliver for the comparison to hold?
Solution
Solution of Exercise 8.7.
The expected fee is basis points: break-even billion. It holds only if the internal team also earns the 1% excess return; otherwise compare costs net of returns.
Exercise 8.8 ★★★
Find the flaw. “The Norwegian fund costs 3.5 basis points and the Canadian fund 81.8: the Canadian fund is 23 times less efficient.”
Solution
Solution of Exercise 8.8.
The two funds run different business models: one holds listed assets close to benchmarks, managed internally; the other buys private and active strategies whose fees pay for expected excess returns. Cost is half the comparison; the other half is net return, and the asset mix differs.
8.11 Problem: Build or Hire the Team
Problem 8.1
Weekend problem — build or hire the team
The chief investment officer of a pension fund with $200 billion of assets asks whether to bring a $15 billion equity mandate in-house, and a quant is asked to answer from public numbers.
Part I — The owners.
- Define an asset owner, a sovereign wealth fund and a defined-benefit pension plan.
- Define internal management and give the Norwegian fund’s internal share.
- Name the five kinds of quantitative work in an asset owner.
- Give the two owners’ published cost ratios, and say why they cannot be compared.
- What does the Norwegian fund’s management fee consist of?
Part II — One footing.
- Compute both owners’ total management costs in basis points of year-end assets.
- Split the Norwegian fund’s cost between internal and external management.
- What share of the Canadian fund’s total cost is external managers’ fees?
- Give the Norwegian fund’s personnel cost per employee in kroner and in dollars.
- Give its assets per employee in dollars.
Part III — The team.
- State the break-even method.
- Cost a ten-person team at the Norwegian fund’s personnel cost per head and $1.5 million of systems.
- Give its break-even mandate at external fees of 10, 20 and 40 basis points.
- At 20 basis points, how many times the break-even is the $15 billion mandate?
- What would the external manager cost on $15 billion at 20 basis points?
Part IV — The verdict.
- State the named result: the break-even mandate sizes for a ten-person team at 10, 20 and 40 basis points.
- What must the internal team deliver for the answer to hold?
- What does the comparison of the two owners’ costs leave out?
- Which jobs does bringing the mandate in-house create, and which does it remove?
- In two sentences, what should the quant tell the chief investment officer?
Solution
Solution of Problem 8.1.
- An institution investing on behalf of beneficiaries or the state; a government-owned special-purpose fund for macroeconomic purposes investing in foreign assets; a plan promising a fixed benefit at retirement.
- Management by the owner’s own staff; 95%.
- Allocation, risk, liability matching, factor and quantitative equity, index and implementation.
- 3.8 and 23.1 basis points; one includes external managers’ fees and the other excludes them, with different denominators.
- Personnel, custody, IT and data, research and legal, other and allocated costs, and external managers’ base and performance fees.
- 3.5 and 81.8 basis points.
- 2.3 basis points on internally managed assets; 27.7 on external mandates.
- .
- NOK 3.65 million; $352 000.
- $3.0 billion.
- Internal cost over the fee rate.
- $5.02 million a year.
- $5.02, $2.51 and $1.255 billion.
- times.
- $30 million a year.
- $5.02 billion, $2.51 billion and $1.255 billion.
- The same return, net of costs, as the external manager.
- What the costs buy: asset mix, strategies, and net returns.
- It creates portfolio-management, trading and research jobs; it reduces manager-selection and oversight work for the mandate.
- At 20 basis points the mandate is six times the break-even, so internal management is far cheaper if the team can match the manager’s net return; the decision rests on that capability, not on cost.
8.12 Interview questions
Interview question 8.1 ★ researcher
What is the difference between an asset owner and an asset manager, and how does it change a quant’s job?
Solution
Solution of Interview question 8.1.
An owner answers to beneficiaries or a government and chooses what to manage and whom to hire; a manager is paid fees to run mandates. At an owner a quant works on allocation, liabilities, risk and manager selection; at a manager on producing the mandated return.
What the interviewer is looking for: principal against agent, and the work that follows.
Interview question 8.2 ★ risk
A pension plan’s liabilities have a duration of 18 years and its bonds a duration of 6. What happens to its funding ratio when long rates fall, and what would you do about it?
Solution
Solution of Interview question 8.2.
Liabilities rise by about 18% per 1% fall in rates and the bonds by about 6%, so the funding ratio falls. Extend the duration of assets or add interest-rate swaps (receive fixed) to hedge part of the gap.
What the interviewer is looking for: duration mismatch and the hedge.
Interview question 8.3 ★★ researcher
An owner pays an external manager 50 basis points plus 20% of outperformance. What excess return must the manager expect to earn to be worth hiring over a 5-basis-point internal index portfolio?
Solution
Solution of Interview question 8.3.
Net excess to the owner is basis points against for the index portfolio: hire if , that is basis points a year, before any risk adjustment.
What the interviewer is looking for: fees on excess return, and a clean inequality.
Interview question 8.4 ★★ researcher, risk
Why does the strategic asset allocation dominate a large fund’s return, and what does that imply for where its best quants should work?
Solution
Solution of Interview question 8.4.
The allocation sets most of the portfolio’s risk and so the spread of its returns; selection within asset classes adds a smaller, less certain amount. The best quants should inform the allocation and risk, not only security selection.
What the interviewer is looking for: risk decomposition drives where effort pays.
Interview question 8.5 ★★ bank, risk
Which of your skills as a bank rates quant transfer to an insurer’s asset–liability team, and what would you have to learn?
Solution
Solution of Interview question 8.5.
Curves, duration and convexity, rates derivatives and hedging, XVA and collateral transfer; to learn: liability models, mortality and lapse, and the solvency capital rules.
What the interviewer is looking for: transferable rates skills and the new liability side.
Interview question 8.6 ★★★ researcher
Design a test of whether an owner’s internal equity team adds value net of its costs, given ten years of monthly returns of the team and its benchmark.
Solution
Solution of Interview question 8.6.
Regress the team’s monthly excess returns net of its costs on the benchmark (and factors), estimate alpha with a heteroskedasticity- and autocorrelation-robust error, and ask whether ten years give power: with a tracking error of 2% and a true alpha of 0.5%, the t-statistic after ten years is about 0.8.
What the interviewer is looking for: net of cost, robust errors, and power.