The Industry: Firms, Roles and Careers · Careers
14Pay Levels by Role, Firm Type and Seniority
Every public source of pay sees one slice. US visa filings see the base salaries offered for sponsored positions, and nothing of bonuses. The government’s occupational survey sees wages by industry and occupation, but excludes most bonuses and caps what it prints. Filed accounts see total staff cost per head, bonuses included, but average away the roles. Bank remuneration reports count only the people paid more than a million euros. Put side by side, the slices disagree by a factor of ten and more, and each is right about what it measures: in 2025 the median base salary offered in sponsored applications at the market makers of this book was $175 000, while one of them spent $2.1 million per UK employee on staff. This chapter builds ranges from each slice with its caveat, by role, by kind of employer and by seniority, and then joins them into the one number a reader most wants and no source prints: how total pay relates to base.
14.1 What each source measures
Five public sources carry pay figures for the industry. Each measures a different quantity over a different population, and none measures what a reader means by “pay”.
Definition 14.1 (Labor condition application, prevailing wage)
A labor condition application (LCA) is the attestation a US employer files with the Department of Labor before sponsoring a worker on an H-1B, H-1B1 or E-3 visa: the job title, occupation code, worksite, the offered wage or wage range, and the prevailing wage for the occupation and area. The prevailing wage is the wage the Department’s rules set as the minimum for the occupation, area and level; the employer must pay the greater of it and the actual wage it pays similar employees.
- Labour condition applications give the offered annual base of each sponsored position. A bonus counts toward the required wage only “if their payment is assured”, not when it is “contingent on some event such as the employer’s annual profits”, so the offered wage is base salary. The population is sponsored positions, not all staff.
- The occupational survey (OEWS) gives wage percentiles by industry and occupation. Its wages include “incentive pay, including commissions and production bonuses” but exclude “nonproduction bonuses”, which is where a discretionary bonus falls, and it marks the highest cells as top-coded.
- Filed accounts give staff costs over average headcount (chapter 11): every employee, every element of pay the year’s accounts charge, and the employer’s social costs, for one entity.
- Pay-ratio disclosures of US listed firms give the total pay of their median employee.
- Remuneration disclosures of banks and investment firms give counts and totals for the best-paid: the Pillar 3 tables of chapter 11 and the European Banking Authority’s high-earner reports.
Definition 14.2 (Top-coding, small-cell suppression)
Top-coding is the replacement of values above a threshold by a marker, so that a survey’s highest cells show only that they exceed it. Small-cell suppression is the rule of not publishing a statistic computed from too few observations, because it would describe identifiable individuals or be too noisy to use.
The occupational survey’s field descriptions still define # as “a wage equal to or greater than $115.00 per hour or $239 200 per year”, although the May 2025 file prints values above that line (none of the cells this book uses is marked); this chapter applies its own suppression to the visa filings: no cell is printed from fewer than ten applications, or from fewer than three employers, because a cell drawn from one or two employers would publish a firm’s pay.
Definition 14.3 (Median-employee pay, high earner)
Median-employee pay is the annual total compensation of the median employee of a US listed company, which its proxy statement discloses with the chief executive’s pay ratio. A high earner, in EU banking statistics, is an individual paid one million euros or more in a financial year; banks and investment firms report their numbers and pay to their supervisors, and the European Banking Authority publishes the aggregates.
14.2 Building ranges from labour-condition filings
The Department of Labor publishes every application it decides, a quarter at a time, in files of up to a few hundred thousand rows. The chapter reads the four quarterly files of fiscal years 2021 and 2025, deduplicated by case number.
Definition 14.4 (Standard Occupational Classification, wage level)
The Standard Occupational Classification (SOC) is the US federal statistical standard that assigns every worker to one of 867 detailed occupations; 13-2099.01 is “Financial Quantitative Analysts”. A wage level is one of four prevailing-wage levels an application is assigned to: I (entry), II (qualified), III (experienced) and IV (fully competent), chosen from the job’s requirements.
Method 14.5 (Ranges from labour condition applications)
- Stream each file row by row, reading only the needed columns; never the contact fields.
- Keep certified, full-time applications.
- Classify the employer by name with rules whose business model is sourced in an earlier chapter (twelve market makers, seven systematic funds, four platforms, nine banks, one asset manager, four exchanges), and the role by the job title, or by the SOC code when the title is generic.
- Annualise the lower end of the offered wage by its unit (year, month, two weeks, week, hour).
- Group by fiscal year, kind of employer, role and wage level; compute percentiles and a bootstrap interval for the median; suppress cells under ten applications or three employers.
As of September 2025 — What the visa filings contain for this book’s employers
| kind of employer | applications FY2021 | employers | applications FY2025 | employers |
|---|---|---|---|---|
| bank | 3 539 | 9 | 7 298 | 9 |
| market maker | 259 | 10 | 367 | 10 |
| systematic fund | 143 | 5 | 210 | 7 |
| multi-manager platform | 53 | 3 | 102 | 3 |
| exchange | 228 | 4 | 462 | 4 |
| asset manager | 200 | 1 | 369 | 1 |
Certified full-time applications with a role in the chapter’s families, US fiscal years (October to September), from the Department of Labor’s disclosure files. The asset manager’s cells come from one employer and are all suppressed.
The banks file twenty times as many applications as the market makers, because they employ many more people in technology; a statistic pooled over the industry would be a bank statistic. Every range below is therefore by kind of employer.
14.3 Ranges by role, firm type and seniority
| median offered base, FY2025 ($ thousand) | systematic fund | platform | market maker | bank | exchange |
|---|---|---|---|---|---|
| all roles | 215.0 | 190.5 | 175.0 | 154.3 | 130.8 |
| quantitative researcher or analyst | 220.0 | 190.0 | 175.0 | 158.1 | 107.1 |
| software engineer | 205.5 | 190.0 | 175.0 | 155.7 | 140.4 |
| trader | – | – | 195.0 | 235.0 | – |
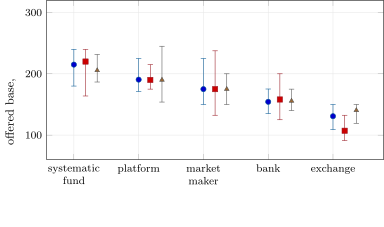
data/industry/lca_ranges.csv.The order by kind of employer is the same for both main roles: systematic funds offer the highest base, then the platforms, the market makers, the banks and the exchanges, with about $84 000 between the top and the bottom for all roles together (Figure 14.1). Within a kind, the spread is wide: the market makers’ interquartile range for quantitative researchers runs from $132 400 to $237 500. From fiscal 2021 to 2025 the median across all roles rose 22.9% at the systematic funds and at the banks, 18.7% at the platforms, 16.7% at the market makers and 7.9% at the exchanges; US consumer prices rose 18.8% over the same calendar years, so in real terms offered base was flat to slightly up, and down at the exchanges.
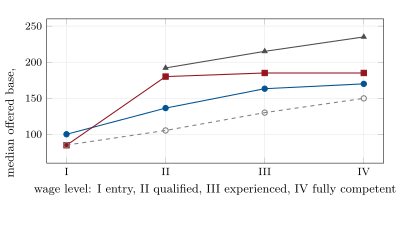
data/industry/lca_ranges.csv, from the Department of Labor’s disclosure files through in_lca_derive.py.The wage level is the only seniority measure the filings carry, and it is a weak one where pay is far above the floor (Figure 14.2). At the banks and the exchanges the median rises with the level, as the Department’s definitions intend: at the banks from $100 000 at level I to $169 900 at level IV. At the market makers the median is $84 800 at level I and $180 000 to $185 000 at levels II to IV: the employer picks the level that describes the job’s requirements, and when the offer is far above every level’s prevailing wage the choice constrains nothing. For quantitative researchers at the market makers the level-III median is below the level-II one.
The occupational survey is the check from outside the visa system. In May 2025, software developers in the securities and investments industry had a median wage of $163 290 (interquartile range $132 650 to $203 840), and in banks (credit intermediation) $136 620; financial and investment analysts in securities $124 370. The filings’ medians for software engineers, $175 000 at the market makers, $155 700 at the banks and $140 400 at the exchanges, sit in the same range: the sponsored positions of these employers are paid like the industry’s, not below it.
14.4 From base to total: what staff cost per head says about bonuses
Base is the part the filings show; total pay is the part a candidate cares about. The only filed number that contains the bonuses of a whole firm is staff cost per head, and the only filed number that describes a typical employee is median-employee pay. Put against each other and against the visa filings, they bound the missing ratio.
Method 14.6 (Implied ratio of total pay to base)
For a kind of employer, divide staff cost per head from filed accounts by the median offered base of the same kind in the visa filings. The result bounds the ratio of total pay to base from above, because staff cost includes the employer’s social costs, benefits and deferred awards vesting, and it is a mean over a skewed distribution; and it mixes two populations, all employees of one entity against sponsored positions of several.
Example 14.7 (Three kinds of employer)
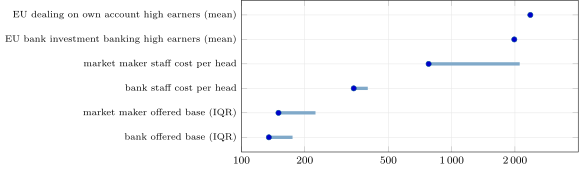
A market maker’s UK partnership spent between $0.78 million and $2.11 million per employee in 2023–2025 (chapter 11) against a median offered base of $175 000 at the market makers: an implied ratio of 4.4 to 12.0. A London systematic manager spent $4.11 million per employee in its year to January 2025 against the systematic funds’ $215 000: 19.1. A US bank’s compensation and benefits were $342 000 to $399 000 per employee in 2023–2025 against the banks’ $154 260: 2.2 to 2.6.
The ratio’s range across kinds of firm is the chapter’s central finding. At a bank, total pay is a small multiple of base for the average employee, because the bank employs many people whose pay is mostly base; at the market maker and the systematic manager, whose staff are few and whose revenue per head is high (chapter 12), the average is many times the typical base. The caveats cut both ways: the entity’s partners are outside its staff costs, which understates the top, and its average includes a few very large awards, which overstates the typical employee’s.
Median-employee pay shows how much the average overstates the typical employee even where pay is moderate. For 2025 the Intercontinental Exchange’s median employee was paid $112 902 against staff cost per head of $152 834, 1.35 times as much; Nasdaq’s $101 885 against $146 142 (1.43); Morgan Stanley’s $136 396 against $352 000 (2.58). A mean over a bank’s whole workforce is two and a half times its median employee’s pay; in a firm whose pay is more concentrated, the gap is larger.
14.5 The tail: high-earner counts and risk-taker disclosures
As of April 2026 — The best-paid in EU banks and investment firms
| 2024, EU | high earners | mean total pay (€ ) | variable over fixed |
|---|---|---|---|
| banks, all areas | 2 266 | 1 830 502 | 0.99 |
| banks, investment banking | 904 | 1 757 914 | 1.23 |
| investment firms, all areas | 288 | 2 088 931 | 3.59 |
| investment firms, dealing on own account | 97 | 2 094 482 | 8.14 |
European Banking Authority, high earners 2024, Annexes II and III (published April 2026): 2 554 high earners in all (2 343 in 2023). One UK bank’s own report counts 717 of its staff paid € 1 million or more in 2025 (chapter 11).
The tail is where the kinds of firm differ most. Among EU high earners, those in banks’ investment banking were paid variable pay about equal to fixed on average, because the bonus cap still binds banks in the EU (chapter 15); those in investment firms dealing on their own account, whom the cap does not cover, were paid variable pay 8.14 times fixed, and the 97 of them averaged € 2.09 million, about $2.37 million at 2025’s average rate. These are counts of people above a threshold, so they say nothing about how many are near it, and they cover EU-authorised institutions only.
in_paylevels and the chapter’s tables.14.6 Tutorial: the labour-condition pipeline
Goal. Rebuild the chapter’s ranges from the Department of Labor’s files, and join them to the other slices. End state: the range table, Figures 14.1, 14.2 and 14.3.
- Fetch. The eight quarterly files (fiscal 2021 and 2025, about 1.2 GB) go to a scratch directory; they are never committed.
Stream.
firm.paydata.read_lca(path, keep)yields one row at a time from the read-only workbook (Listing 14.1); the chapter’s scriptin_lca_derive.pycaches the kept rows (kind, role, level, wage, nothing else) so the raw files are read once, under a memory cap.def read_lca(path, keep=None): """Stream an LCA disclosure workbook row by row, keeping LCA_COLS; the file is never loaded whole.""" import openpyxl # imported here so the rest of the module needs NumPy only wb = openpyxl.load_workbook(path, read_only=True, data_only=True) try: rows = wb.worksheets[0].iter_rows(values_only=True) header = [str(h).strip().upper() if h is not None else "" for h in next(rows)] idx = {c: header.index(c) for c in LCA_COLS if c in header} for r in rows: d = {c: r[i] for c, i in idx.items()} if keep is None or keep(d): yield d finally: wb.close()Listing 14.1. Stream a disclosure workbook row by row, keeping only the needed columns. code/firm/paydata/firm_paydata.py - Classify and summarise.
classifywithdata/industry/lca_employers.csv,classify_role,annualiseandcell(percentiles, bootstrap interval, suppression) writelca_ranges.csv,lca_titles.csvandlca_counts.csv. - Join.
in_paylevels.implied_ratiosandmedian_ratiosput the filings’ staff costs and the proxies’ medians against the ranges. The tests read only the committed tables and a synthetic workbook written at test time.
What to change next. Add fiscal 2022 to 2024 and follow each kind’s median through the rate rises; split the banks’ software engineers by worksite state and compare with the state’s occupational survey.
14.7 Build: the pay-evidence reader
Purpose. Read the public pay sources into ranges and records that carry their caveats, for this chapter, the role chapters (16–25) and chapter 30’s choice.
Interface. firm.paydata: LCA_COLS; read_lca(path, keep); annualise(amount, unit); Rule, load_rules, classify(name, rules); ROLE_RULES, classify_role(title, soc); MIN_CELL; cell(values, rng, n_boot); PayEvidence(source, measure, population, year, lo, hi, unit, caveat). openpyxl in read-only mode and NumPy.
Rules. Stream, never load a whole file; read no contact or personal field; certified full-time applications only; annualise the lower end of the offered range; suppress any cell under ten applications (the chapter’s script adds three employers); every source becomes a record with its measure, population and caveat.
Acceptance tests. code/firm/paydata/tests/: a synthetic workbook is streamed and filtered without its contact column; units annualise; employer and role rules classify and fall through to the SOC code; a nine-row cell is suppressed and a hundred-row cell gives the right percentiles and an interval around its median.
Stretch. The occupational survey by metropolitan area; PERM (permanent labour certification) filings, which carry senior offers; a small-area estimate that borrows strength across kinds of employer.
Sources and further reading
- US Department of Labor, OFLC, LCA disclosure files for fiscal years 2021 and 2025, and the performance-data page; 20 CFR 655.731; OFLC Prevailing Wage Determination Policy Guidance (2009).
- BLS, Standard Occupational Classification; O*NET 13-2099.01; OEWS May 2025 national industry-specific estimates and technical notes.
- 17 CFR 229.402(u); proxy statements for 2025 of the Intercontinental Exchange, Nasdaq, Morgan Stanley and Coinbase.
- European Banking Authority, high earners 2024 and annexes; its legal notice.
- The Goldman Sachs Group, Form 10-K for 2025; chapters 11–13 for the filed accounts and the Pillar 3 report.
14.8 Exercises
Exercise 14.1 ★
An application states a wage of $95 an hour. What annual base does the chapter’s rule record? And for $16 000 a month?
Solution
Solution of Exercise 14.1.
a year; .
Exercise 14.2 ★
Using the table of medians, by how much does the systematic funds’ median offered base for all roles exceed the exchanges’, in dollars and in per cent?
Solution
Solution of Exercise 14.2.
, or 64.4% above the exchanges’ median.
Exercise 14.3 ★
Compute the ratio of staff cost per head to median-employee pay for the Intercontinental Exchange in 2025, from staff costs of $1 963 million and 12 844 employees.
Solution
Solution of Exercise 14.3.
Staff cost per head ; against median-employee pay of $112 902 the ratio is 1.35.
Exercise 14.4 ★★
Why can a bonus not be part of the wage in a labour condition application, and what does that make the filings measure?
Solution
Solution of Exercise 14.4.
The rules let a bonus count toward the required wage only if its payment is assured; a discretionary bonus depends on the year’s results, so the employer states the base it guarantees. The filings measure offered base salary, the floor of pay, for sponsored positions.
Exercise 14.5 ★★
The market makers’ level-III median for quantitative researchers is below the level-II one. Give two explanations that do not involve paying experienced people less.
Solution
Solution of Exercise 14.5.
The level is chosen from the job’s stated requirements against the occupation’s prevailing wages, not from the offer; when every offer is far above every level’s floor, the choice does not order the offers. And the cells are small and mixed: 26 applications at level III against 81 at level II, from different employers, locations and occupations, so composition can reverse the order.
Exercise 14.6 ★★
Deflate the market makers’ median offered base from fiscal 2021 to 2025 dollars with the consumer price index (114.33 in 2021, 135.83 in 2025) and compare with the fiscal 2025 median.
Solution
Solution of Exercise 14.6.
in 2025 dollars, against $175 000: offered base fell by 1.8% in real terms.
Exercise 14.7 ★★★
Coding. Using lca_ranges.csv, list every fiscal-2025 cell of the market makers that is suppressed, with its number of applications and employers, and say which rule suppressed each.
Solution
Solution of Exercise 14.7.
Fourteen cells: the level-unknown cell for all roles (2 applications); machine learning and data at levels II, III and IV (6, 2, 3); portfolio managers at level II and in all (1 each); quantitative developers at levels II and IV and in all (2, 3, 5); risk at levels II and III and in all (2, 1, 3); traders at level I and with no level (3, 2). Every one is suppressed by the ten-application rule; none by the three-employer rule alone.
Exercise 14.8 ★★★
Find the flaw. “The market makers’ median base is $175 000 and their staff cost per head $2.1 million, so a new graduate there can expect total pay of about $2 million.”
Solution
Solution of Exercise 14.8.
The $2.1 million is one UK entity’s mean over all its employees, including social costs and awards to the most senior; the median base describes sponsored positions of ten firms. A graduate is paid a level-I or level-II base and a first bonus far below the mean; the ratio of 4.4 to 12.0 is an upper bound for the average, not an expectation for anyone.
14.9 Problem: Four Sources, One Number
Problem 14.1
Weekend problem — four sources, one number
A candidate choosing between a bank and a market maker wants one number: how much larger than base is total pay at each. No source prints it. Build it.
Part I — The sources.
- Define a labour condition application and the prevailing wage. What does the wage in the filing measure?
- What does the occupational survey include and exclude from wages, and what does it top-code?
- Define top-coding and small-cell suppression, and state the chapter’s suppression rule.
- Define median-employee pay and a high earner.
- For each of the five sources, name what it measures and over whom.
Part II — The ranges.
- State the method for building ranges from the filings.
- Give the number of applications and employers by kind in fiscal 2025.
- Give the median offered base by kind for all roles, quantitative researchers and software engineers.
- How did the medians change from fiscal 2021 to 2025, nominally and after inflation?
- What does the wage level show at the banks and at the market makers, and why the difference?
Part III — Base to total.
- State the method for the implied ratio of total pay to base and its biases.
- Compute it for the market maker, the systematic manager and the bank.
- Compare staff cost per head with median-employee pay at three listed firms.
- How does the occupational survey compare with the filings for software engineers?
- What do the EU high-earner figures add, and what can they not say?
Part IV — The verdict.
- State the named result: the implied ratio of total pay to base by kind of employer, as a range with its caveats.
- Which caveat most inflates the market maker’s ratio for a typical employee?
- Which slice would narrow the range most if it were public?
- What should the candidate ask each employer to replace the ratio with facts?
- In two sentences, answer the candidate.
Solution
Solution of Problem 14.1.
- The attestation a US employer files before sponsoring a worker, with the offered wage and the prevailing wage, the legal minimum for the occupation, area and level; the offered base salary.
- It includes base, guaranteed pay, commissions and production bonuses, and excludes nonproduction bonuses; it marks wages of $115 an hour or $239 200 a year and above with #.
- Replacing values above a threshold by a marker; not publishing statistics from too few observations; no cell under ten applications or three employers.
- The total pay of a listed firm’s median employee; a person paid € 1 million or more a year in EU banking statistics.
- Filings: offered base, sponsored positions; survey: wages without discretionary bonuses, all employees of an industry and occupation; accounts: staff cost per head, one entity’s employees; pay ratio: median employee’s total pay, one listed firm; remuneration reports: counts and pay of those above € 1 million, banks and investment firms.
- As the method: stream, keep certified full-time, classify employer and role, annualise, group and summarise with suppression.
- Banks 7 298 (9 employers), market makers 367 (10), systematic funds 210 (7), platforms 102 (3), exchanges 462 (4); the asset manager’s 369 come from one employer and are suppressed.
- All roles: $215 000, $190 500, $175 000, $154 300, $130 800 (systematic, platform, market maker, bank, exchange); quantitative researchers $220 000, $190 000, $175 000, $158 100, $107 100; software engineers $205 500, $190 000, $175 000, $155 700, $140 400.
- Up 22.9% (systematic funds, banks), 18.7% (platforms), 16.7% (market makers), 7.9% (exchanges), against 18.8% inflation: flat to slightly up in real terms, down at the exchanges.
- At the banks the median rises from $100 000 at level I to $169 900 at level IV; at the market makers it jumps from $84 800 to $180 000–185 000 and then stays flat, because offers far above the floor are not ordered by it.
- Staff cost per head over the same kind’s median offered base; it overstates the typical ratio (social costs, benefits, deferred awards, a mean over a skewed distribution) and mixes populations; it understates the top where partners are outside staff costs.
- Market maker 4.4 to 12.0; systematic manager 19.1; bank 2.2 to 2.6.
- Intercontinental Exchange 1.35, Nasdaq 1.43, Morgan Stanley 2.58 times median-employee pay.
- Software developers’ median in securities $163 290 (banks $136 620) against the filings’ $140 400 to $175 000: the same range.
- The tail’s size and shape by kind of firm (variable over fixed 0.99 in banks, 8.14 in investment firms dealing on own account); not how many are near the threshold, nor anything outside EU-authorised institutions.
- Market maker 4.4 to 12.0, systematic manager 19.1, bank 2.2 to 2.6 times the kind’s median offered base; upper bounds for the average employee, from one entity or firm each.
- The mean over a skewed distribution: a few very large awards raise the per-head cost far above a typical employee’s pay.
- Median total pay by role at private firms, which none publishes.
- The base, the bonus range paid in the last three years at her level, the deferral and its vesting, and the share of people in the role who received more than the base again.
- At the bank, expect total pay of roughly two to two and a half times base on average; at the market maker the average is several times larger but spread far wider, and the typical first years sit much nearer base than the average suggests.
14.10 Interview questions
Interview question 14.1 ★ researcher, mle
You have wages in five units (year, month, two weeks, week, hour). Write the conversion and say what you would do with a range “from $150 000 to $250 000”.
Solution
Solution of Interview question 14.1.
Multiply by 1, 12, 26, 52 or 2 080 hours; for a range, record both ends and use the lower end as the guaranteed wage, reporting the range’s width as information about pay setting.
What the interviewer is looking for: units as data, and a stated convention for ranges.
Interview question 14.2 ★ researcher
Why report a bootstrap interval for a median rather than a standard error?
Solution
Solution of Interview question 14.2.
The median’s sampling distribution depends on the data’s density at the median, which is unknown and often lumpy (round salaries); the bootstrap estimates it from the data without a formula.
What the interviewer is looking for: no parametric form for the median’s error; lumpy data.
Interview question 14.3 ★★ developer
Design a job that reads a 300 MB spreadsheet in bounded memory and writes only aggregates. What can go wrong?
Solution
Solution of Interview question 14.3.
Stream rows with a read-only reader, keep a filter and running aggregates, write a small cache of kept rows; cap memory at the operating-system level. Risks: a header change between files, units and blanks, duplicate cases across files, one row blowing up the parser, and personal fields reaching output.
What the interviewer is looking for: bounded memory by construction, schema checks, and privacy by column selection.
Interview question 14.4 ★★ researcher, risk
A cell has 12 observations from two employers. Should you publish its median? Why or why not?
Solution
Solution of Interview question 14.4.
No: with two employers, the median is close to one firm’s pay, which the firm did not choose to publish, and a reader who knows one employer’s figure can infer the other’s. Merge the cell or suppress it.
What the interviewer is looking for: disclosure risk, not only noise.
Interview question 14.5 ★★ bank, trader
Why might variable pay be about equal to fixed pay for bank investment bankers in the EU, but eight times fixed pay at investment firms dealing on own account?
Solution
Solution of Interview question 14.5.
The EU’s cap limits variable pay to 100% of fixed (200% with approval) at banks, which raises fixed pay and compresses the ratio; the cap has not applied to investment firms since 2021, and a firm dealing on its own account pays from its trading result.
What the interviewer is looking for: the regulatory cap, and who it covers.
Interview question 14.6 ★★★ researcher
Visa filings cover only sponsored positions. How could selection bias their pay ranges, and how would you test for it?
Solution
Solution of Interview question 14.6.
Sponsored workers may be hired into particular roles, levels or locations, and may accept different offers; the ranges then differ from the firm’s. Compare the filings’ ranges with the occupational survey for the same industry, occupation and area, and with offers of the same employer to non-sponsored hires if any are public.
What the interviewer is looking for: selection into sponsorship, and an external benchmark.