The Industry: Firms, Roles and Careers · Careers
17Quantitative Researcher
A researcher whose signal trades every day and earns a Sharpe ratio of 2 can show, within a year, that the result is not luck. A researcher whose signal rebalances monthly and earns a Sharpe ratio of one-half needs fifteen and a half years of live results to show the same. The two carry the same title and may sit in the same building, but one learns from the market every month and the other perhaps twice in a career. This chapter describes the quantitative researcher at each kind of employer, measures the speed at which the role’s work can be judged, and follows what a researcher owns, ships and comes from; the pay evidence of chapter 14 sits beside it.
| Role card: quantitative researcher | |
|---|---|
| employers | systematic funds, market makers, platforms, banks, asset managers |
| horizon of decisions | seconds to months |
| P&L | shares it, through credit for signals |
| reports to | head of research or a portfolio manager |
| occupation codes in filings | 13-2099.01, 15-2041, 15-2031; titles with “quantitative research”, “quantitative analyst” |
| where the series teaches it | Book 7, chapters 1 and 15; Book 16, chapter 9 |
17.1 Three research jobs: high frequency, medium frequency, asset manager
Definition 17.1 (Quantitative researcher)
A quantitative researcher is a person whose work is to find, test and maintain statistical regularities that a firm can trade or use to manage risk, and to turn them into specifications, models or code that the firm’s trading systems run.
One market maker describes the role in its own words: quantitative researchers “focus on solving complex problems through deep, independent research. Their work shapes trading strategies, enhances execution, and improves position management. Some projects start with a quick idea, while others involve longer investigations and iteration.” Three settings give the words different content.
- High frequency (chapter 2): signals over seconds to minutes, in the order book’s own data; the work is close to the trading system, and a change is judged within days on thousands of independent trades (Book 11).
- Medium frequency (chapters 4 and 6): signals over days to weeks, in prices, fundamentals and alternative data; a signal joins a portfolio with others and is judged over months (Books 7 and 8).
- Asset management (chapter 8): factor and allocation models over months to years, where most of the evidence comes from history, and live results arrive slowly (Book 8).
A bank’s quantitative analysts work mainly on pricing and risk models rather than on alpha; chapter 18 covers them.
17.2 Horizon, data and feedback speed
Definition 17.2 (Feedback speed)
The feedback speed of a research role is the rate at which its work produces evidence that can tell skill from luck: the calendar time needed for a result of stated size to become statistically distinguishable from zero.
Method 17.3 (Time to significance)
Let a strategy’s true annual Sharpe ratio be , rebalanced times a year, with independent returns. The estimated per-period Sharpe ratio has standard error after periods, where (Lo, 2002). The number of periods needed for the estimate to be standard errors from zero is
and the calendar time is years. With , is close to periods, and the calendar time close to years.
The formula says that calendar time depends on the Sharpe ratio, not on the horizon: a Sharpe ratio of 2 needs about a year, of 1 about four years, of one-half about fifteen. The horizon enters through the Sharpe ratio a signal can reach. By the fundamental law of active management (Grinold, 1989; Book 7, chapter 15), a signal with skill per independent bet and independent bets a period earns : shorter horizons give more bets a year and so higher Sharpe ratios, for the same skill per bet.
Example 17.4 (The same skill at six horizons)
Take an illustrative skill of 0.02 per bet over 50 independent bets each rebalance. The time to significance is then about 194 rebalance periods at every horizon, because does not depend on : 0.7 days at a one-minute horizon, 43 days at one hour, 0.77 years at one day, 3.73 years at one week, 16.2 years at one month and 48.5 years at one quarter (Figure 17.1).
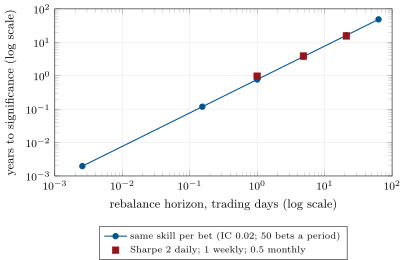
in_researcher.law_curve and named.Feedback speed shapes the job. A high-frequency researcher can try many ideas a year and learn which work; a medium-frequency researcher must rely more on history, on out-of-sample discipline and on the research controls of Book 7, because the market will not say in time; an asset-management researcher will rarely see a live result that proves a model before the model has been used for years. It also shapes careers: the researcher whose results are judged fast can build a record fast (chapter 28), and pay can follow results more closely (chapter 13).
17.3 Ownership of P&L and of credit
A researcher rarely owns a book. The profit and loss belongs to a portfolio manager, a desk or the firm, and the researcher is paid for contributing to it. How the contribution is measured is the firm’s credit attribution (Book 16, chapter 9): signals in a combined portfolio earn together, and dividing their joint profit among their authors is a choice, not a fact. The three settings differ.
- At a platform (chapter 5) the researcher works for a portfolio manager whose book is judged on its own result; the researcher’s credit is the manager’s decision.
- At a systematic fund (chapter 4) a signal joins a research portfolio run centrally; credit follows the firm’s attribution method, and the firm owns the signal.
- At a market maker (chapters 2–3) research improves quoting and hedging that many traders use; credit is shared by design, and pay follows the desk’s or the firm’s result.
A candidate should ask how credit is measured and who decides it; chapter 13’s structures sit on top of the answer.
17.4 What a researcher ships
A researcher’s product is not a paper. It is a change that the firm’s systems run: a signal with its specification, the data it needs and how it is computed; the tests and the research log that justify it (Book 7, chapter 1); code that meets the firm’s standards or a specification that developers implement (chapter 19); and a monitoring plan that says how the firm will know if it stops working. In the market maker’s words, researchers “design and optimize trading algorithms”. Research reviews decide what ships; most of what a researcher tries does not.
17.5 Where researchers come from
The occupational classification that the filings use for most of the role, 13-2099.01 “Financial Quantitative Analysts”, is in O*NET’s highest preparation band: “Most of these occupations require graduate school. For example, they may require a master’s degree, and some require a Ph.D.” In fiscal 2025, 1 018 of the applications classified to the role family carried that code, 156 statisticians (15-2041) and 52 operations research analysts (15-2031); the role draws on mathematics, statistics, physics, computer science and economics, and chapter 29 follows the pipelines.
As of September 2025 — What quantitative researchers are paid: the public evidence
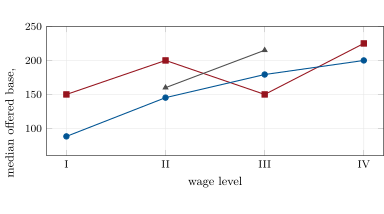
US labour condition applications, fiscal 2025, role family “quantitative researcher or analyst” (titles, or SOC 13-2099.01 when the title is generic): median offered base $220 000 at systematic funds (120 applications, 5 employers), $190 000 at platforms (45, 3), $175 000 at market makers (131, 9), $158 100 at banks (825, 9) and $107 100 at exchanges (35, 4). By wage level at the banks: $88 300 (I), $145 300 (II), $179 335 (III), $200 000 (IV); at the market makers $150 000, $200 000, $150 000, $225 000. The occupational survey for financial specialists in the securities industry, May 2025: median $100 190, 10th–90th percentile $55 370–222 100. Base salary only.
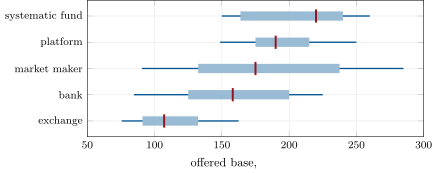
data/industry/lca_ranges.csv, through in_researcher.pay.The order of employers matches chapter 14’s for all roles. The banks’ filings show the clearest seniority ladder (Figure 17.3); the market makers’ do not, for the reason chapter 14 gave: offers far above the prevailing wage are not ordered by the level the employer states.
17.6 Tutorial: how long until you know?
Goal. Put numbers on the role’s feedback speed and beside its pay evidence. End state: Figures 17.1, 17.2 and 17.3.
- Pay.
firm.roles.lca_cells(rows, role)with the rolequant researcher, at all levels and by level;data/industry/lca_titles.csvgives the occupation codes behind the role. Time to significance.
periods_to_significance(S, m)andyears_to_significance(Listing 17.1).def periods_to_significance(sr, periods_per_year, z=1.96): """Periods of data needed before an estimated Sharpe ratio of true value sr (annual) is z standard errors from zero, with IID returns: n = z^2 (1 + s^2 / 2) / s^2 where s is the per-period Sharpe ratio (Lo 2002).""" s = sr / math.sqrt(periods_per_year) return z * z * (1.0 + s * s / 2.0) / (s * s) def years_to_significance(sr, periods_per_year, z=1.96): return periods_to_significance(sr, periods_per_year, z) / periods_per_yearListing 17.1. Periods and years of data before a Sharpe ratio is distinguishable from zero, with Lo’s standard error. code/firm/roles/firm_roles.py - The law.
fundamental_law_sr(IC, N, m)turns skill and breadth into a Sharpe ratio for each horizon.
For the chapter’s three strategies: a Sharpe ratio of 2 at a daily horizon needs 0.97 years (244 trading days); 1 at a weekly horizon, 3.88 years (202 weeks); one-half at a monthly horizon, 15.53 years (186 months).
What to change next. Let returns be autocorrelated and use Lo’s adjusted standard error; count the trials a researcher ran and deflate the Sharpe ratio for them (Book 7).
17.7 Build: the researcher’s card and feedback speed
Purpose. Add the quantitative researcher to the role registry, and the functions that measure how fast research is judged.
Interface. firm.roles: the quant researcher card; periods_to_significance(sr, periods_per_year, z); years_to_significance; fundamental_law_sr(ic, breadth, periods_per_year).
Rules. Returns are IID unless the caller adjusts; the Sharpe ratio is annual; skill and breadth are the caller’s, labelled illustrative.
Acceptance tests. code/firm/roles/tests/: the time to significance is years to first order and exactly the formula’s value; it falls with the Sharpe ratio; under the fundamental law the number of periods is the same at every horizon.
Stretch. Autocorrelation and non-normal returns; multiple-testing deflation; a Bayesian version that updates a prior on skill.
Sources and further reading
- Lo, A. W. (2002), The statistics of Sharpe ratios, Financial Analysts Journal 58(4), 36–52.
- Grinold, R. C. (1989), The fundamental law of active management, Journal of Portfolio Management 15(3), 30–37.
- Optiver, “Breaking down the trading industry”; O*NET, 13-2099.01.
- Chapter 14’s tables from the Department of Labor’s LCA files and the BLS occupational survey.
17.8 Exercises
Exercise 17.1 ★
How many years of daily returns are needed before a true Sharpe ratio of 1.5 is distinguishable from zero at 95%?
Solution
Solution of Exercise 17.1.
with : 1.72 years, close to .
Exercise 17.2 ★
Under the fundamental law with skill 0.02 and 50 bets a period, what is the annual Sharpe ratio at a weekly horizon?
Solution
Solution of Exercise 17.2.
.
Exercise 17.3 ★
From the dated box, which kind of employer offers quantitative researchers the highest median base, and by how much does it exceed the banks’?
Solution
Solution of Exercise 17.3.
The systematic funds, at $220 000, $61 900 or 39.2% above the banks’ $158 100.
Exercise 17.4 ★★
Show that under the fundamental law the number of periods to significance does not depend on the horizon.
Solution
Solution of Exercise 17.4.
With , the per-period Sharpe ratio is , which does not involve ; so does not either. Only the calendar length of a period changes with the horizon.
Exercise 17.5 ★★
A researcher’s monthly signal has shown a Sharpe ratio of 0.8 over three years of live trading. Is that evidence of skill?
Solution
Solution of Exercise 17.5.
Its t-statistic is about , below 1.96: not yet evidence. A true Sharpe ratio of 0.8 at a monthly horizon needs about 6.2 years to be distinguishable from zero.
Exercise 17.6 ★★
Why might a platform researcher’s credit depend more on one person’s judgement than a systematic fund researcher’s?
Solution
Solution of Exercise 17.6.
The platform researcher works for a portfolio manager who decides credit within the book; the systematic fund divides credit by a firm-wide attribution method, which is a rule rather than one person’s view.
Exercise 17.7 ★★★
Coding. Returns with first-order autocorrelation inflate the variance of the annualised Sharpe ratio by about . Recompute the time to significance of the weekly strategy with .
Solution
Solution of Exercise 17.7.
The time scales with the variance: years instead of 3.88.
Exercise 17.8 ★★★
Find the flaw. “Our monthly strategy has a backtest Sharpe ratio of 1.2 over 20 years, so it will be proven live within three years.”
Solution
Solution of Exercise 17.8.
A true Sharpe ratio of 1.2 at a monthly horizon needs 2.83 years to be distinguishable from zero, so three years is barely enough even if the live Sharpe ratio equals the backtest’s; but backtests overstate it (selection among trials, costs, capacity), and a lower live Sharpe ratio takes much longer: at 0.6, about 11 years.
17.9 Problem: How Long until You Know?
Problem 17.1
Weekend problem — how long until you know?
A graduate with offers in high-frequency research and in a monthly-rebalancing systematic fund asks how quickly each job would tell her whether she is good at it.
Part I — The role.
- Define a quantitative researcher; describe the three research settings.
- How does a market maker describe the role?
- How does a bank’s quantitative work differ?
- Define feedback speed.
- State the role card.
Part II — The statistics.
- State Lo’s standard error of the Sharpe ratio under IID returns.
- Derive the number of periods to significance.
- Why does calendar time depend on the Sharpe ratio rather than the horizon?
- State the fundamental law and what it implies about horizon.
- Give the times for the six horizons of the example.
Part III — The job.
- Who owns the P&L at a platform, a systematic fund and a market maker?
- What does a researcher ship?
- Where do researchers come from, and what preparation does the occupation require?
- What does the pay evidence show by employer and by level?
- Why do the market makers’ filings not show a seniority ladder?
Part IV — The verdict.
- State the named result: the time to reject a zero Sharpe ratio for a Sharpe ratio of 2 at a one-day horizon, 1 at one week and 0.5 at one month.
- What would autocorrelation do to these times?
- What can a researcher in a slow-feedback job do to learn faster?
- How should the difference affect how she judges her first two years in each job?
- In two sentences, answer her.
Solution
Solution of Problem 17.1.
- A person who finds, tests and maintains tradable regularities and turns them into what systems run; high frequency (seconds to minutes), medium frequency (days to weeks), asset management (months to years).
- Deep, independent research that shapes strategies, execution and position management, from quick ideas to longer investigations, designing and optimising trading algorithms.
- It works mainly on pricing and risk models rather than on alpha (chapter 18).
- The rate at which the role’s work produces evidence that tells skill from luck.
- Employers: systematic funds, market makers, platforms, banks, asset managers; horizon seconds to months; shares the P&L through credit; reports to a head of research or a portfolio manager; SOC 13-2099.01, 15-2041, 15-2031.
- for the per-period Sharpe ratio after periods.
- gives .
- years, since and the term is small.
- : shorter horizons give more bets a year and higher Sharpe ratios for the same skill.
- 0.7 days (minute), 43 days (hour), 0.77 years (day), 3.73 years (week), 16.2 years (month), 48.5 years (quarter).
- The portfolio manager; the firm, centrally; the desk or the firm, shared.
- A signal with its specification, data and code or implementable specification, the tests and research log, and a monitoring plan.
- Mathematics, statistics, physics, computer science, economics; graduate school for most of the occupation.
- Medians from $107 100 (exchanges) to $220 000 (systematic funds); at banks a ladder from $88 300 to $200 000.
- Offers far above the prevailing wage are not ordered by the stated level.
- 0.97 years (Sharpe 2, daily), 3.88 years (1, weekly), 15.53 years (0.5, monthly).
- Lengthen them, by the factor that inflates the Sharpe ratio’s variance.
- Use more history out of sample, more breadth in tests, and careful research controls; learn from the fast parts of the job (execution, data quality) while the slow ones accrue.
- In the fast job, results will judge her within a year; in the slow one, her first two years say little about her skill, and her process and reviews carry more weight.
- The high-frequency job will tell her within a year whether her ideas work; the monthly fund will not for many years, so choose it only if she values the kind of work more than the speed of the verdict.
17.10 Interview questions
Interview question 17.1 ★ researcher
A strategy’s daily Sharpe ratio estimate is 0.1 over 400 days. What is its annualised value, and roughly its standard error?
Solution
Solution of Interview question 17.1.
Annualised ; per-period standard error , annualised about 0.80.
What the interviewer is looking for: annualisation by and a standard error near .
Interview question 17.2 ★ researcher, trader
Why do high-frequency strategies often have high Sharpe ratios and low capacity?
Solution
Solution of Interview question 17.2.
Many small independent bets a day raise the Sharpe ratio; but each bet’s edge is small and the liquidity at that horizon is limited, so the profit cannot scale with capital.
What the interviewer is looking for: breadth versus market impact.
Interview question 17.3 ★★ researcher
You tried 200 signals and the best has a backtest t-statistic of 3.5. What do you conclude?
Solution
Solution of Interview question 17.3.
With 200 trials the best t-statistic of 3.5 is weaker than it looks: correct for multiple testing (for example a Bonferroni or a deflated Sharpe ratio) and test it out of sample before believing it.
What the interviewer is looking for: multiple testing and out-of-sample discipline.
Interview question 17.4 ★★ researcher, mle
How would you decide that a live signal has stopped working?
Solution
Solution of Interview question 17.4.
Set in advance a statistical test on live results against the expected distribution (for example a drawdown or a running t-statistic beyond a bound), check its inputs and implementation first, and decide on evidence, not on one bad month.
What the interviewer is looking for: a pre-registered stopping rule.
Interview question 17.5 ★★ researcher, developer
What must a signal’s specification contain so that a developer can implement it without you?
Solution
Solution of Interview question 17.5.
Inputs and their timing, every transformation with parameters, the universe, the output’s meaning and scale, reference values for test cases, and the conditions under which it should not trade.
What the interviewer is looking for: reproducibility from the document alone.
Interview question 17.6 ★★★ researcher
Two signals share 60% of their positions. How would you divide the credit for their joint profit?
Solution
Solution of Interview question 17.6.
Attribute by a stated rule, for example the marginal contribution of each to the combined portfolio (with and without it), or a Shapley value over the two; say which, since the shared positions make any split a choice.
What the interviewer is looking for: marginal or Shapley attribution, and honesty that it is a convention.