The Industry: Firms, Roles and Careers · Careers
6Medium-Frequency Proprietary Shops
Most proprietary trading firms are small. At the end of 2024 the US broker-dealer regulator placed 103 of the 3 249 broker-dealers it oversees in its proprietary-trading and market-making business segments; 93 of them had 150 registered representatives or fewer, and none had 500. Across all broker-dealers, almost half had ten registered people or fewer, while the 149 largest employed 82% of all registered representatives. The thousand-person firms of chapters 2 to 4 are the tail of a long distribution whose body is firms of a few dozen people, many of them trading at horizons of minutes to days. This chapter describes that body: what medium frequency means, how firm sizes are distributed, how firms enter and leave, and the arrangements — profit splits, arcades, funded-trader schemes — that a job seeker meets at the small end, some of them not jobs at all.
6.1 Medium frequency: horizons, capacity and infrastructure
Definition 6.1 (Medium-frequency trading)
Medium-frequency trading is systematic trading whose positions last from minutes to a few days: slower than high-frequency trading, whose edge is measured in microseconds and holding periods in seconds (Book 10, chapter 24), and faster than the daily-to-monthly signals of most systematic funds.
The horizon decides the firm. A medium-frequency strategy earns more per trade than a market maker and trades less often, so its costs are market impact and fees rather than the price of being first; its infrastructure needs good data and execution (Book 10) but not the tick-to-trade engineering of Book 13; and its capacity, the capital it can run before its own trading erodes its edge (strategy capacity, Book 7, chapter 28), is larger than a market maker’s and smaller than a trend follower’s. Its research is Book 7’s and its strategies Book 8’s: intraday and multi-day predictors on shares, futures and currencies. A small team with good data and a disciplined research process can run such a book, which is why the category contains so many small firms.
Remark 6.2 (Proprietary, not necessarily small)
Large firms trade at medium frequency too, often inside multi-strategy funds and platforms (chapters 4 and 5). The chapter is about the standalone proprietary firms for which it is the whole business: firms that trade only their own and their partners’ capital.
6.2 The size distribution of proprietary firms
The only public census of trading-firm sizes is the broker-dealer regulator’s, and its unit is the registered representative: a person registered to deal with the public, not an employee. A proprietary firm with no customers may register few of its staff. The census still says how the industry’s firms are shaped.
As of December 2024 — Broker-dealers by size
FINRA, end of 2024: 3 249 registered broker-dealers. By registered representatives: 1 522 firms with ten or fewer, 328 with 11–15, 205 with 16–20, 134 with 21–25, 108 with 26–30, 159 with 31–40, 102 with 41–50, 143 with 51–75, 80 with 76–100, 110 with 101–150, 137 with 151–300, 72 with 301–499, 65 with 500–1 000 and 84 with more than 1 000. Of the 649 241 registered representatives, 81.7% work at the 149 large firms (500 or more), 8.9% at mid-size firms and 9.4% at small ones. In its business segments, FINRA counts 93 small firms and 10 mid-size firms in proprietary trading and market making, and none among the large.
Most firms are small and most people work at large ones: 46.8% of broker-dealers have ten registered representatives or fewer, and 78.7% have fifty or fewer, but those small firms employ 9.4% of the representatives. A distribution with that shape is usually described by its upper tail.
Method 6.3 (Fitting a tail to binned counts)
- Choose a lower bound and keep the bins at or above it.
- Write the probability of each bin under a Pareto tail , treating integer bounds as continuous at half-units; the log-likelihood is .
- Maximise over ; the standard error is the inverse square root of minus the second derivative of the log-likelihood at the maximum.
- Compare with another shape (a lognormal) by the chi-square distance between observed and expected counts, and move to see whether is stable.
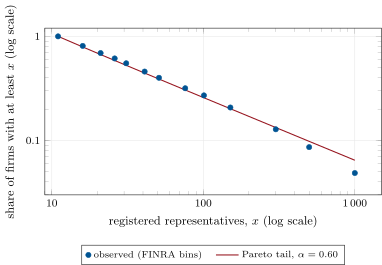
From eleven registered representatives up (1 727 firms, thirteen bins), the fitted tail index is with a standard error of 0.015 (Figure 6.1). An index below one is a heavy tail: in such a distribution the largest firms hold a share of the total that does not shrink as firms are added, which is what the representatives’ split says directly. The fit is imperfect. The Pareto line overstates the share of the very largest firms (6.5% of firms above 1 000 representatives against 4.9% observed), a lognormal fits the bins better (a chi-square distance of 5.1 against 21.2), and the index rises from 0.60 to 0.65 as the lower bound moves from 11 to 51. The honest reading is a range, not a number: a tail index between about 0.6 and 0.65, a heavy tail by any of them.
in_firmsize.fit.6.3 Newer entrants and firms that grew out of crypto
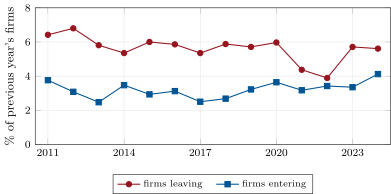
Firms enter and leave the registered population every year (Figure 6.2). Between 2011 and 2024, on average 5.6% of the previous year’s broker-dealers left FINRA membership and 3.2% entered; in 2024, 185 left and 136 entered. The population shrank by 29% from 2010 to 2024 because exits outnumbered entries every year, not because entry stopped. Among proprietary firms, a new entrant can be a handful of traders and researchers with their own capital or a backer’s, and an exit may be a firm closing, merging, or leaving the regulator’s perimeter by trading only futures or only crypto assets, which a broker-dealer registration does not cover.
The firms that grew out of crypto markets are that last case in reverse. The crypto trading firms of chapter 10 began outside the securities regulators’ registers, trading round the clock on venues with their own rules (Book 3, chapter 24), and a crypto firm that extends to futures, equities or options takes on the registrations that requires. For an employee their appeal is the one of any young firm: a small team, wide responsibility, and pay that depends heavily on the firm’s own results.
in_firmsize.entry_exit.6.4 Profit splits, arcades and funded-trader programmes
At the small end the line between a job and a business blurs. Three arrangements recur.
The profit split. A trader at a small proprietary firm is often paid a share of the P&L they generate, net of their costs, with little or no salary: a formulaic payout in Book 16’s terms (chapter 10), with the firm’s capital, technology and risk management as the firm’s side of the bargain. The share, the costs charged and whether losses are carried forward decide what the trader earns (chapter 13).
Definition 6.4 (Trading arcade)
A trading arcade is a structure in which several legal entities or natural persons trade under one firm’s licence for proprietary trading, usually each with its own capital allocation, sharing the licence holder’s infrastructure, risk management and compliance.
The Dutch regulator describes arcades in these words and states that they are possible in principle provided that all the requirements on investment firms are met, with every participant’s rights, powers and obligations clearly allocated and documented. The capital rules that bind the licence holder (own funds and the K-factor requirement, Book 16, chapter 2) bind the whole arcade: one participant’s losses are the licence holder’s problem.
Definition 6.5 (Funded-trader programme)
A funded-trader programme is a business that sells retail customers the chance to trade the operator’s capital: customers pay a fee to take an evaluation, usually on a simulated account, and those who meet its targets are promised a share of the profits of a “funded” account.
A funded-trader programme is not an employer, and its customers are not traders of a proprietary firm: they pay the operator, which earns its revenue from their fees. The public record shows how such a business can end up before a regulator, and how such a case can end.
As of May 2025 — One funded-trader case in the court record
In August 2023 the CFTC sued the operator of a funded-trader programme in the US District Court for the District of New Jersey, alleging that more than 135 000 customers had signed up, paying at least $310 million in fees; that some account types required customers to generate simulated profits in a demonstration account first; and that funded accounts were promised “up to 85% of profits”. On 13 May 2025 a special master appointed by the court, ruling on the defendants’ motion for sanctions against the CFTC, recommended that the motion be granted and the complaint be dismissed with prejudice. The court dismissed the case with prejudice and awarded the defendants fees and costs of the sanctions motion. The allegations were never proved.
6.5 What a small firm means for the employee
A job at a small proprietary firm differs from one at a large firm in four ways that follow from the numbers above.
- The capital is the partners’. Losses reduce what the owners have, and the firm’s capital requirement (Book 16, chapter 2) caps how much risk the whole firm can take; a bad month can shrink everyone’s allocation.
- Pay follows P&L closely. Formulaic splits, few salaried roles, and deferred pay that is often absent.
- Controls are lighter. Risk, compliance and operations may be one person each; the employee does more of everything, including checking their own work.
- The firm may not last. About one in eighteen broker-dealers leaves the register every year. The job’s option value is what it teaches and who it introduces.
Example 6.6 (One trader’s split)
A trader at a small firm keeps 40% of their book’s net P&L after costs of $150 000 a year, with no salary. A year of $800 000 gross P&L pays ; a year of $200 000 pays $20 000; a year of $100 000 pays nothing, and if losses are carried forward the next year’s first $50 000 of net P&L pays nothing either. The same trader at a salaried firm would earn a base salary and a discretionary bonus with a lower variance and, usually, a lower expected total (chapter 13 values such offers).
6.6 Tutorial: the long tail
Goal. Fit the size distribution of broker-dealers from FINRA’s published bins and read entry and exit. End state: Figure 6.1 and the tail index with its standard error.
- The bins.
data/industry/finra_size_bins.csvholds FINRA’s fourteen size bins for 2020–2024;in_firmsize.bins(2024)reads them asfirm.firmsize.Binrecords. Fit.
firm.firmsize.pareto_fit(bins, 11)maximises the binned likelihood (Listing 6.1);lognormal_fitfits the comparison.def pareto_fit(bins, x_min): t = _tail(bins, x_min) res = optimize.minimize_scalar(lambda a: -_ll_pareto(a, t, x_min), bounds=(0.05, 5.0), method="bounded", options={"xatol": 1e-9}) a = float(res.x) h = 1e-4 d2 = (_ll_pareto(a + h, t, x_min) - 2 * _ll_pareto(a, t, x_min) + _ll_pareto(a - h, t, x_min)) / h ** 2 return dict(alpha=a, se=float(1 / math.sqrt(-d2)), loglik=-float(res.fun), n=sum(b.n for b in t))Listing 6.1. The binned Pareto fit and its standard error from the observed information. code/firm/firmsize/firm_firmsize.py - Check.
expected_countsandchi2compare the two fits; refit with of 16, 21, 31 and 51 and watch move from 0.60 to 0.65. - Flows.
in_firmsize.entry_exit()computes the exit and entry rates behind Figure 6.2.
What to change next. Fit the 2020 bins and compare the index with 2024’s (exercise 7); simulate firm sizes from the fitted tail with sample_pareto and check that the fit recovers the index you drew from.
6.7 Build: size distributions from binned counts
Purpose. Fit size distributions to the binned counts regulators publish, for firm sizes here and for pay bands and headcounts later (chapters 12 and 14).
Interface. firm.firmsize: Bin(lo, hi, n); pareto_fit(bins, x_min); lognormal_fit(bins, x_min); expected_counts; chi2; ccdf; sample_pareto.
Rules. Integer bounds are continuous at half-units; an open top bin has probability equal to the tail beyond its lower bound; a fit states its lower bound and its standard error.
Acceptance tests. code/firm/firmsize/tests/: the fit recovers a known index from 20 000 simulated sizes within three standard errors; expected counts sum to the observed total; the tail share falls with size; the lognormal fit runs.
Stretch. Choose by minimising the distance between the fitted and observed tail (the Clauset–Shalizi–Newman method); a bootstrap interval for over bins.
Sources and further reading
- FINRA, Industry Snapshot 2025: tables 1.1.3, 2.1.9, 2.2.3 and 2.6.1–2.6.3.
- AFM (Netherlands Authority for the Financial Markets), Market participants subject to a licence obligation, on trading arcades.
- CFTC v. Traders Global Group Inc. et al., D.N.J. No. 23-cv-11808: complaint (29 August 2023); report and recommendation of the special master (13 May 2025); Willkie Farr & Gallagher’s summary of the court’s order (26 May 2025).
- A. Clauset, C. R. Shalizi and M. E. J. Newman, “Power-law distributions in empirical data”, SIAM Review 51(4), 2009.
6.8 Exercises
Exercise 6.1 ★
From the dated box, what share of broker-dealers had more than 500 registered representatives at the end of 2024, and what share of all representatives did they employ?
Solution
Solution of Exercise 6.1.
of 3 249 firms, 4.6%, employing 81.7% of the representatives.
Exercise 6.2 ★
In the example, what does the trader earn on gross P&L of $500 000, and on $150 000?
Solution
Solution of Exercise 6.2.
; on $150 000 the costs take everything and the trader earns nothing.
Exercise 6.3 ★
Under a Pareto tail with from , what is the probability that a firm with at least eleven representatives has more than 1 000?
Solution
Solution of Exercise 6.3.
: 6.5%.
Exercise 6.4 ★★
Compute the average exit and entry rates of broker-dealers over 2011–2024 and the rate of net shrinkage they imply.
Solution
Solution of Exercise 6.4.
Exit 5.6% and entry 3.2% a year on average: net shrinkage of about 2.4% a year.
Exercise 6.5 ★★
Why is a tail index below one described as heavy? What does it imply for the share of the largest firms as the population grows?
Solution
Solution of Exercise 6.5.
With the tail’s mean is infinite: the expected size of the largest firm grows faster than the population, so the largest firms’ share of the total does not shrink as firms are added.
Exercise 6.6 ★★
From Figure 6.1, where does the Pareto line lie above the observed shares, and what does that say about the largest firms?
Solution
Solution of Exercise 6.6.
From about 300 representatives up, and most at the top (6.5% predicted above 1 000 against 4.9% observed): the very largest firms are fewer than a pure power law implies, as if their size had a ceiling.
Exercise 6.7 ★★★
Coding. Fit the 2020 bins from . Is the index different from 2024’s by more than two standard errors?
Solution
Solution of Exercise 6.7.
2020: (standard error 0.015) against 0.601 in 2024. The difference, 0.015, is below two standard errors of the difference, : no change the data can detect.
Exercise 6.8 ★★★
Find the flaw. “Half of all broker-dealers have ten staff or fewer, so a typical trading job is at a firm of ten.”
Solution
Solution of Exercise 6.8.
The unit is registered representatives, not staff, and the count is of firms, not jobs: most registered people work at the 4.6% of firms with 500 or more. A typical job is at a large firm, even though a typical firm is small.
6.9 Problem: The Long Tail
Problem 6.1
Weekend problem — the long tail
A researcher with an offer from a twelve-person medium-frequency firm wants to understand where such firms sit in the industry and what the arrangement means.
Part I — The category.
- Define medium-frequency trading and place it between high-frequency trading and a systematic fund.
- Why do its costs and infrastructure differ from a market maker’s?
- What unit does FINRA use for firm size, and why does it understate a proprietary firm?
- How many broker-dealers did FINRA place in its proprietary-trading and market-making segments, and how large were they?
- What share of broker-dealers had ten registered representatives or fewer, and fifty or fewer?
Part II — The tail.
- Write the probability of one bin under a Pareto tail with half-unit bounds.
- Give the fitted index from eleven representatives and its standard error.
- Compare the Pareto and lognormal fits by their chi-square distances.
- How does the index move with the lower bound?
- What do the representatives’ shares by firm size say that the index also says?
Part III — Entry, exit and arrangements.
- Give the average exit and entry rates over 2011–2024, and the 2024 counts.
- Define a trading arcade, and say what the Dutch regulator requires of one.
- Define a funded-trader programme and say why it is not an employer.
- State the funded-trader case’s allegations, its outcome and its date, neutrally.
- Compute the trader’s pay in the example for gross P&L of $800 000, $200 000 and $100 000.
Part IV — The verdict.
- State the named result: the tail index with its standard error and its range as the lower bound moves, and the share of representatives at small firms.
- Name the four ways a job at a small firm differs from one at a large firm.
- What should the researcher ask about capital, pay and controls?
- Roughly what is the chance that a broker-dealer leaves the register in a given year?
- In two sentences, how should the researcher weigh the offer?
Solution
Solution of Problem 6.1.
- Systematic trading with positions of minutes to days; slower than high-frequency trading, faster than most systematic funds.
- Its costs are impact and fees, not being first; it needs good data and execution but not tick-to-trade engineering.
- Registered representatives; a firm without customers registers few of its staff.
- 103, of which 93 small (150 representatives or fewer) and 10 mid-size; none large.
- 46.8% and 78.7%.
- .
- , standard error 0.015.
- Lognormal 5.1, Pareto 21.2: the lognormal fits the bins better.
- It rises from 0.60 at 11 to 0.65 at 51.
- Heavy concentration: 9.4% of representatives at small firms, 81.7% at the largest 4.6%.
- 5.6% and 3.2%; 185 left and 136 entered in 2024.
- Several entities or persons trading under one licence; all investment-firm requirements met, and every participant’s rights and obligations allocated and documented.
- Customers pay fees for evaluations and are promised profit shares; its revenue is their fees, and they are its customers, not its staff.
- The CFTC alleged in 2023 that over 135 000 customers paid at least $310 million in fees; in May 2025 a special master recommended dismissal with prejudice on a motion for sanctions against the CFTC, and the court dismissed the case with prejudice and awarded fees. The allegations were not proved.
- $260 000, $20 000 and nothing.
- about 0.60 (0.015), between 0.60 and 0.65 as the lower bound moves; 9.4% of representatives at small firms.
- The capital is the partners’; pay follows P&L; controls are lighter; the firm may not last.
- Whose capital and how large; the split, the costs charged and loss carry-forward; who checks risk and trades.
- About 5.6%, one in eighteen.
- The offer is a share in a small business more than a salary: its value depends on the split, the costs and the firm’s survival. Weigh it for what it teaches and against a salaried alternative’s lower variance.
6.10 Interview questions
Interview question 6.1 ★ researcher, trader
What changes in research and infrastructure when a strategy’s holding period goes from seconds to a day?
Solution
Solution of Interview question 6.1.
The edge moves from speed to prediction: signals on minutes to days, with costs dominated by impact and fees; research leans on statistics and data, infrastructure on reliable data and execution rather than microsecond latency; capacity rises.
What the interviewer is looking for: horizon drives edge, cost and infrastructure.
Interview question 6.2 ★ trader
You are offered 50% of your net P&L with no salary, or a salary of $150 000 and a 10% bonus of net P&L. At what net P&L are they equal?
Solution
Solution of Interview question 6.2.
, so of net P&L. Above it the split pays more.
What the interviewer is looking for: a break-even and the variance each carries.
Interview question 6.3 ★★ researcher
You have only binned counts of firm sizes. How do you estimate a tail index, and how do you know whether a power law is the right shape?
Solution
Solution of Interview question 6.3.
Maximise the binned likelihood of a Pareto tail above a chosen lower bound; get a standard error from the observed information; compare with alternatives (lognormal) by likelihood or chi-square, and check stability as the lower bound moves.
What the interviewer is looking for: binned maximum likelihood, alternatives and the choice of .
Interview question 6.4 ★★ risk
Several traders trade under one firm’s licence, each with their own capital. What risks does the licence holder carry?
Solution
Solution of Interview question 6.4.
All of it: every participant’s losses, capital requirements and conduct are the licence holder’s; so are operational failures and market-abuse risk. It needs pre-trade limits per participant, real-time monitoring and clear documentation.
What the interviewer is looking for: the licence holder carries the risk.
Interview question 6.5 ★★ researcher
A medium-frequency strategy makes 5 basis points a trade before costs, trades each position once a day on $20 million of capital with a turnover of 100% a day, and pays 2 basis points in costs. What is its annual net return on capital, and what limits scaling it?
Solution
Solution of Interview question 6.5.
basis points a day on 100% turnover: about basis points, 7.6% a year before financing. Impact grows with size, so the 5 basis points shrink as capital rises; capacity ends where marginal edge equals marginal cost.
What the interviewer is looking for: edge net of cost times turnover, and capacity.
Interview question 6.6 ★★★ researcher, risk
A business sells evaluations to would-be traders and promises profit splits to those who pass. How would you tell from its numbers whether its revenue comes from trading or from fees?
Solution
Solution of Interview question 6.6.
Compare fee revenue with profit-share payouts and with trading P&L on real accounts; ask what share of customers pass, whether funded accounts trade in a market or against the operator, and how payouts are funded. A business whose payouts are small against fees is selling evaluations.
What the interviewer is looking for: follow the revenue.