Rates, Credit, XVA and Risk · Rates, credit & risk
26Model Risk and Validation
On 30 January 2012 JPMorgan’s model review group authorised a new value-at-risk model for the synthetic credit portfolio of the bank’s Chief Investment Office. The old model had been judged too conservative; the new one cut the office’s VaR by half, from 132 to 66 million dollars, and the firm-wide VaR limit, breached for days, was no longer exceeded. Months later, after losses on the portfolio had grown to billions of dollars, the bank’s own task force found an operational error in the model’s spreadsheets: after subtracting an old hazard rate or correlation from a new one, the spreadsheet divided by their sum instead of their average, which likely muted volatility by a factor of two and lowered the VaR. The model had been approved; nobody had checked that it computed what its documentation said. This chapter is about the discipline that does: identifying models, tiering them by the damage they can do, validating them against independent benchmarks and against outcomes, and governing the results.
26.1 What model risk is and how it enters
Definition 26.1 (Model risk)
Model risk is the potential for adverse consequences from decisions based on a model’s output: financial loss, misstatement, or poor risk decisions. It enters through wrong theory or assumptions, errors of implementation and data, and use of a sound model outside the conditions it was built for.
Definition 26.2 (Model risk management)
Model risk management is the framework that identifies a firm’s models, assesses and limits the risk they carry, and assigns responsibility for development, use, validation and oversight across their life.
The three sources call for different checks. Wrong theory is caught by conceptual review and by comparing against other models; implementation errors by independent re-implementation and by tests on cases with known answers; misuse by monitoring the model’s outcomes and its inputs.
26.2 Supervisory expectations
Definition 26.3 (Effective challenge)
Effective challenge is the critical analysis of a model by objective people with the expertise to find its weaknesses, the independence to report them, and the standing to have them fixed.
Definition 26.4 (Three lines of defence)
The three lines of defence assign model risk to the model’s owners and users (first line: development and use), to an independent risk function (second line: validation and oversight) and to internal audit (third line: assurance that the framework works).
As of September 2026 — Model risk guidance
In the United States, the Federal Reserve, the OCC and the FDIC issued revised guidance on model risk management on 17 April 2026 (SR 26-2), superseding the guidance of April 2011 (SR 11-7). It is most relevant to banking organisations with over 30 billion dollars of assets; it defines a model as a complex quantitative method applying statistical, economic or financial theories to turn input data into estimates, excluding simple arithmetic such as spreadsheet calculations and deterministic rule-based processes, and it leaves generative and agentic AI outside its scope. In the United Kingdom, the PRA’s supervisory statement SS1/23 (published May 2023) has applied since 17 May 2024 to banks with internal models for regulatory capital, through five principles: identification and classification, governance, development and use, independent validation, and risk mitigants. In the euro area, the ECB revised its guide to internal models on 28 July 2025, adding expectations for machine-learning techniques.
26.3 The validation report
Definition 26.5 (Model validation)
Model validation is the set of activities that verify a model performs as intended: conceptual soundness, verification of the implementation, benchmarking, and outcomes analysis, with findings, their severity, and conditions of use.
Definition 26.6 (Benchmark model, outcomes analysis)
A benchmark model is an independent implementation, of the same model or of an alternative, against which a model’s outputs are compared. Outcomes analysis compares a model’s outputs with the realised outcomes they predicted: backtesting of VaR and margin, P&L attribution, default rates against PDs.
Method 26.7 (Benchmarking over a grid)
Choose the parameter ranges the model will meet in use. Evaluate the model and the benchmark on every combination. Set tolerances in business terms (an absolute error in basis points of notional, and a relative error). Record every point, summarise failures by parameter, and investigate the pattern, not only the worst case.
def benchmark(candidate: Callable[..., float], reference: Callable[..., float], grid: dict[str, Sequence],
              abs_tol: float, rel_tol: float) -> list[BenchmarkResult]:
    """Evaluate both on every combination of the grid; a point passes if within abs_tol or rel_tol."""
    keys = list(grid)
    out = []
    for combo in itertools.product(*(grid[k] for k in keys)):
        p = dict(zip(keys, combo, strict=True))
        c, b = candidate(**p), reference(**p)
        ae = abs(c - b)
        re_ = ae / abs(b) if b != 0 else math.inf
        out.append(BenchmarkResult(p, c, b, ae, re_, ae <= abs_tol or re_ <= rel_tol))
    return out


def summary(results: Sequence[BenchmarkResult]) -> dict:
    fails = [r for r in results if not r.passed]
    return {"points": len(results), "failures": len(fails), "max_abs": max(r.abs_err for r in results),
"max_rel": max(r.rel_err for r in results if math.isfinite(r.rel_err)), "failed": fails}Example 26.8 (Validating chapter 7’s tree)
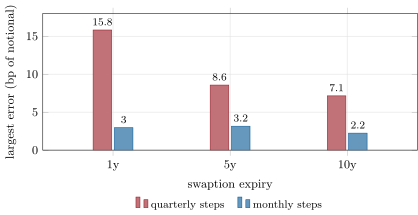
Chapter 7’s Hull–White trinomial tree prices European swaptions; the Jamshidian closed form of the same model is the benchmark. Over 216 points (mean reversion 1%, 5%, 20%; volatility 60 and 120 basis points; expiries 1, 5, 10 years; tenors 5 and 10; strikes at the money and ; quarterly and monthly steps), with a tolerance of half a basis point of notional or 1%: with quarterly steps 54 of 108 points fail and the worst error is 15.8 basis points of notional; with monthly steps 23 fail and the worst is 3.2. The failures concentrate at short expiries, 14 of the 23 at one year (Figure 26.1): a one-year-into-five-year at-the-money payer (mean reversion 1%, volatility 60 basis points) is worth 104.81 basis points in closed form, 103.07 in the monthly tree and 98.55 in the quarterly one. The finding: the tree needs finer steps before a near exercise date, and a condition of use until it has them.
26.4 Inventories, tiering and limitations
Definition 26.9 (Model inventory, model tiering)
A model inventory records every model in use with its owner, purpose, users, validation status and known limitations. Model tiering classifies models by the damage they can do (materiality of use, complexity, uncertainty of inputs and assumptions) and sets the depth and frequency of validation accordingly.
Example 26.10 (The firm’s inventory)
Scoring eight of this book’s models from 1 to 3 on materiality (counted twice), complexity and uncertainty, and placing tier 1 at a score of 10 or more and tier 2 at 7 or more (an illustrative policy), gives five tier 1 models (the SABR cube, the prepayment model, the exposure engine, the VaR model and the deposit model), two tier 2 (the curve and the Bermudan pricer) and one tier 3 (the margin forecast). Tier 1 models are revalidated every year, tier 2 every two, tier 3 every three.
Definition 26.11 (Post-model adjustment)
A post-model adjustment is a documented change to a model’s output made outside the model to correct a known weakness until the model is fixed; it needs an owner, a rationale, a size and an expiry.
26.5 Benchmarking and outcomes analysis
Benchmarking finds implementation errors that documentation hides. The 2012 error is a case: the documentation said relative changes, the spreadsheet computed half of them, and no independent implementation compared the two.
Example 26.12 (Half the volatility)
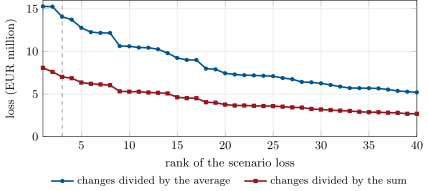
An illustrative synthetic-credit book sells EUR 1 billion of protection on a 0–3% equity tranche in the large-pool model and buys 12.0 times as much index protection as a hedge (hazard 1%, correlation 20%). On a year of illustrative daily moves of the hazard rate and the correlation, its historical 99% VaR is EUR 14.06 million with relative changes divided by the average of old and new values, and 7.01 million when they are divided by the sum: 49.9% of the intended figure (Figure 26.2). A benchmark that recomputed one scenario by hand would have found it.
As of September 2026 — The 2012 model
According to JPMorgan’s management task force report (January 2013), the new VaR model for the Chief Investment Office’s synthetic credit portfolio was authorised on 30 January 2012 and ended the breaches of the firm-wide VaR limit; errors later found in the model included a spreadsheet that divided the change in a hazard rate or correlation by the sum of the old and new values instead of their average, likely muting volatility by a factor of two. The report also found that price testing relied on spreadsheets that had not been vetted.
Outcomes analysis catches what benchmarking cannot: a model that is implemented as specified but wrong about the world. Its tools are the backtests of chapters 21 and 25, the attribution test of chapter 23 and the monitoring of inputs against the ranges validated.
26.6 Tutorial: a validation report
Goal. Validate chapter 7’s tree against the closed form over a grid, record the failures, tier the firm’s models, and replay the averaging error. End state: the numbers of Examples 26.8, 26.10 and 26.12 and the charts, written up in the structure below.
- Scope: the model, its uses, the parameter ranges in use (
GRID). - Benchmark:
validation()runsbenchmarkwithtree_priceagainstclosed_price. - Findings:
errors_by_expiry(); severity and conditions of use. - Inventory:
inventory(),tiers();averaging_error();fig_rc_modelval.pywrites the charts.
What to change next. Add a Monte Carlo benchmark of the same swaptions; add a finer step grid near the exercise date and rerun the one-year failures.
26.7 Build: model validation tools
Purpose. The firm’s inventory and validation tooling, used for every component of this series before it enters the risk engine.
Interface. ModelRecord (with tier, revalidate_years); inventory_summary; benchmark(candidate, reference, grid, abs_tol, rel_tol), BenchmarkResult, summary; binomial_tail; relative_change.
Rules. Every grid point kept, not only failures; tolerances in business units; tiering scores and intervals are a policy input.
Acceptance tests. code/firm/modelval/tests/: tiering boundaries; the harness finds the single planted failure; binomial tail against the Basel table; the two relative changes differ by a factor of two.
Stretch. Validation reports generated from records; monitoring of input ranges in production; a findings tracker with owners and deadlines.
Sources and further reading
- JPMorgan Chase & Co., Report of JPMorgan Chase & Co. Management Task Force Regarding 2012 CIO Losses, 16 January 2013.
- Board of Governors of the Federal Reserve System, OCC and FDIC, Revised Guidance on Model Risk Management, SR 26-2, 17 April 2026.
- Prudential Regulation Authority, SS1/23, Model risk management principles for banks, 2023.
26.8 Exercises
Exercise 26.1 ★
A rate moves from 1.00% to 1.10%. Give the relative change as intended and as computed in the 2012 spreadsheet.
Solution
Solution of Exercise 26.1.
Intended: ; divided by the sum: , half.
Exercise 26.2 ★
Give the tier of a model scored 3 on materiality, 1 on complexity and 1 on uncertainty under the chapter’s rule.
Solution
Solution of Exercise 26.2.
Score : tier 2.
Exercise 26.3 ★
A VaR model has 8 exceptions in 250 days at 99%. How likely is that for a correct model?
Solution
Solution of Exercise 26.3.
for a binomial with 250 trials and probability 1%: 0.40%. Unlikely: the yellow zone of chapter 21, with a capital add-on.
Exercise 26.4 ★★
Why would a spreadsheet error that halves volatility not be caught by a VaR backtest within weeks?
Solution
Solution of Exercise 26.4.
With a halved VaR the exception rate rises from 1% to perhaps a few per cent, which needs months of data to distinguish from bad luck: at 99% a correct model has 2.5 exceptions a year. Backtests detect gross errors slowly; implementation tests detect them at once.
Exercise 26.5 ★★
Why is a closed form of the same model a weaker benchmark than an alternative model, and why is it still useful?
Solution
Solution of Exercise 26.5.
It tests only the implementation, not the model’s assumptions: both share them. It is still the sharpest test of the numerics (steps, boundaries, calibration), because any difference is an error of the candidate.
Exercise 26.6 ★★
Under SR 26-2’s definition, is the 2012 spreadsheet a model? What follows for its control?
Solution
Solution of Exercise 26.6.
The VaR model as a whole is a model (it applies statistical theory to data); the spreadsheet computing relative changes is part of its implementation, even if simple arithmetic on its own is excluded. Its control belongs to the model’s validation and change management, not to a separate spreadsheet policy only.
Exercise 26.7 ★★★
Coding. Rerun the tree validation with steps of one twenty-fourth of a year for one-year expiries only, and report the failures.
Solution
Solution of Exercise 26.7.
With steps of one twenty-fourth of a year, 3 of the 36 one-year points fail (against 14 with monthly steps); the largest error is 1.40 basis points of notional, and the largest relative error, 15%, is on an out-of-the-money option worth little.
Exercise 26.8 ★★★
Find the flaw. “The new model was approved by the review group, so the lower VaR is the right number.”
Solution
Solution of Exercise 26.8.
Approval certifies a review, not correctness; a model that lowers a number during a limit breach needs more scrutiny, not less. The 2012 model was approved and wrong, and the bank’s own report found the review did not verify the implementation.
26.9 Problem: The Averaging Error
Problem 26.1
Weekend problem — a factor of two
The illustrative synthetic-credit book of Example 26.12 is measured by a VaR model implemented in a spreadsheet that divides relative changes by the sum of old and new values.
Part I — The error.
- Show that the error halves every relative change.
- Give the VaR with and without the error, and the ratio.
- Why is the ratio not exactly one half?
- Give the hedge ratio of the book and why it is so large.
- What limit behaviour would the error produce?
Part II — Detection.
- Which validation step would have caught it, and how quickly?
- What would outcomes analysis have shown, and when?
- What role did the timing of the model change play in 2012?
- Why did the model’s documentation not reveal the error?
- What control on spreadsheets would you require?
Part III — Governance.
- Who should approve a model that lowers a desk’s VaR during a limit breach?
- What conditions of use would you attach?
- How should limits be treated when a model changes?
- Which tier would you give this model, and why?
- What does effective challenge require of the validator here?
Part IV — Judgement.
- Was the 2012 loss caused by the model?
- What does SR 26-2’s exclusion of simple spreadsheet arithmetic mean for cases like this?
- How would you design a validation that catches implementation errors cheaply?
- State the named result: the VaR reduction produced by dividing a rate change by the sum of two rates instead of their average.
- In one sentence: what is model risk?
Solution
Solution of Problem 26.1.
1. . 2. EUR 14.06 million intended, 7.01 million with the error: a ratio of 0.499. 3. The book is not linear in the moves (the tranche has convexity), so halving the moves does not exactly halve the losses. 4. 12.0: the equity tranche’s value moves about twelve times as much as the index’s for a change in the hazard rate, so it takes twelve times the notional of index protection to hedge it. 5. Breaches would disappear: a limit set on the old model would look half used. 6. Independent re-implementation of the relative-change step, or a hand calculation of one scenario: at once. 7. More VaR exceptions than 1%, visible only after months. 8. The change arrived while limits were breached and removed the breaches, which relieved pressure instead of prompting scrutiny of the positions. 9. The documentation described the intended formula; only the implementation was wrong. 10. Inventory of spreadsheets used in models, independent tests of their formulas, version control, and restricted editing. 11. An independent validator and risk management above the desk, with a check that limits are recalibrated. 12. Parallel run with the old model, reduced limits until outcomes confirm it, and review of the implementation of every transformation of inputs. 13. Recalibrate them to the new model at the change, so that a model change is not a limit change. 14. Tier 1: it sets limits and capital for a large, complex book, with uncertain inputs. 15. Expertise to rebuild the calculation, independence from CIO, and standing to stop its use. 16. No: the trades and their size caused it; the model hid the risk and delayed the response. 17. That a bank must still control such arithmetic where it is part of a model’s implementation; the exclusion concerns stand-alone calculations. 18. Unit tests on known cases, independent re-implementation of key steps, reconciliation of intermediate outputs, and grid benchmarking. 19. Named result: the averaging error: dividing relative changes by the sum instead of the average halves them and cuts the book’s 99% VaR from EUR 14.06 million to 7.01 million, a 50% reduction. 20. The risk of acting on a model that is wrong, wrongly built or wrongly used.
26.10 Interview questions
Interview question 26.1 ★ risk, bank
What does a model validation report contain?
Solution
Solution of Interview question 26.1.
Scope and use; conceptual soundness; data and implementation checks; benchmarking and sensitivity analysis; outcomes analysis; limitations; findings with severity, owners and deadlines; conditions of use; the validator’s conclusion.
What the interviewer is looking for: structure and actionable findings.
Interview question 26.2 ★★ researcher, risk
How would you validate a pricing model for Bermudan swaptions?
Solution
Solution of Interview question 26.2.
Check the model choice against the product (mean reversion, smile, number of factors); benchmark European prices against closed forms; compare tree and regression Monte Carlo Bermudans; test exercise boundaries and convergence; check calibration stability; compare with market prices where available; assess the smile’s effect with an alternative model.
What the interviewer is looking for: benchmarks, convergence and model alternatives.
Interview question 26.3 ★★ developer
How do you test a numerical pricer so that implementation errors are found early?
Solution
Solution of Interview question 26.3.
Unit tests with known answers, limits and symmetries (parity, zero volatility, deep in or out of the money), convergence tests, independent re-implementation, regression tests on stored outputs, and property tests over grids.
What the interviewer is looking for: known cases, invariants and independent implementations.
Interview question 26.4 ★★ risk
What is effective challenge, and how do you know it is happening?
Solution
Solution of Interview question 26.4.
Critical review by people with expertise, independence and standing. It is happening when findings change models or their use, when validators can stop a model, and when disagreements are recorded and escalated.
What the interviewer is looking for: the three conditions and evidence.
Interview question 26.5 ★★★ bank, risk
What went wrong with the 2012 CIO VaR model, and which controls would have stopped it?
Solution
Solution of Interview question 26.5.
A new model lowered VaR during limit breaches, was approved without verifying its implementation, and contained a spreadsheet error that halved volatility. Independent re-implementation, parallel runs, limit recalibration at model change, and escalation of the positions behind the breaches.
What the interviewer is looking for: the error, the governance failure and the controls.
Interview question 26.6 ★★★ researcher
How would you quantify model risk in a price, for a reserve?
Solution
Solution of Interview question 26.6.
Price the product under a set of plausible alternative models and calibrations, take the dispersion (or the distance to a conservative choice) as the model uncertainty, and reserve for it; review as market consensus data arrive (chapter 27).
What the interviewer is looking for: alternative models and a reserve.