Rates, Credit, XVA and Risk · Rates, credit & risk
25Margin Models
Over March 2020 the initial margin required by the world’s clearing houses rose by roughly 300 billion dollars, and members posted another 115 billion of excess collateral on top: about 40% more than their February average, called in the weeks when every firm needed cash for something else. The rise was not a failure of the models: it was what models that track volatility do when volatility jumps. Bilateral margin under the industry’s standard model barely moved, by design. The difference between the two is a choice about procyclicality, and it decides who must find liquidity in a crisis. One Quant Book 1 described margin and clearing; this chapter builds the models: historical and filtered simulation at clearing houses, the sensitivity-based and standardised approaches for bilateral trades, the tools that damp procyclicality, and the tests that check a margin model covers what it should.
25.1 What an initial-margin model must do
Definition 25.1 (Initial-margin model)
An initial-margin model sets the collateral a party must post against the loss its counterparty would suffer in closing out its portfolio after a default, over the margin period of risk, at a high confidence: at clearing houses at least 99% single-tailed, for bilateral trades 99% over ten days.
A margin model must be risk-sensitive (so that margin follows the portfolio), stable (so that margin does not jump with every tick of volatility), transparent and replicable (so that members can forecast their calls), and fast. The first two pull against each other.
Example 25.2 (A member’s swap book)
A member’s cleared USD swaps have illustrative exposures of , , and thousand dollars per basis point at two, five, ten and thirty years (the P&L for a one-basis-point rise), a net thousand. With daily Treasury par yields standing in for swap rates, a five-day historical simulation at 99% over one year of history gives an initial margin of USD 4.19 million on average in February 2020.
25.2 Clearing-house models: scenarios, historical and filtered simulation
Clearing houses margin with historical simulation over a look-back window, scenario grids (the scanning ranges of One Quant Book 1), or filtered historical simulation, which rescales past moves to current volatility (chapter 21).
def overlapping(changes: np.ndarray, h: int) -> np.ndarray:
    """h-day overlapping sums of daily factor changes (rows oldest first)."""
    c = np.cumsum(np.vstack([np.zeros((1, changes.shape[1])), changes]), axis=0)
    return c[h:] - c[:-h]


def hs_im(pnl: np.ndarray, q: float = 0.99) -> float:
    losses = np.sort(-np.asarray(pnl))[::-1]
    k = max(1, math.ceil((1 - q) * len(losses) - 1e-9))
    return float(max(losses[k - 1], 0.0))


def ewma_vol(x: np.ndarray, lam: float = 0.97) -> tuple[np.ndarray, np.ndarray]:
    v, s2 = np.empty_like(x), x[:20].var(axis=0) + 1e-18
    for t in range(x.shape[0]):
        v[t] = np.sqrt(s2)
        s2 = lam * s2 + (1 - lam) * x[t] ** 2
    return v, np.sqrt(s2)


def fhs_moves(daily: np.ndarray, h: int, lam: float = 0.97) -> np.ndarray:
    """Filter daily moves to today's volatility, then form h-day overlapping sums."""
    past, now = ewma_vol(daily, lam)
return overlapping(daily / past * now, h)Example 25.3 (March 2020 replayed)
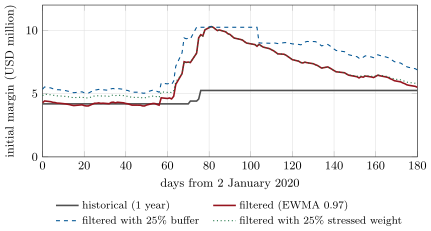
Recomputing the member’s margin every day from January to June 2020, the one-year historical model rises from USD 4.19 million (February average) to a peak of 5.25 million on 18 March, 25% more. The filtered model, with an EWMA decay of 0.97, rises from 4.21 million to 10.30 million on 23 March, 2.45 times its February level: USD 6.09 million of new margin in about three weeks (Figure 25.1). The historical model is slow because a one-year window dilutes a few volatile days; the filtered model reacts at once.
As of September 2026 — Margin in March 2020
The Basel Committee, CPMI and IOSCO reported in September 2022 that initial margin required across clearing houses rose by roughly 300 billion dollars over March 2020, with 115 billion more of excess collateral, about 40% above the February average; bilateral margin under ISDA’s standard model, used by most banks under the margin rules, stayed relatively stable. About half of the clearing houses surveyed had no formal anti-procyclicality framework; tolerances reported for margin increases ranged from 25% to 80% over five days.
25.3 The standard bilateral model
Definition 25.4 (Standard initial margin model)
A standard initial margin model computes bilateral margin from prescribed sensitivities (delta, vega, curvature) by risk class, weighted by calibrated risk weights and aggregated with prescribed correlations, within each class: the same structure as the FRTB sensitivities method (chapter 23). The industry’s model is ISDA’s SIMM, whose parameters are recalibrated periodically; the chapter uses illustrative parameters.
Definition 25.5 (Schedule-based initial margin, initial-margin threshold)
Schedule-based initial margin applies fixed shares of notional by asset class and maturity (for interest rates 1%, 2% and 4% for maturities up to two, two to five and over five years; 6% for FX; 15% for equity), netted as with NGR the ratio of net to gross replacement cost. The initial-margin threshold, up to EUR 50 million per group, is the margin a party need not collect.
Example 25.6 (Three bilateral numbers)
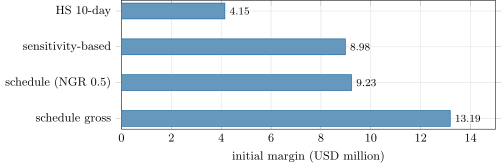
Today, for the same book traded bilaterally: a ten-day historical 99% margin of USD 4.15 million; a sensitivity-based margin of 8.98 million with illustrative ten-day risk weights of 60, 60, 55 and 50 basis points; and a schedule margin of 13.19 million gross, 9.23 million net at an NGR of 0.5 (Figure 25.2). The schedule ignores the offsets between tenors; the sensitivity model sees them only through its correlations.
As of September 2026 — Uncleared margin rules
Under the Basel Committee–IOSCO framework (as revised in April 2020), initial margin on non-centrally cleared derivatives covers a one-tailed 99% move over ten days; since 1 September 2022, on a permanent basis, it applies between groups with more than EUR 8 billion of average aggregate notional; the initial-margin threshold is up to EUR 50 million and the minimum transfer amount up to EUR 500 000. ISDA’s SIMM in force from 11 July 2026 is version 2.8 calibrated to December 2025, a public document.
25.4 Procyclicality and its tools
Definition 25.7 (Anti-procyclicality tool)
An anti-procyclicality tool limits the rise of margin in stress by holding more in calm markets: a buffer above the model margin that can be released in stress, a weight on a stressed period in the calibration, a long look-back window, or a floor on volatility. European rules for central counterparties require at least one of a buffer of at least 25% of the calculated margin, a weight of at least 25% on stressed observations, or margin no lower than a ten-year look-back would give.
Definition 25.8 (Concentration add-on)
A concentration add-on charges extra margin on positions large relative to the market’s capacity to absorb them, since closing them out would take longer than the margin period of risk and move prices.
def apc_buffer(model: np.ndarray, stress: np.ndarray, buffer: float = 0.25, rebuild_days: int = 20) -> np.ndarray:
    """Charge (1 + buffer) x model in calm periods. In stress the buffer absorbs increases: the charge is the
    larger of the model and the last calm charge. After stress the buffer is rebuilt linearly."""
    out = np.empty_like(model)
    last_calm, w = (1 + buffer) * model[0], 1.0
    for t in range(len(model)):
        if stress[t]:
            out[t] = max(model[t], last_calm)
            w = 0.0
        else:
            w = min(1.0, w + 1.0 / rebuild_days)
            out[t] = model[t] * (1 + buffer * w)
            last_calm = out[t]
    return out


def apc_stressed_weight(model: np.ndarray, stressed_im: float, weight: float = 0.25) -> np.ndarray:
return np.maximum(model, weight * stressed_im + (1 - weight) * model)Example 25.9 (The tools in March 2020)
With a 25% buffer on the filtered model, released when the book’s EWMA volatility exceeds twice its one-year average, the member held 5.26 million in February and 10.30 million at the peak: 5.04 million of new margin instead of 6.09. With a 25% weight on the margin of the most volatile year before 2020 (6.55 million), it held 4.79 million and had to find 5.51 million. The tools shift margin from the stress to the calm; they do not lower the peak.
25.5 Backtesting margin
A margin model is backtested like a VaR model: count the days on which the realised loss over the margin period of risk exceeded the margin held the day before. Clearing houses report their coverage and investigate breaches.
Example 25.10 (Coverage since 2017)
Over 2 177 days since January 2017, the five-day loss of the member’s book exceeded the one-year historical margin 35 times and the filtered margin 37 times, against 22 expected at 99%: both models cover less than they aim to, largely in the 2020 and 2022 episodes, and overlapping windows make the exceptions cluster.
25.6 Tutorial: margin through a crisis
Goal. Compute the member’s initial margin by historical and filtered simulation, replay the first half of 2020 with and without anti-procyclicality tools, and compare the bilateral approaches. End state: the numbers of Examples 25.3, 25.6, 25.9 and 25.10 and the two charts.
- Data:
data()reads the par yields;pnl()applies the exposures. - Replay:
replay_2020(). - Bilateral:
hs10_today(),simm_today(),schedule_today(). - Backtest:
backtest_since();fig_rc_margin.pywrites the charts.
What to change next. Use a ten-year look-back where history allows; add a volatility floor at the ten-year average and compare the March increase.
25.7 Build: the initial-margin engine
Purpose. The firm’s margin forecasts: what clearing houses and bilateral counterparties will call, for liquidity planning, MVA (chapter 19) and stress tests (chapter 22).
Interface. overlapping, hs_im, ewma_vol, fhs_moves; simm_like(sens, tenors, rw); schedule_rate, schedule_im(trades, net, gross); apc_buffer, apc_stressed_weight; backtest, peak_increase.
Rules. Losses positive; overlapping multi-day moves; illustrative sensitivity parameters; the schedule and its NGR netting as in the Basel–IOSCO framework.
Acceptance tests. code/firm/initmargin/tests/: overlapping sums; historical margin of a known sample; schedule rates and netting; single-factor and offsetting sensitivity margins; buffer and stressed-weight behaviour; backtest count.
Stretch. Full-revaluation margin for options; concentration and liquidity add-ons; the licensed SIMM with its calibration files; intraday margin.
Sources and further reading
- BCBS–CPMI–IOSCO, Review of margining practices, September 2022.
- BCBS–IOSCO, Margin requirements for non-centrally cleared derivatives, April 2020.
- CPMI–IOSCO, Principles for financial market infrastructures, April 2012.
25.8 Exercises
Exercise 25.1 ★
Compute the schedule margin of a USD 100 million ten-year swap and a USD 100 million one-year swap, gross.
Solution
Solution of Exercise 25.1.
million for the ten-year and million for the one-year: USD 5 million gross.
Exercise 25.2 ★
Why is a one-year historical margin slow to react to a volatility spike?
Solution
Solution of Exercise 25.2.
Its 99% quantile is the third-worst of about 250 five-day moves: a few new volatile days add a few new tail observations but do not move the quantile much until they outnumber the old tail, and the calm days of the past year still dominate the window.
Exercise 25.3 ★
A counterparty’s net replacement cost is 30 against a gross of 120. By what share does netting reduce its schedule margin?
Solution
Solution of Exercise 25.3.
; net margin : a 45% reduction.
Exercise 25.4 ★★
Why did bilateral SIMM margin stay stable in March 2020 while CCP margin rose?
Solution
Solution of Exercise 25.4.
SIMM’s risk weights are calibrated on long histories including stress periods and change only at recalibration; they do not react to current volatility. Clearing-house models track volatility (filtered or short look-back), so their margin rose with it.
Exercise 25.5 ★★
Why do anti-procyclicality tools not lower the peak margin in the replay?
Solution
Solution of Exercise 25.5.
The peak is set by the model margin at the height of the stress, which the tools do not change (the buffer is released, the stressed weight is below the March level); they only raise the margin held before, so the increase is smaller.
Exercise 25.6 ★★
What does a concentration add-on protect against that a volatility-based model misses?
Solution
Solution of Exercise 25.6.
The time and price impact of liquidating a position that is large relative to daily volume: the close-out takes longer than the margin period of risk and moves prices, which a model of normal-size moves over a fixed horizon does not see.
Exercise 25.7 ★★★
Coding. Compute the expected number of exceptions and the Kupiec p-value for 35 exceptions in 2 177 days at 1%, treating days as independent, and say why the assumption is wrong.
Solution
Solution of Exercise 25.7.
Expected ; Kupiec likelihood ratio 6.86, p-value 0.009. Overlapping five-day windows make consecutive days share four of their five days of moves, so exceptions come in runs; the test assumes independence and overstates the evidence.
Exercise 25.8 ★★★
Find the flaw. “Our margin model is well calibrated: its February margin covered 99% of February’s moves.”
Solution
Solution of Exercise 25.8.
Coverage must be tested out of sample and over stress: a model calibrated to calm months covers calm months and fails when volatility jumps, as March 2020 showed. The test is the next month, not the last.
25.9 Problem: The Margin Calls of March 2020
Problem 25.1
Weekend problem — finding the cash
The member of this chapter clears its swap book at a clearing house that uses the filtered model. Its treasury holds liquidity for margin calls.
Part I — The calls.
- Give the February margin and the peak, with the date.
- Give the cash to find over March.
- What drove the increase: positions or volatility?
- How much of the rise would the one-year historical model have called?
- Why might the clearing house prefer the filtered model anyway?
Part II — The tools.
- Give the February margin and the increase with a 25% buffer.
- Give them with a 25% stressed-period weight.
- What does each tool cost the member in calm years?
- When should the buffer be rebuilt, and why slowly?
- What reported tolerances for increases over five days did the 2022 review find?
Part III — Bilateral.
- Give the member’s bilateral margin under the three approaches.
- Why would a member prefer to clear?
- What is the effect of the EUR 50 million threshold on this book?
- How does variation margin interact with initial margin in a crisis?
- Which model would you use to forecast liquidity needs?
Part IV — Judgement.
- Is procyclical margin a flaw or a feature?
- Who bears the cost of anti-procyclicality?
- How should a member size its liquidity buffer for margin?
- State the named result: the increase in initial margin with and without a 25% buffer and a stressed weight, and the cash the member had to find.
- In one sentence: what does a margin model trade off?
Solution
Solution of Problem 25.1.
1. USD 4.21 million in February; 10.30 million on 23 March. 2. USD 6.09 million. 3. Volatility: the positions are fixed in the replay. 4. USD 1.06 million (from 4.19 to 5.25). 5. It covers the current risk: the historical model under-margined the book during the stress, which is when a default is most likely. 6. USD 5.26 million held; an increase of 5.04 million. 7. USD 4.79 million held; an increase of 5.51 million. 8. The funding of the extra margin held in calm years (about 1 million under the buffer, 0.6 under the stressed weight in February), at the member’s funding spread over what margin earns. 9. After volatility has normalised, and gradually: rebuilding it at once would be another margin call just as markets recover. 10. From a 25% increase over five days to up to 80%. 11. Ten-day historical USD 4.15 million; sensitivity-based 8.98 million; schedule 13.19 million gross, 9.23 million net. 12. Netting across all its cleared trades, lower margin than the schedule, and no bilateral counterparty risk; in exchange for exposure to the clearing house’s procyclical model. 13. Every figure is below EUR 50 million: under the threshold, no initial margin would be exchanged bilaterally for this book alone. 14. In a crisis both rise: variation margin moves daily with prices and must be paid in cash; initial margin rises with volatility. Together they drain liquidity at the worst time. 15. The clearing house’s own model (or a replica) run on stress scenarios, not the calm-period margin. 16. A feature for the clearing house’s safety, a flaw for the system’s liquidity: it transfers stress to members when they can least bear it. 17. Members, through higher margin in calm times, which they must fund. 18. By the margin increase in severe historical and hypothetical stresses (here more than 6 million in three weeks), plus variation margin, with collateral that can be delivered on the day. 19. Named result: the margin calls of March 2020: the filtered model called USD 6.09 million of new margin; with a 25% buffer 5.04 million and with a 25% stressed weight 5.51 million. 20. Protection of the counterparty against predictability and liquidity for the payer.
25.10 Interview questions
Interview question 25.1 ★ risk, trader
What is initial margin for, and how does a clearing house compute it?
Solution
Solution of Interview question 25.1.
It covers the loss of closing out a defaulter’s portfolio over the margin period of risk at a high confidence. Clearing houses use historical, filtered or scenario models on the member’s whole portfolio, at least 99% over a few days.
What the interviewer is looking for: purpose, horizon, confidence and method.
Interview question 25.2 ★★ risk
Explain procyclicality of margin and name three tools against it.
Solution
Solution of Interview question 25.2.
Margin rises with volatility, so members must post more exactly in stress, which forces sales and adds to stress. Tools: buffers released in stress, stressed-period weights, long look-backs and volatility floors.
What the interviewer is looking for: the feedback and three tools.
Interview question 25.3 ★★ developer, risk
How does a sensitivity-based bilateral margin model work?
Solution
Solution of Interview question 25.3.
Compute sensitivities per risk factor (delta by tenor, vega, curvature), multiply by calibrated risk weights, aggregate within buckets with correlations and across buckets and classes; parameters are recalibrated periodically on stress-inclusive histories.
What the interviewer is looking for: sensitivities, weights, correlations and calibration.
Interview question 25.4 ★★ trader, bank
Why can two clearing houses charge different margin for the same swap?
Solution
Solution of Interview question 25.4.
Different models (historical, filtered, scenario), look-backs, margin periods of risk, confidence levels, APC tools, add-ons for concentration and liquidity, and netting sets.
What the interviewer is looking for: model and parameter differences.
Interview question 25.5 ★★★ researcher, risk
How would you backtest a margin model, and what makes it hard?
Solution
Solution of Interview question 25.5.
Compare realised losses over the margin period of risk with the margin held, per portfolio, and test frequency and clustering; hard because portfolios change, windows overlap, stress is rare, and the right loss includes liquidation costs.
What the interviewer is looking for: the procedure and its difficulties.
Interview question 25.6 ★★★ bank
What did March 2020 teach about margin and liquidity?
Solution
Solution of Interview question 25.6.
Margin calls, initial and variation, were large, fast and synchronised; firms that had not forecast them sold assets into falling markets. Margin models need to be predictable, and firms need liquidity plans built on stressed margin.
What the interviewer is looking for: liquidity effects and predictability.