Strategies II: Volatility, Relative Value, Macro and the Bank Desks · Strategies
13Supply Trades
Treasuries cheapen in the days before a large auction and recover after, although every auction’s date and size are announced in advance. Lou, Yan and Zhang documented the pattern and put the Treasury’s hidden cost at 9 to 18 basis points of each auction’s size. Dealers must absorb the supply, and they are paid for it. From 2010 to September 2026, the ten-year yield rose 1.98 basis points on average over the five days before its 301 auctions ( = 3.0), and the thirty-year 2.56 before its 234 ( = 3.6). On this chapter’s synthetic market, a trade that is short duration before each auction and long after earns 3.44 basis points of yield per auction ( = 3.1 over 239), a Sharpe ratio of 0.70 a year, while any single auction’s result swings by tens of basis points. The build is firm.supplytrade.
13.1 Auction concessions
Definition 13.1 (Auction concession)
An auction concession is the cheapening of a security, and of those close to it, in the days before a new issue is sold: the price the market charges for absorbing a known supply, recovered in part once the issue has been distributed.
The new-issue concession of a single corporate bond (Book 2, chapter 21) is the same idea for one issuer. Fleming, Nguyen and Rosenberg studied US Treasury dealer positions from 1990 to 2020. Issuance was the main driver of dealers’ weekly inventory changes. Those changes were only partly offset in adjacent weeks and not significantly hedged with futures, and dealers were paid for the inventory risk by later price appreciation. After the crisis, as balance sheet grew dearer, dealers took smaller positions and laid them off faster. Investment funds’ growing participation in auctions has reduced the compensation.
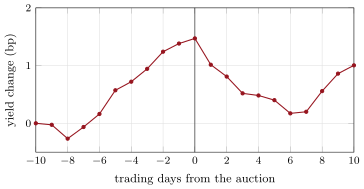
The pattern is visible in the public data (Figure 13.1). Group each note and bond auction from 2010 to 2026 with its nearest benchmark and measure that benchmark’s constant-maturity yield around the auction day. Pooled over 1 338 auctions, the yield is 1.47 basis points higher on auction day than ten days before, and 5 days later it has given back most of that: 0.40 above. The pattern differs by maturity:
| 2010–2026 | auctions | 5 days before (bp) | 5 days after (bp) | ||
|---|---|---|---|---|---|
| 2-year | 354 | ||||
| 5-year | 249 | 1.03 | 1.5 | ||
| 7-year | 200 | ||||
| 10-year | 301 | 1.98 | 3.0 | ||
| 30-year | 234 | 2.56 | 3.6 |
The long end cheapens before, and the 5- and 7-year richen after. The 2-year shows nothing. Sorted by offering size, the ten-year’s rise before the auction grows with size: 1.48 basis points for auctions averaging $14.5 billion, 1.69 for $22.3 billion, 2.95 for $36.2 billion. Its fall after does not: , and . The constant-maturity yield is an end-of-day series, so on auction day it already includes the auction’s result.
s2_fetch_auctions.13.2 New-issue and on-the-run premia
Definition 13.2 (On-the-run premium)
The on-the-run premium is the amount by which the most recently issued security at a maturity trades rich to older securities of similar maturity, for its liquidity and its value in repo; it shrinks as the issue ages and a newer one takes its place.
The premium shapes what a supply trade holds. The new issue is cheap to the curve before its auction and becomes the rich on-the-run after it. The issue it replaces loses its status and cheapens. The Board’s fitted curve (chapter 10) leaves out the on-the-run and first off-the-run issues for this reason. A roll trade sells the old on-the-run issue and buys the new one around the auction. It bets that the premium moves from one to the other more slowly than the market prices.
13.3 Corporate supply
Corporate issuance works the same way with smaller, less predictable deals. Issuers announce in the morning and price by the afternoon, and dealers and investors buy at a concession to the issuer’s existing bonds. Heavy issuance weeks cheapen the whole sector. Before a large deal the issuer’s own bonds and close substitutes are sold, or hedged with swaps and Treasuries, and the hedges come off afterwards. The effect is predictable when the calendar is. It is also crowded: many desks know the calendar.
Definition 13.3 (Supply trade)
A supply trade takes the opposite side of known, scheduled supply: short (or underweight) the securities about to be issued and their close substitutes before the sale, long after it, paid by the issuer’s and the dealers’ need to distribute the supply.
13.4 Trading around the calendar
firm.supplytrade makes the concession explicit (Listing 13.1). A benchmark yield carries 5.5 basis points a day of noise and a monthly auction of $20 to $45 billion. Dealers’ capacity to absorb each auction varies (a lognormal with dispersion 0.4). In the five days before an auction the yield rises by 0.07 basis points per billion at average capacity, 2.60 on average, and in the five days after it gives back 70% of the rise. The trade is short duration from five days before to the auction’s close and long for five days after, paying 0.1 basis points of yield per leg in futures.
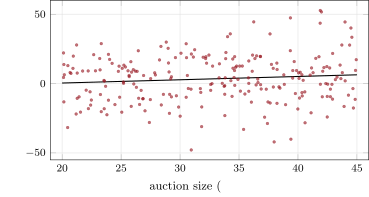
Over twenty years and 239 auctions it earns 3.44 basis points per auction ( = 3.1): 1.71 from the leg before and 1.72 from the leg after. At 12 auctions a year that is a Sharpe ratio of 0.70, and 0.50 for either leg alone. Sorted by size, the average rises from 1.66 basis points in the smallest third to 4.94 in the middle and 3.72 in the largest. Each billion of size adds 0.24 basis points to the trade on average (Figure 13.2). The noise is far larger than the effect: single auctions range from to basis points. Dealers’ capacity, which the trader does not see, decides as much as size. The slope on size over capacity is 0.16 per unit.
s2_supply.results.13.5 Strategy files
Strategy file 13.1 — Pre-auction short, post-auction long
Who pays you, and why. The Treasury, through the concession it pays to distribute supply; dealers with limited capacity.
Instruments and venues. Treasury futures or the benchmark and its neighbours; the when-issued market.
Signal. The auction calendar and size; dealer positioning where visible.
Sizing and execution. Small per auction, many auctions; futures for low cost.
Costs. Futures fees and bid–ask; roll.
How it dies. More non-dealer demand at auctions; crowding by others trading the calendar.
Horizon, capacity, infrastructure. Days; the calendar.
Backtest honestly. Yields at the actual trade times, not end of day.
Sources. Lou, Yan and Zhang (2013); 2010–2026 yields: basis points before 10-year auctions; this chapter: 3.44 per auction, Sharpe ratio 0.70.
Strategy file 13.2 — On-the-run roll
Who pays you, and why. Holders who pay for on-the-run liquidity and repo value.
Instruments and venues. The new and the old on-the-run issues.
Signal. The yield spread between them against its pattern over the cycle.
Sizing and execution. DV01-matched; the short financed in reverse repo.
Costs. Specialness of the issue shorted.
How it dies. A flight to liquidity widens the premium.
Horizon, capacity, infrastructure. An auction cycle.
Backtest honestly. Special repo rates.
Sources. No performance figure verified.
Strategy file 13.3 — Corporate new-issue concession
Who pays you, and why. Issuers who price new bonds below their existing ones to sell them quickly.
Instruments and venues. New corporate bonds at allocation; the issuer’s secondary bonds.
Signal. The concession against the issuer’s curve.
Sizing and execution. Allocations; hedged with Treasuries or swaps.
Costs. Allocations smaller than orders; secondary spreads.
How it dies. Crowded books that shrink the concession.
Horizon, capacity, infrastructure. Days; relationships with underwriters.
Backtest honestly. Actual allocations, not orders.
Sources. No performance figure verified.
Strategy file 13.4 — Month-end index extension
Who pays you, and why. Index-tracking investors who must add duration when the index’s duration rises at month-end, as new issues enter it.
Instruments and venues. Long bonds or futures before month-end.
Signal. The index’s announced extension.
Sizing and execution. Positions before the rebalancing, unwound after.
Costs. Futures fees.
How it dies. Many desks trade the same calendar.
Horizon, capacity, infrastructure. Days.
Backtest honestly. Extension figures as published before month-end.
Sources. No figure verified.
13.6 Tutorial: paid to absorb
Goal. Simulate an auction calendar with planted concessions, trade it, and measure the real pattern around 2010–2026 auctions. End state: the tables and the two figures.
Auctions and the trade.
def simulate_auctions(cfg: SupplyConfig | None = None) -> dict:
    cfg = cfg or SupplyConfig()
    rng = np.random.default_rng(cfg.seed)
    T = cfg.years * YEAR
    days = np.arange(cfg.every, T - cfg.window - 1, cfg.every)
    size = rng.uniform(cfg.size_lo, cfg.size_hi, len(days))
    capacity = np.exp(cfg.capacity_sd * rng.standard_normal(len(days)) - 0.5 * cfg.capacity_sd**2)
    concession = cfg.beta * size / capacity
    drift = np.zeros(T)
    for d, c in zip(days, concession, strict=True):
        drift[d - cfg.window + 1:d + 1] += c / cfg.window
        drift[d + 1:d + 1 + cfg.window] -= cfg.giveback * c / cfg.window
    y = 400.0 + np.cumsum(drift + cfg.daily_vol * rng.standard_normal(T))
    return {"y": y, "days": days, "size": size, "capacity": capacity, "concession": concession}


def supply_trade(sim: dict, cfg: SupplyConfig | None = None, pre: bool = True, post: bool = True) -> dict:
    """Per auction: short duration over the window before (gains when yields rise), long over the window after."""
    cfg = cfg or SupplyConfig()
    y, w = sim["y"], cfg.window
    before = np.array([y[d] - y[d - w] for d in sim["days"]])
    after = np.array([y[d] - y[d + w] for d in sim["days"]])
    legs = (2 if pre else 0) + (2 if post else 0)
    pnl = (before if pre else 0.0) + (after if post else 0.0) - legs * cfg.cost
    return {"before": before, "after": after, "pnl": pnl}
Listing 13.1. A calendar with concessions over size and capacity, and the trade’s legs. code/firm/supplytrade/firm_supplytrade.py Results.
def results():
    """Per auction (bp of yield): mean, t, Sharpe a year (12 auctions) for both legs and each alone; by third of size;
    the slope of the P&L on size, and on size over capacity (which a trader does not see)."""
    cfg, sim = market()
    out = {}
    for name, pre, post in (("both", True, True), ("before", True, False), ("after", False, True)):
        p = supply_trade(sim, cfg, pre, post)["pnl"]
        out[name] = {"mean": float(p.mean()), "t": float(p.mean() / p.std(ddof=1) * math.sqrt(len(p))),
                     "sr": float(p.mean() / p.std(ddof=1) * math.sqrt(12)), "n": len(p)}
    p = supply_trade(sim, cfg)["pnl"]
    q = np.quantile(sim["size"], [1 / 3, 2 / 3])
    groups = (sim["size"] <= q[0], (sim["size"] > q[0]) & (sim["size"] <= q[1]), sim["size"] > q[1])
    out["terciles"] = [{"size": float(sim["size"][m].mean()), "mean": float(p[m].mean())} for m in groups]
    out["slope_size"] = float(np.polyfit(sim["size"], p, 1)[0])
    out["slope_pressure"] = float(np.polyfit(sim["size"] / sim["capacity"], p, 1)[0])
    out["concession_mean"] = float(sim["concession"].mean())
    return out
Listing 13.2. By leg, by size, and against size. code/strategies-2/13-supply-trades/python/s2_supply.py - Run
s2_fetch_auctions.pyonce, thenresults()andfig_supply.py.
What to change next. Give the trader a noisy signal of dealer capacity and trade only when it is low; add an on-the-run premium that moves at each auction; use intraday yields at the auction time.
13.7 Build: supply trades
Purpose. An auction calendar with concessions proportional to size over dealer capacity, and the trade around it.
Interface. SupplyConfig(…), simulate_auctions(cfg), supply_trade(sim, cfg, pre, post).
Rules. The concession builds over the five days before and is partly given back over the five after; costs per leg.
Acceptance tests. code/firm/supplytrade/tests/: without noise the trade earns the concession and its giveback; costs per leg; concessions scale with size over capacity.
Stretch. Several maturities; reopenings; an on-the-run premium.
Sources and further reading
- D. Lou, H. Yan and J. Zhang, “Anticipated and repeated shocks in liquid markets”, Review of Financial Studies 26(8), 2013.
- M. Fleming, G. Nguyen and J. Rosenberg, “How do Treasury dealers manage their positions?”, Federal Reserve Bank of New York Staff Report 299, revised 2024.
- TreasuryDirect auction records; Board of Governors H.15 yields, via FRED.
13.8 Exercises
Exercise 13.1 ★
An auction of $40 billion at average capacity carries a concession of 0.07 basis points per billion. How large is it?
Solution
Solution of Exercise 13.1.
basis points.
Exercise 13.2 ★
A trade earns 3.44 basis points per auction with a standard deviation of about 17 basis points, 12 times a year. What is its Sharpe ratio a year?
Solution
Solution of Exercise 13.2.
.
Exercise 13.3 ★
Lou, Yan and Zhang put the hidden cost at 9 to 18 basis points of the auction size. What is that on a $40 billion auction?
Solution
Solution of Exercise 13.3.
billion million to billion million.
Exercise 13.4 ★★
Why can a known, announced supply move prices at all?
Solution
Solution of Exercise 13.4.
Knowing the supply is not the same as having the balance sheet to hold it: dealers and investors must make room for the new bonds, and those with capacity charge for it. End-investors come slowly, so the price moves until they do.
Exercise 13.5 ★★
Why might the compensation for absorbing auctions have fallen since 2008?
Solution
Solution of Exercise 13.5.
Dealers’ balance sheet grew dearer after the crisis, so they take smaller positions and lay them off faster; and investment funds now bid more at auctions directly, sharing the supply that dealers once absorbed.
Exercise 13.6 ★★
Why does an end-of-day yield understate the concession on auction day?
Solution
Solution of Exercise 13.6.
The auction closes at 1 p.m., and the end-of-day yield already includes part of the recovery after it; the day’s pre-auction cheapening is partly hidden.
Exercise 13.7 ★★★
Coding. Rerun with SupplyConfig(giveback=0.0). What happens to each leg, and what does it say about which leg is the dealers’ compensation?
Solution
Solution of Exercise 13.7.
The leg before is unchanged (1.71 basis points per auction); the leg after earns only its costs (); the two together 1.62. The concession paid before the auction is what dealers are compensated with; the recovery after is a separate bet that end-investors will buy.
Exercise 13.8 ★★★
Find the flaw. “The last three auctions each lost us 20 basis points, so the supply effect has gone.”
Solution
Solution of Exercise 13.8.
Single auctions have a standard deviation of about 17 basis points against a mean of 3.44; three losses of 20 are well within the noise. It takes dozens of auctions to detect the effect, and as many to detect its disappearance.
13.9 Problem: Paid to Absorb
Problem 13.1
Weekend problem — trading the auction calendar
The chapter’s synthetic calendar, 2010–2026 auctions and the public record.
Part I — Concessions.
- Define an auction concession and the on-the-run premium.
- What did Lou, Yan and Zhang find, and what did they estimate?
- What did Fleming, Nguyen and Rosenberg find about dealers?
- Why does the Board’s curve exclude the newest issues?
Part II — The real pattern.
- Give the average path around auctions.
- Which maturities cheapen before, and which richen after?
- How does the 10-year’s pattern vary with size?
- What does the end-of-day series miss?
Part III — The synthetic trade.
- Define the supply trade.
- Describe the synthetic concession.
- Give the trade’s mean per auction, -statistic and Sharpe ratio, and each leg’s.
- Why is any one auction’s result so noisy?
Part IV — The verdict.
- State the named result: the auction trade’s return per auction and its dependence on auction size.
- What does dealers’ capacity add?
- How would you trade corporate supply?
- What is the month-end extension trade?
- How would you backtest the auction trade honestly?
- Which strategy file depends on repo?
- How does this chapter relate to chapter 10?
- In one sentence: who pays the supply trader?
Solution
Solution of Problem 13.1.
- The cheapening before a new issue, recovered after; the premium of the newest issue at a maturity.
- Prices fall before auctions and recover after; a hidden cost of 9 to 18 basis points of size.
- Issuance drives dealer inventories; dealers are paid by later appreciation; the pay has fallen with higher balance-sheet costs and more fund participation.
- They trade at a premium for liquidity and repo value.
- Pooled, 1.47 basis points up on auction day from ten days before, 0.40 five days after.
- The 10- and 30-year cheapen before; the 5- and 7-year richen after; the 2-year shows nothing.
- The rise before grows with size (1.48, 1.69, 2.95 basis points by third); the fall after does not.
- The part of the auction day before 1 p.m.
- Short known supply before its sale, long after.
- 0.07 basis points per billion at average capacity, 70% given back after.
- 3.44 per auction, = 3.1, Sharpe ratio 0.70; each leg about 1.7 and 0.50.
- Daily noise of 5.5 basis points over ten days swamps a concession of 2.6.
- Named result. The auction trade earns 3.44 basis points of yield per auction ( = 3.1, Sharpe ratio 0.70 a year), and each billion of size adds 0.24 basis points on average, though any single auction’s result is noise.
- As much as size: the concession is size over capacity.
- Around the calendar of large deals, hedged with Treasuries or swaps, taking allocations at the concession.
- Buying duration before the index’s month-end extension, for index trackers’ demand.
- Yields at the trade times, costs per leg, many auctions.
- The on-the-run roll.
- Chapter 10’s fitted curve excludes the issues this chapter trades around.
- The issuer, through the concession it pays for quick distribution.
13.10 Interview questions
Interview question 13.1 ★ trader
Why would Treasuries cheapen before an auction everyone knows about?
Solution
Solution of Interview question 13.1.
Dealers must absorb the new supply with limited balance sheet, and end-investors arrive slowly; the market prices in the cost of holding the supply until it is distributed.
Interview question 13.2 ★★ researcher
How would you measure the auction concession, and what would you control for?
Solution
Solution of Interview question 13.2.
Measure yield changes of the auctioned security and close substitutes over windows before and after each auction, relative to a benchmark or a fitted curve; control for macro news, month-end, other auctions nearby and the level of rates.
Interview question 13.3 ★★ trader
You are a dealer bidding in tomorrow’s ten-year auction. How do you hedge?
Solution
Solution of Interview question 13.3.
Short futures or the when-issued security before the auction in proportion to the expected award, and adjust after the result; plan the distribution of the bonds to clients.
Interview question 13.4 ★★ risk
A desk runs the auction trade each month. What is its risk?
Solution
Solution of Interview question 13.4.
Macro news around auction dates dominates any one auction; the effect can shrink as more desks trade it; costs and crowding in futures near the auction.
Interview question 13.5 ★★ developer
Design a data pipeline for auction announcements and results.
Solution
Solution of Interview question 13.5.
Announcements (date, size, security), results (high yield, bid-to-cover, allotments) and when-issued quotes, with timestamps; checks on reopenings and changes to the calendar; a store keyed by CUSIP and auction date.
Interview question 13.6 ★★★ researcher
With daily yield noise of basis points and a concession built over days, how many auctions does it take to detect with a of 2?
Solution
Solution of Interview question 13.6.
Over a window of days the noise is ; with auctions the mean’s standard error is , so gives : with , and , about 90 auctions for the leg before.