Strategies II: Volatility, Relative Value, Macro and the Bank Desks · Strategies
7Tail Hedging and Long Volatility
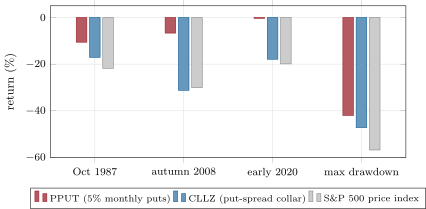
A tail hedge that bleeds a little every month is the most disliked position in a portfolio for years, until the month it pays for all of them. Cboe’s 5% Put Protection Index, which holds the S&P 500 and buys a 5% out-of-the-money put every month, lost 10.6% in October 1987 when the index fell 21.8%, and 0.4% over February and March 2020 when the index fell 19.9%. From July 2007 to March 2009 it still lost 42.0%, because monthly puts protect against a crash but not against a slow bear market. On this chapter’s synthetic market a monthly put programme costs 6.0% a year in years without a crash, pays 19.2% and 39.5% in two of the three crash years, and leaves the portfolio growing at 2.5% a year against 3.0% unhedged, with its worst drawdown cut from 73% to 41%. Whether that was worth it depends on what the hedge lets the rest of the portfolio do. The build is firm.tailhedge.
7.1 The cost of convexity
Definition 7.1 (Tail hedge)
A tail hedge is a position held to pay off in large, rare market falls, such as out-of-the-money puts, put spreads, long variance or volatility futures, bought at a cost in ordinary times in exchange for convexity in a crash.
Definition 7.2 (Hedge bleed)
The hedge bleed is a tail hedge’s cost in periods without a crash: premiums paid less payoffs received, as a share of the portfolio, per year.
An out-of-the-money put is priced at its point on the smile, which for index puts is above the at-the-money vol. That vol already carries the variance premium of chapter 1. The buyer pays both premiums, the one the seller of chapter 1 collects. Harvey and co-authors compared defensive strategies over large equity drawdowns and recessions. Continuously holding short-dated S&P 500 puts was the most reliable defence and also the most costly.
firm.tailhedge runs put programmes on the synthetic index of chapter 1. It is twenty years long, with three planted crashes of 20% to 30% in ten days, in years 5, 12 and 17. Options are priced on a steeper smile than chapter 1’s (skew per standardised unit, curvature 0.02). The portfolio holds the index and one put per unit of index, and at each roll it sets its units so that equity and puts cover the same notional (Listing 7.1).
7.2 Put programmes and their monetisation
Definition 7.3 (Hedge monetisation)
Hedge monetisation is the rule for selling a tail hedge that has gained, before its expiry, and replacing it at the new market level: for instance, when the put is worth three times what it cost. It turns a paper gain into cash that can be reinvested, and restores protection near the new spot.
Cboe’s indices show the real shape (Figure 7.1). From June 1986 to September 2026, PPUT, which is a total-return index, grew at a log rate of 7.7% a year with a volatility of 13.5%. CLLZ holds the S&P 500, buys a 2.5%–5% put spread each month and pays for it by selling a call. It grew at 7.8% with a volatility of 14.6%. The S&P 500 price index grew at 8.5% with a volatility of 18.4%. The price index omits dividends, so the return gap understates the hedges’ cost. PPUT’s worst 21 days cost 13.5%, the index’s 33.0%. In the crash of autumn 2008, September to November, PPUT lost 6.7%, the index 30.1% and CLLZ 31.2%: a put spread protects only the fall between its strikes. The largest drawdowns tell the rest. PPUT lost 42.0% from July 2007 to March 2009, when the index lost 56.8%. The fall took twenty months, and a put struck 5% below each month’s start pays only for the part of that month’s fall beyond 5%.
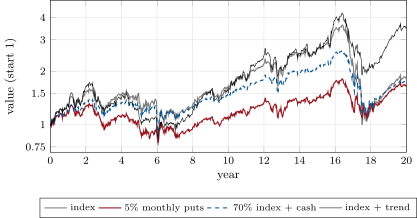
s2_fetch_protect.On the synthetic market the programmes compare as follows, each against the index and against the simplest alternative, a static 70% in the index and 30% in cash rebalanced monthly:
| twenty years | growth (%/yr) | volatility (%) | max drawdown (%) | worst month (%) |
|---|---|---|---|---|
| index | 3.0 | 19.0 | ||
| 5% puts, monthly | 2.5 | 13.9 | ||
| 10% puts, monthly | 3.2 | 16.0 | ||
| 10% puts, quarterly | 3.0 | 14.0 | ||
| 20% puts, quarterly | 4.2 | 16.2 | ||
| 10% quarterly, monetised at 3 | 2.2 | 14.0 | ||
| 20% puts, half-yearly | 4.6 | 15.5 | ||
| 70% index, 30% cash | 2.8 | 13.2 | ||
| index + trend overlay | 6.3 | 17.6 |
The yearly accounting is the hedge’s own. Over the 17 calm years, the monthly 5% programme bled 6.0% of the portfolio a year. In the three crash years it earned 19.2%, lost 2.7% and earned 39.5%. The second crash came when the index’s vol stood at 3.9% and the put was cheap, and the put still paid only 12.0% of the portfolio in the crash’s own weeks, against 30.0% and 29.2% in the other two. After a crash vol stays high for months, and the puts bought then are dear: that year’s bleed consumed the payoff. Farther puts bleed less (1.5% a year for 20% half-yearly puts) and pay later and less (2.0%, and 26.3%). The monetised programme sold its puts eleven times at three times their cost. It earned the most in the first crash year (16.3%), selling early in the fall. It then held only protection struck near the new, lower spot, and the rest of the fall passed below it: its drawdown, 62%, is the worst of the programmes.
7.3 Alternatives: trend, long vol, variance
Harvey and co-authors found that futures time-series momentum did well in extended sell-offs and a quality long–short strategy in flights to quality. Treasuries carry positively, but the post-2000 negative correlation between bonds and equities is a historical rarity. Long gold and long credit protection sat between puts and bonds in cost and reliability. On the synthetic index, a trend overlay adds half the index’s notional in the direction of its trailing year’s return. It grows at 6.3% a year with a 56% drawdown and a worst month of : better than the puts on growth, worse on drawdown. It needs a sell-off long enough for the signal to turn. Crisis alpha of that kind (Book 8, chapter 19) and the convexity of an option insure different things.
Long variance and long VIX futures are the volatility book’s versions of the hedge. They pay the variance premium and the roll-down of chapter 5 in ordinary times, and pay out in a spike of volatility whether or not the index gaps. They need their own monetisation rule, since a variance position’s gain can disappear within weeks once volatility falls back.
7.4 Judging a hedge by the portfolio
Israelov’s warning is the test to apply. In the typical use, puts were quite ineffective at reducing drawdowns compared with the simple alternative of statically holding less of the index. Unless purchases and maturities are timed right around the drawdown, they may add to drawdowns and to volatility per unit of expected return. The synthetic market is kind to puts: its crashes are fast, ten days each, which is the case a put is built for. There the 5% monthly programme beats the static mix on drawdown ( against at similar volatility) and loses on growth (2.5% against 2.8%). The real index’s worst drawdown was slow, and PPUT lost 42.0% of it.
So a hedge is judged by what it lets the portfolio do. With a hedge that caps the loss, the rest of the portfolio can hold more risk, so the cost comes back as extra exposure. Without that, the hedge is a drag with a good story. The growth rate is the measure, over a history long enough to contain crashes of both kinds.
s2_tailhedge.curves.7.5 Strategy files
Strategy file 7.1 — Rolling out-of-the-money put programme
Who pays you, and why. Nobody, on average: the buyer pays the variance and skew premiums for convexity in a crash.
Instruments and venues. Listed index puts, monthly to half-yearly, 5% to 20% out of the money.
Signal. None; a programme, not a trade. Some programmes buy more when protection is cheap.
Sizing and execution. A fixed budget a year, rolled mechanically; monetisation rules decided in advance.
Costs. Premiums and spreads; the bleed.
How it dies. Slow bear markets that fall within each put’s strike; being abandoned after years of bleed, just before it pays.
Horizon, capacity, infrastructure. Years; large capacity in index options.
Backtest honestly. Include slow and fast drawdowns; compare with statically holding less.
Sources. Israelov (2019); Harvey and co-authors (2019); Cboe PPUT: from July 2007 to March 2009; this chapter: a 6.0% bleed a year and a drawdown cut from 73% to 41%.
Strategy file 7.2 — Put spread collar
Who pays you, and why. The call buyer finances the put spread; the holder gives up upside to cap a band of downside.
Instruments and venues. Index put spreads and calls, monthly.
Signal. None; a programme.
Sizing and execution. Zero-cost by construction: the call’s strike set so that its premium pays for the put spread.
Costs. Spreads on three options a month; the upside given away.
How it dies. A crash beyond the put spread’s lower strike: CLLZ lost 31.2% in autumn 2008.
Horizon, capacity, infrastructure. Months; a mechanical roll.
Backtest honestly. Measure crashes below the lower strike, not only the band.
Sources. Cboe CLLZ (derived statistics in this chapter).
Strategy file 7.3 — Long variance with monetisation
Who pays you, and why. Nobody, on average: it pays the variance premium for a payoff in volatility spikes.
Instruments and venues. Variance swaps, VIX futures or calls.
Signal. Cheap volatility against its history; the slope of the VIX curve.
Sizing and execution. A budget; monetise at a set multiple or when volatility has spiked and the curve inverts.
Costs. The variance premium; the roll-down of VIX futures.
How it dies. Spikes that fade before monetisation; a crash with little volatility.
Horizon, capacity, infrastructure. Months; variance or VIX access.
Backtest honestly. Use the price at the monetisation time, not the peak.
Sources. Harvey and co-authors (2019) on defensive strategies; no performance figure verified.
7.6 Tutorial: paying for the month that pays
Goal. Run put programmes of several strikes, tenors and monetisation rules on the synthetic index, compare them with a static mix and a trend overlay, and read Cboe’s protection indices. End state: the table and the two figures.
The programme.
def put_programme(r, v, cfg, otm: float = 0.05, tenor: int = 21, monetise: float | None = None) -> dict:
    T = len(r)
    S = np.concatenate([[1.0], np.exp(np.cumsum(r))])
    nav, pnl = np.ones(T + 1), np.zeros(T)
    q, K, expiry, n_mon, rolls = 0.0, 0.0, 0, 0, 0
    cost = 0.0
    for t in range(T + 1):
        if t == expiry or t == 0:                                   # roll: buy a new put
            K, expiry = S[t] * (1 - otm), t + tenor
            cost = _put(S[t], K, tenor / YEAR, v[min(t, T - 1)], cfg)
            q, rolls = nav[t] / (S[t] + cost), rolls + 1
        if t == T:
            break
        p0 = _put(S[t], K, (expiry - t) / YEAR, v[t], cfg)
        p1 = max(K - S[t + 1], 0.0) if t + 1 == expiry else _put(S[t + 1], K, (expiry - t - 1) / YEAR,
                                                                    v[min(t + 1, T - 1)], cfg)
        pnl[t] = q * (p1 - p0)
        nav[t + 1] = nav[t] + q * (S[t + 1] - S[t]) + pnl[t]
        if monetise and t + 1 < expiry and p1 >= monetise * cost:  # sell and replace at the new spot
            expiry, n_mon = t + 1, n_mon + 1
    return {"nav": nav, "hedge_pnl": pnl, "rolls": rolls, "monetised": n_mon, "S": S}
Listing 7.1. A rolling put programme with monetisation, fully invested. code/firm/tailhedge/firm_tailhedge.py The bleed.
def bleed():
    """Each programme's hedge P&L (per unit of starting value, summed by year of 252 days): mean in years without a
    crash start and the sum over the crash years."""
    _, sim = market()
    starts = [s for s, _ in sim["crashes"]]
    n = len(sim["r"]) // YEAR
    crash_years = {s // YEAR for s in starts}
    out = {}
    for name, p in portfolios().items():
        if p["hedge_pnl"] is None:
            continue
        nav = p["nav"]
        yearly = [p["hedge_pnl"][y * YEAR:(y + 1) * YEAR].sum() / nav[y * YEAR] for y in range(n)]
        calm = [x for y, x in enumerate(yearly) if y not in crash_years]
        out[name] = {"bleed": float(np.mean(calm)), "crash_years": [float(yearly[y]) for y in sorted(crash_years)]}
    return out
Listing 7.2. Each programme’s yearly hedge P&L, calm years and crash years. code/strategies-2/07-tail-hedging-and-long-volatility/python/s2_tailhedge.py - Run
s2_fetch_protect.pyonce, thentable(),bleed()andfig_tailhedge.py.
What to change next. Plant a slow bear market (a year of steady decline) and rerun; lever the hedged portfolio to the unhedged one’s volatility and compare growth; buy puts only when the skew is flat.
7.7 Build: tail hedge
Purpose. Rolling put programmes with monetisation, static mixes and trend overlays, judged by growth, volatility and drawdown.
Interface. put_vol(S, K, tau, v, cfg), put_programme(r, v, cfg, otm, tenor, monetise), static_mix(r, weight, every), trend_overlay(r, weight, lookback), evaluate(nav).
Rules. Puts priced and marked on the surface with the smile clipped; fully invested at each roll; monetisation replaces the put at the new spot.
Acceptance tests. code/firm/tailhedge/tests/: a still market only bleeds; the put covers a fall below its strike; a static mix, a trend overlay and a drawdown by hand.
Stretch. Put spreads and collars; variance and VIX hedges; leverage to a target volatility.
Sources and further reading
- R. Israelov, “Pathetic protection: the elusive benefits of protective puts”, Journal of Alternative Investments 21(3), 2019.
- C. R. Harvey, E. Hoyle, S. Rattray, M. Sargaison, D. Taylor and O. Van Hemert, “The best of strategies for the worst of times: can portfolios be crisis proofed?”, Journal of Portfolio Management 45(5), 2019.
- Cboe, S&P 500 Put Protection Indices methodology; Cboe Insights on PPUT, CLL and CLLZ, 2021.
- Cboe Global Markets, daily histories of PPUT, CLLZ and SPX.
7.8 Exercises
Exercise 7.1 ★
A put programme bleeds 6.0% a year in calm years. Over 17 calm years and three crash years paying 19.2%, and 39.5%, what is its total, ignoring compounding?
Solution
Solution of Exercise 7.1.
of the portfolio, summed without compounding: the hedge lost money over the twenty years, and the portfolio’s growth fell from 3.0% to 2.5% a year while its worst drawdown fell from 73% to 41%.
Exercise 7.2 ★
Why does a monthly 5% put fail to protect against a fall of 1% a week for a year?
Solution
Solution of Exercise 7.2.
Each month’s put is struck 5% below that month’s starting level, and each month the index falls about 4%: no put ever ends in the money, and every premium is lost while the index falls about 40% over the year.
Exercise 7.3 ★
A put costs 1% of notional and is monetised at three times its cost. What is it worth when sold?
Solution
Solution of Exercise 7.3.
Three times its cost: 3% of notional.
Exercise 7.4 ★★
Why did CLLZ lose almost as much as the index in autumn 2008 while PPUT lost 6.7%?
Solution
Solution of Exercise 7.4.
CLLZ’s put spread protects only between 95% and 97.5% of the level; a fall of 30% passes through the spread, and the short call gives up any rebound. PPUT’s single put protects all the way down.
Exercise 7.5 ★★
Why is the return gap between PPUT and the S&P 500 price index an understatement of the hedge’s cost?
Solution
Solution of Exercise 7.5.
PPUT is a total-return index that reinvests dividends; the S&P 500 price index does not. The true benchmark grows faster than the price index, so the true shortfall of the hedged index is larger than the gap shown.
Exercise 7.6 ★★
How does a trend overlay’s protection differ from a put’s?
Solution
Solution of Exercise 7.6.
A trend overlay turns short only after the trailing return has turned negative: it protects in long sell-offs and does nothing in a crash of days. A put protects from its strike at once, whatever the path, and costs a premium whether or not a crash comes.
Exercise 7.7 ★★★
Coding. Run slow_bear(), which adds a steady decline of 40% in log terms over year 8 of the synthetic index, and compare the year’s loss of the 5% monthly programme, the static mix and the index. Which protects better, and why?
Solution
Solution of Exercise 7.7.
Over that year the index loses 28.7%, the static mix 21.0% and the put programme 32.4%, more than the unhedged index. Each month’s put is struck 5% below that month’s start and the index falls less than that within most months, so the puts rarely pay and their premiums, dearer as vol rises, add to the loss. It is Israelov’s point in the chapter’s model.
Exercise 7.8 ★★★
Find the flaw. “The hedge cost us 6% a year for five years; it does not work, so we are removing it.”
Solution
Solution of Exercise 7.8.
Five calm years say nothing about a hedge built for rare crashes: on the synthetic market the programme bled in 17 years out of 20 and paid 19.2% and 39.5% in two of the others. Judge it by the portfolio over a history with crashes, and decide in advance whether its cost buys extra exposure elsewhere.
7.9 Problem: Paying for the Month That Pays
Problem 7.1
Weekend problem — a tail-hedging programme
The chapter’s synthetic market, Cboe’s protection indices and the public record.
Part I — The cost.
- Define a tail hedge and its bleed.
- Which premiums does a put buyer pay?
- What did Harvey and co-authors find about puts and other defences?
- What did Israelov find?
Part II — The real indices.
- Give PPUT’s, CLLZ’s and the S&P 500’s growth and volatility.
- How did each fare in 1987, 2008 and 2020?
- Why did PPUT lose 42% from 2007 to 2009?
- Why does a put spread fail in a deep crash?
Part III — The programmes.
- Define monetisation.
- Compare the programmes’ growth and drawdowns.
- Give the 5% monthly programme’s bleed and crash-year payoffs.
- Why did monetising worsen the drawdown?
Part IV — The verdict.
- State the named result: the hedge’s annual bleed and the portfolio growth rate with and without it.
- How does the hedge compare with a static mix?
- How does it compare with a trend overlay?
- Why is the synthetic market kind to puts?
- How should a hedge be judged?
- How would you backtest a tail hedge honestly?
- Which strategy file suits a slow bear market best?
- In one sentence: what does a tail hedge buy?
Solution
Solution of Problem 7.1.
- A position that pays in large, rare falls, bought at a cost; its bleed is that cost in calm periods, as a share of the portfolio a year.
- The variance premium in the at-the-money vol and the skew premium of out-of-the-money puts.
- Short-dated puts are the most reliable and most costly defence; bonds are unreliable; trend and quality did well in drawdowns.
- Puts are often no better than statically holding less, unless timed right.
- PPUT 7.7% at 13.5%, CLLZ 7.8% at 14.6%, the S&P 500 price index 8.5% at 18.4% (without dividends).
- 1987: , , ; autumn 2008: , , ; February–March 2020: , , .
- The fall took twenty months; each month’s put paid only for that month’s fall beyond 5%.
- It protects only between its strikes.
- Selling a hedge that has gained before expiry and replacing it at the new level.
- From the table: 5% monthly puts 2.5% a year with a drawdown; 20% half-yearly 4.6% and ; monetised 2.2% and ; the index 3.0% and .
- A 6.0% bleed a year in 17 calm years; 19.2%, and 39.5% in the crash years.
- The replacement put, struck near the new lower spot, left the rest of the fall unprotected.
- Named result. The monthly 5% programme bleeds 6.0% of the portfolio a year in calm years; the hedged portfolio grows at 2.5% a year against 3.0% unhedged, with the worst drawdown cut from 73% to 41%.
- Similar volatility (13.9% against 13.2%), a smaller drawdown ( against ), lower growth (2.5% against 2.8%).
- The trend overlay grows faster (6.3%) with a deeper drawdown ().
- Its crashes last ten days, the case puts are built for; slow bear markets are absent.
- By the portfolio’s growth rate over crashes of both kinds, and by what extra exposure its protection allows.
- Fast and slow drawdowns, option prices on the smile, a static alternative, monetisation at the prices then.
- Trend (or holding less).
- Convexity in a crash, paid for in every other month.
7.10 Interview questions
Interview question 7.1 ★ trader
Why are out-of-the-money index puts expensive?
Solution
Solution of Interview question 7.1.
Buyers want crash protection and sellers must be paid to provide it: index puts carry the variance premium and the skew premium, both largest for out-of-the-money index puts.
Interview question 7.2 ★★ researcher
How would you compare a put programme with holding less equity?
Solution
Solution of Interview question 7.2.
Match the two on volatility or on expected drawdown, then compare growth rates and drawdowns over a history with fast and slow falls, as Israelov did; include costs and the timing of rolls.
Interview question 7.3 ★★ trader
Your puts are worth five times what you paid. Do you sell them?
Solution
Solution of Interview question 7.3.
Follow the rule set in advance. Selling locks in the gain for reinvestment and resets protection near the new level; keeping the puts keeps the protection against a further fall. A common compromise sells part and rolls the rest down.
Interview question 7.4 ★★ risk
What scenarios would you use to test a tail-hedging programme?
Solution
Solution of Interview question 7.4.
A fast crash, a slow year-long decline, a crash right after a roll and one right before, a volatility spike without a fall, and several calm years in a row to test the budget.
Interview question 7.5 ★★ developer
Design the daily process for a rolling put programme with monetisation rules.
Solution
Solution of Interview question 7.5.
Each day: mark the puts on the surface, check the monetisation rule against the cost recorded at purchase, roll on schedule, size new puts to the portfolio, record the bleed; with checks on stale option quotes and on roll dates.
Interview question 7.6 ★★★ researcher
Show that for a portfolio with log-normal returns the growth rate is approximately , and explain how a hedge that lowers can raise the growth rate even if it lowers .
Solution
Solution of Interview question 7.6.
With wealth growing by each period and log-normal with mean and variance , . A hedge that lowers by and by more than raises the growth rate: this is the case for a hedge that also allows a larger position in the risky asset.