Strategies II: Volatility, Relative Value, Macro and the Bank Desks · Strategies
24Flow Market Making at a Bank
A bank’s flow desk makes money by pricing clients, not by predicting prices. It learns which clients’ trades will move against it and charges them accordingly, and it keeps the risk of one client’s trade until another client’s offsets it. Butz and Oomen estimated that a representative large dealer takes several minutes on average to internalise a client’s trade in the most liquid currencies, and tens of minutes in emerging markets. On this chapter’s synthetic desk, pricing each client from its own history raises the franchise P&L from $6.63 million at the best of four flat prices to $7.60 million. Uninformed clients pay 1.39 basis points and informed ones stop trading. A small axe skew raises the share of risk internalised from 91% to 97%. The build is firm.flowmm.
24.1 The franchise and its P&L
Definition 24.1 (Franchise P&L)
The franchise P&L of a flow desk is its profit from serving clients, decomposed into spread capture (the price clients pay relative to mid), the marks of the inventory their trades leave (where adverse selection shows), and the cost of hedging what it does not internalise.
firm.flowmm sends a desk 200 000 requests for quote from 90 clients, each for one unit of $1 million, so that a basis point is $100. Sixty clients are uninformed: after they trade, the mid moves at random. Twenty are moderately informed: the mid drifts 0.8 basis points in their direction over the next ten requests. Ten are informed, with a drift of 2.5 basis points. The drift happens whoever fills the trade, so the mid path is the same whatever the desk quotes, and every pricing policy is compared on the same prices. Each client also has its own competing quote, the half-spread it can get elsewhere: 1.0 to 2.5 basis points for uninformed clients, some of them captive, 0.8 to 1.5 for the moderate ones and 0.4 to 0.8 for the informed ones, who shop around. A client takes the desk’s price with a probability that falls smoothly as the price rises above its competing quote (Listing 24.1).
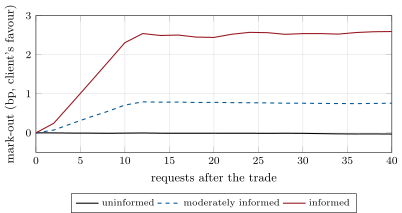
The desk quotes everyone 1.2 basis points for the first 100 000 requests and learns from them. The mark-out, the mid’s move over the next 20 requests against the desk’s side, separates the three types (Figure 24.1): , 0.84 and 2.41 basis points on average. The hit ratio, the share of a client’s requests the desk wins, reveals its competing quote: 80%, 43% and 8%. Inferred from each client’s hit ratio, the competing quotes have a correlation of 0.998 with the true ones.
s2_flowmm.markout_curve.24.2 Client tiering
Definition 24.2 (Client tiering)
Client tiering is pricing each client, or group of clients, by what its trades cost the desk (its mark-out) and by how sensitive it is to price (its hit ratio against the desk’s quotes), rather than quoting everyone the same.
For each client the desk picks the half-spread that maximises its expected profit per request, the half-spread less the client’s mark-out, times the chance of winning the request at that price (Listing 24.2). Captive uninformed clients pay more, price-sensitive ones less, and informed clients are quoted out of the market. On the second 100 000 requests (P&L in $ millions):
| policy | trades | capture | marks | hedging | franchise P&L |
|---|---|---|---|---|---|
| flat 1.0 bp | 74 622 | 7.46 | 0.35 | 5.90 | |
| flat 1.2 bp | 64 307 | 7.72 | 0.31 | 6.57 | |
| flat 1.4 bp | 53 310 | 7.46 | 0.25 | 6.63 | |
| flat 1.6 bp | 42 399 | 6.78 | 0.20 | 6.23 | |
| priced by client | 62 147 | 8.53 | 0.28 | 7.60 | |
| priced by client, axe skew 0.05 | 61 519 | 8.35 | 0.10 | 7.63 |
No flat price does as well. A low one wins the informed clients’ trades and loses on them; a high one loses the captive clients’ business along with the informed. By type, from the flat 1.2 basis points to prices by client:
| per trade (bp) | trades | capture | mark-out | net |
|---|---|---|---|---|
| uninformed, flat | 53 500 | 1.20 | 0.00 | 1.20 |
| uninformed, priced | 53 600 | 1.39 | 0.00 | 1.40 |
| moderate, flat | 9 869 | 1.20 | 0.83 | 0.37 |
| moderate, priced | 8 537 | 1.25 | 0.82 | 0.44 |
| informed, flat | 938 | 1.20 | 2.38 | |
| informed, priced | 10 |
Oomen showed that price signatures, the average price path around executions, can tell internalising liquidity providers from externalising ones; the same curves, computed by client, are what a desk tiers on. Tiering has a mirror image: a client’s execution quality depends on how its dealers manage risk. Oomen’s study of last look, the dealer’s option to reject a deal request after seeing where the price has gone, found that the design of that option determines the client’s execution risk but need not change its effective costs.
24.3 Axes and skewing
Definition 24.3 (Axe-driven skew)
An axe-driven skew is a shift of both sides of a dealer’s quote against its inventory or its axes, so that clients are offered better prices on the trades that reduce the desk’s position and worse ones on those that add to it.
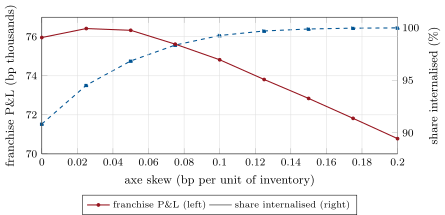
The desk skews its quotes by 0.05 basis points per unit of inventory: long five units, it sells 0.25 basis points cheaper and buys 0.25 basis points cheaper too. Clients then trade more in the direction that reduces the position, and the desk hedges less. The skew costs capture and saves hedging and risk (Figure 24.2): at 0.05 the franchise P&L is slightly higher, $7.63 million, and the average inventory falls from 2.75 to 2.18 units; at 0.2 the desk never hedges, holds 1.30 units on average and earns $7.08 million.
s2_flowmm.policy.24.4 Internalisation
A desk internalises a client’s trade when it keeps the risk until another client’s trade offsets it, and externalises it when it hedges in the market. The synthetic desk holds up to five units and hedges beyond them at the market’s half-spread of 0.5 basis points. Priced by client without a skew, it internalises 90.8% of its volume; with the 0.05 skew, 96.8%. Butz and Oomen modelled internalisation as a queue and found that its costs are lower for dealers willing to hold more risk and for those whose clients are more price-sensitive. They concluded that a client’s costs depend on the dealer’s risk management as well as its own trading, and that clients should tell externalisers from passive and aggressive internalisers.
24.5 Strategy files
Strategy file 24.1 — Tiered pricing by client mark-out
Who pays you, and why. Clients who value the relationship, convenience or credit over the last basis point.
Instruments and venues. Requests for quote and streaming prices to clients, by platform or voice.
Signal. Each client’s mark-out curve and hit ratio.
Sizing and execution. Half-spread by client that maximises expected profit per request.
Costs. Adverse selection; lost business from over-pricing.
How it dies. Clients who change behaviour; competitors who tier better.
Horizon, capacity, infrastructure. Continuous; client analytics and pricing engines.
Backtest honestly. Mark-outs on trades won only; the win curve estimated from varied quotes, not assumed.
Sources. Oomen (2019); this chapter: $7.60 million against $6.63 million at the best flat price.
Strategy file 24.2 — Axe skewing
Who pays you, and why. Clients on the other side of the desk’s position, who get a better price.
Instruments and venues. The desk’s quotes; axes shown to clients.
Signal. Inventory and axes.
Sizing and execution. A skew per unit of inventory, set against capture lost and hedging saved.
Costs. Capture given up.
How it dies. Clients who read the skew and trade against it.
Horizon, capacity, infrastructure. Continuous.
Backtest honestly. Clients’ response to the skew estimated, not assumed.
Sources. This chapter: internalisation from 90.8% to 96.8% at 0.05.
Strategy file 24.3 — Internalisation before hedging
Who pays you, and why. The market’s spread not paid on offsetting flows.
Instruments and venues. The desk’s own inventory; the market to hedge the residual.
Signal. Expected offsetting flow against the risk of waiting.
Sizing and execution. A risk limit beyond which the desk hedges.
Costs. Inventory risk; information leaked by hedging.
How it dies. One-way markets.
Horizon, capacity, infrastructure. Minutes to hours; a central risk book.
Backtest honestly. Inventory marks over the internalisation horizon.
Sources. Butz and Oomen (2019).
Strategy file 24.4 — RFQ win-rate management
Who pays you, and why. Clients whose business is worth winning at a price.
Instruments and venues. Multi-dealer request-for-quote platforms.
Signal. Hit ratios by client, size and time against quoted spreads.
Sizing and execution. Target win rates by client segment.
Costs. Winner’s curse on informed requests.
How it dies. Chasing volume at negative mark-out.
Horizon, capacity, infrastructure. Continuous; platform analytics.
Backtest honestly. Lost requests’ outcomes are unobserved; do not assume them.
Sources. No performance figure verified; this chapter’s hit ratios: 80%, 43% and 8%.
24.6 Tutorial: pricing the client
Goal. Simulate a desk facing clients with different information and competition, learn their mark-outs and hit ratios, price them, skew to the inventory and decompose the franchise P&L. End state: the three tables and three figures.
The desk.
def run_desk(flow: dict, cfg: FlowConfig | None = None, half_spread=1.0, skew: float = 0.0, start: int = 0,
             end: int | None = None) -> dict:
    """Quote each request at mid +/- (half_spread - skew x inventory x side); the client takes it with probability
    1 / (1 + exp((paid - compete) / width)). The desk's inventory moves against the client's side; beyond the limit
    it hedges back to the limit. P&L parts (bp): capture (the half-spread paid), marks (inventory x mid change),
    hedging (cost per unit hedged)."""
    cfg = cfg or FlowConfig()
    end = end or cfg.requests
    client, side, mid, u = flow["client"], flow["side"], flow["mid"], flow["u"]
    hs = np.broadcast_to(np.asarray(half_spread, float), (len(flow["types"]),))
    comp = flow["compete"]
    inv, capture, marks, hedged, hedge_cost, absinv = 0.0, 0.0, 0.0, 0.0, 0.0, 0.0
    filled = np.zeros(end - start, bool)
    paid_all = np.zeros(end - start)
    for i, t in enumerate(range(start, end)):
        c, s = client[t], side[t]
        paid = hs[c] - skew * inv * s
        if u[t] < 1 / (1 + math.exp((paid - comp[c]) / cfg.width)):
            filled[i], paid_all[i] = True, paid
            capture += paid
            inv -= s
            if abs(inv) > cfg.limit:
                h = abs(inv) - cfg.limit
                hedged += h
                hedge_cost += cfg.hedge_cost * h
                inv = math.copysign(cfg.limit, inv)
        marks += inv * (mid[t + 1] - mid[t])
        absinv += abs(inv)
    volume = filled.sum()
    return {"filled": filled, "paid": paid_all, "start": start, "volume": int(volume), "capture": capture,
            "marks": marks, "hedge_cost": hedge_cost, "net": capture + marks - hedge_cost,
            "internalised": 1 - hedged / volume if volume else 0.0, "abs_inventory": absinv / (end - start)}
Listing 24.1. Quote, fill, internalise, hedge beyond the limit, decompose. code/firm/flowmm/firm_flowmm.py Learning and pricing the clients.
def client_markouts(res: dict, flow: dict, cfg: FlowConfig | None = None, horizon: int = 20) -> np.ndarray:
    """Mean mark-out per filled trade by client: the mid's move over `horizon` requests against the desk's side."""
    cfg = cfg or FlowConfig()
    t = res["start"] + np.flatnonzero(res["filled"])
    t = t[t + horizon < len(flow["mid"])]
    m = flow["side"][t] * (flow["mid"][t + horizon] - flow["mid"][t])            # the client's gain = the desk's loss
    k = flow["client"][t]
    out = np.full(len(flow["types"]), np.nan)
    for c in range(len(out)):
        if (k == c).any():
            out[c] = m[k == c].mean()
    return out


def client_hits(res: dict, flow: dict) -> np.ndarray:
    """Each client's hit ratio: the share of its requests the desk filled."""
    k = flow["client"][res["start"]:res["start"] + len(res["filled"])]
    n = np.bincount(k, minlength=len(flow["types"]))
    return np.bincount(k, weights=res["filled"], minlength=len(flow["types"])) / np.maximum(n, 1)


GRID = np.arange(0.5, 5.01, 0.05)


def price_clients(markouts: np.ndarray, hits: np.ndarray, quoted: float, cfg: FlowConfig | None = None,
                  grid=GRID) -> np.ndarray:
    """Half-spread by client that maximises (h - mark-out) x win probability, with the client's competing level
    inferred from its hit ratio at the flat quote: c = quoted + width x logit(hit)."""
    cfg = cfg or FlowConfig()
    m = np.nan_to_num(markouts, nan=float(np.nanmean(markouts)))
    p = np.clip(hits, 0.01, 0.99)
    c = quoted + cfg.width * np.log(p / (1 - p))
    win = 1 / (1 + np.exp((grid[None, :] - c[:, None]) / cfg.width))
    return grid[np.argmax((grid[None, :] - m[:, None]) * win, axis=1)]
Listing 24.2. Mark-outs, hit ratios and the price that maximises expected profit. code/firm/flowmm/firm_flowmm.py - Run
estimates(),policy(),by_type()andfig_flowmm.py.
What to change next. Let clients change type halfway; estimate the win curve from randomised quotes instead of assuming its shape; add last look.
24.7 Build: flow market making
Purpose. A request-for-quote desk with client mark-outs, pricing by client, axe skewing and internalisation, with its P&L decomposed.
Interface. FlowConfig(…), simulate_flow(cfg), run_desk(flow, cfg, half_spread, skew, start, end), client_markouts, client_hits, price_clients.
Rules. The mid path does not depend on the desk; the client’s choice is logistic in the price paid; hedging only beyond the limit.
Acceptance tests. code/firm/flowmm/tests/: the decomposition adds up and wider quotes fill less; mark-outs rank the types; pricing by hand; inventory within the limit.
Stretch. Last look; streaming prices; several products with correlated inventory.
Sources and further reading
- M. Butz and R. Oomen, “Internalisation by electronic FX spot dealers”, Quantitative Finance 19(1), 2019.
- R. Oomen, “Last look”, Quantitative Finance 17(7), 2017.
- R. Oomen, “Price signatures”, Quantitative Finance 19(5), 2019.
24.8 Exercises
Exercise 24.1 ★
A client pays 1.2 basis points on $1 million and its trades mark out at 0.83. What does the desk earn per trade, in dollars?
Solution
Solution of Exercise 24.1.
per trade, before hedging costs.
Exercise 24.2 ★
The desk is long 4 units with a skew of 0.05 basis points per unit and a half-spread of 1.2. What does a buying client pay, and a selling one?
Solution
Solution of Exercise 24.2.
The skew is basis points against the long position: a buying client, who reduces it, pays ; a selling client, who adds to it, pays .
Exercise 24.3 ★
A client’s hit ratio at 1.2 basis points is 80% and the choice has a width of 0.25. What competing quote does it imply?
Solution
Solution of Exercise 24.3.
From : basis points.
Exercise 24.4 ★★
Why does no flat price match pricing by client?
Solution
Solution of Exercise 24.4.
A single price must serve clients with different mark-outs and different competing quotes. A low price wins the informed clients, whose trades lose money; a high one loses captive clients’ volume along with the informed. Pricing by client charges captive clients what they will pay and prices informed clients out, which no single number can do.
Exercise 24.5 ★★
Why does a small skew raise the franchise P&L while a large one lowers it?
Solution
Solution of Exercise 24.5.
A small skew costs little capture and saves hedging and inventory marks: clients trade more in the direction that reduces the position. A large skew gives away capture on many trades to save hedging costs that are already nearly zero: $7.63 million at 0.05, $7.08 million at 0.2.
Exercise 24.6 ★★
Why are internalisation costs lower for dealers whose clients are more price-sensitive?
Solution
Solution of Exercise 24.6.
A dealer can skew its prices to attract offsetting flow; price-sensitive clients respond to the skew, so the position is offset sooner and at a smaller concession, as Butz and Oomen found.
Exercise 24.7 ★★★
Coding. Run policy with a flat half-spread of 0.8 basis points. What happens to trades, marks and the franchise P&L?
Solution
Solution of Exercise 24.7.
Trades rise to 83 027, marks fall to million and the franchise P&L to $4.60 million. The informed clients now trade 3 259 times at a net basis points each, and even the moderate ones lose the desk money ().
Exercise 24.8 ★★★
Find the flaw. “Our informed clients generate most of our volume growth; we should tighten their spreads to win more of it.”
Solution
Solution of Exercise 24.8.
Volume from informed clients is the desk’s loss: on the flat price their trades netted basis points each, and tighter prices would win more of them. Their mark-outs, not their volume, should set their prices, and the franchise P&L, not volume, measures the desk.
24.9 Problem: Pricing the Client
Problem 24.1
Weekend problem — flow market making
The chapter’s synthetic desk and the public record.
Part I — The franchise.
- Define the franchise P&L and its parts.
- Describe the clients and why the mid path does not depend on the desk.
- What do the mark-outs and hit ratios show after the flat history?
- What did Oomen’s price signatures show?
Part II — Tiering.
- Define client tiering.
- How is each client priced?
- Give the policy table.
- Give the capture and net per trade by type.
Part III — Skews and internalisation.
- Define an axe-driven skew.
- What does the skew do to P&L, inventory and internalisation?
- What did Butz and Oomen find?
- What is last look, and what did Oomen find?
Part IV — The verdict.
- State the named result: the desk’s spread capture by tier and the share of risk internalised.
- Which assumption flatters pricing by client most?
- Why does a low flat price lose?
- How would you estimate a client’s win curve honestly?
- What would you do with a client whose mark-out rises?
- Which strategy file carries the most inventory risk?
- How does this chapter relate to chapter 15’s flow strategies?
- In one sentence: what does a flow desk sell?
Solution
Solution of Problem 24.1.
- The profit from serving clients: spread capture, inventory marks (where adverse selection shows) and hedging costs.
- 60 uninformed, 20 moderately informed (0.8 basis point drift) and 10 informed (2.5) clients, each with its own competing quote; the drift follows the client’s trade whoever fills it, so the mid path is common to all policies.
- Mark-outs of , 0.84 and 2.41 basis points and hit ratios of 80%, 43% and 8%; the inferred competing quotes correlate 0.998 with the true ones.
- Price signatures, the average price path around executions, tell internalising liquidity providers from externalising ones.
- Pricing each client by its mark-out and its sensitivity to price.
- The half-spread that maximises (half-spread less mark-out) times the win probability, with the competing quote inferred from the hit ratio.
- Flat 1.0, 1.2, 1.4, 1.6: $5.90, 6.57, 6.63, 6.23 million; priced by client $7.60 million, with the skew $7.63 million.
- Uninformed: capture 1.20 to 1.39, net 1.20 to 1.40 basis points; moderate: 1.20 to 1.25, net 0.37 to 0.44; informed: 938 trades at to 10 trades.
- A shift of the quote against the inventory or axes, to attract trades that reduce the position.
- At 0.05: P&L $7.63 million, average inventory 2.18 units instead of 2.75, internalisation 96.8% instead of 90.8%; at 0.2: $7.08 million, 1.30 units, all internalised.
- Internalisation horizons of several minutes in liquid currencies and tens of minutes in emerging markets for a representative large dealer; lower costs for dealers holding more risk and facing price-sensitive clients.
- The dealer’s option to reject or re-price a deal request after latency; its design sets the client’s execution risk but need not change its effective costs.
- Priced by client, the desk captures 1.39 basis points per trade from uninformed clients and 1.25 from moderately informed ones, prices the informed out, and internalises 90.8% of its volume, 96.8% with a 0.05 skew.
- That the win curve’s shape is known (logistic with a known width): the desk inferred competing quotes almost exactly.
- It wins the informed clients’ trades and loses on each.
- Vary quotes deliberately (small randomised offsets) and fit hit ratios against them, by client segment and size.
- Re-price it: widen its spread or reduce its size, and check whether its behaviour changed or its mark-out estimate was noisy.
- Internalisation before hedging, which holds the risk while waiting for offsetting flow.
- Chapter 15 trades against predictable flows from outside; this chapter is the desk that receives flows and prices them.
- Immediacy, priced to each client’s information and alternatives.
24.10 Interview questions
Interview question 24.1 ★ trader
What is a mark-out, and how would you use it to price a client?
Solution
Solution of Interview question 24.1.
The mid’s move after a trade, measured in the client’s favour, over one or several horizons. Averaged over a client’s trades it is what the desk loses to that client’s information; add it to the target margin to set the client’s spread.
Interview question 24.2 ★★ researcher
You see only the requests you won. How do you estimate a client’s sensitivity to your price?
Solution
Solution of Interview question 24.2.
Use all requests, won and lost: the hit ratio against the price quoted. Randomise quotes slightly so the curve is identified, fit a model of the win probability by client segment, size and market conditions, and correct for the fact that quotes were set with information about the client.
Interview question 24.3 ★★ trader
You are long a large position and a client asks for a two-way price. What do you quote?
Solution
Solution of Interview question 24.3.
A skewed two-way price: a tighter offer to sell down the position and a wider bid, sized to the client’s mark-out, the position and the cost of hedging; not a one-sided refusal, which damages the franchise.
Interview question 24.4 ★★ risk
How would you set the inventory limit of an internalising desk?
Solution
Solution of Interview question 24.4.
From the expected time to offsetting flow and the volatility over that time: the limit’s loss at a stress move must fit the desk’s risk budget; test it against one-way markets, when offsetting flow does not come.
Interview question 24.5 ★★ developer
Design the service that computes client mark-outs in real time for a pricing engine.
Solution
Solution of Interview question 24.5.
Subscribe to trades and to a reference mid; for each trade schedule mark-out computations at fixed horizons; aggregate by client with decaying weights; publish estimates with confidence to the pricing engine; keep the raw data for research and audit.
Interview question 24.6 ★★★ researcher
With a logistic win probability and a mark-out , show that the profit-maximising half-spread satisfies .
Solution
Solution of Interview question 24.6.
Maximise : , and for the logistic , so and . The margin over the mark-out rises as the win probability rises: captive clients pay more.