Strategies II: Volatility, Relative Value, Macro and the Bank Desks · Strategies
4Gamma Scalping and Event Volatility
Before earnings, a stock’s options price a move, and then the stock moves more or less than that. Gao, Xing and Zhang found that at-the-money straddles on individual stocks generally lose money, yet the same straddles bought three days before an earnings announcement and held to the announcement date earned a highly significant 3.34% on average. Owning a straddle and hedging it pays the difference between the move priced and the move delivered, less the cost of hedging. This chapter plants earnings gaps in synthetic stocks whose implied event variance is too low by a controlled amount. On them the event straddle earns 2.1% of its premium per event, which is a Sharpe ratio of about 1 for a book of 200 events a year. One event tells you almost nothing, though: the return’s standard deviation is 29% of the premium. The hedging frequency that does best after costs is once a day. The build is firm.eventvol.
4.1 Gamma scalping as a bet on realised against implied
A long option hedged in delta earns, over a short interval, about : gamma times the difference between the variance delivered and the variance the option was priced at (Book 5, chapter 25). Each hedge sells the stock after it has risen and buys it after it has fallen. The trades bank the path’s variance, and theta pays for the implied variance. The trade is a bet on realised against implied volatility, and the delta hedge is how the bet is collected.
The chapter’s synthetic stocks have a diffusive vol around 30%, and their implied variance carries a premium of 25% over it. Buying a 21-day at-the-money straddle and hedging it for 20 trading days, with no event, loses the premium, whatever the hedging:
| 2 000 straddles, no event | mean return (% of premium) | sd (%) | hedging cost (%) |
|---|---|---|---|
| never hedged | 62.4 | 0.0 | |
| daily | 15.3 | 0.7 | |
| twice a day | 11.5 | 1.0 | |
| every two hours | 8.5 | 1.5 | |
| hourly | 6.7 | 2.1 | |
| when delta moves 0.05 | 7.2 | 1.6 | |
| when delta moves 0.10 | 8.6 | 1.2 | |
| when delta moves 0.20 | 12.6 | 0.7 |
Hedging does not change what the trade expects to earn. That is set by implied against realised variance. What hedging changes is how noisily the trade earns it. Unhedged, the straddle is a directional bet with a standard deviation of 62% of its premium. Hedged hourly, the standard deviation is 6.7%, and 2.1% of the premium goes to the stock trades that hedge it. The hedges cost two basis points of the stock traded, an assumption of this chapter.
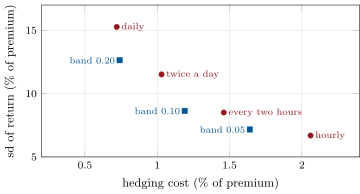
A band rule hedges only when the delta has moved by more than a threshold since the last hedge, so it trades when the path moves rather than when the clock strikes (Figure 4.1). At similar costs it gets a lower standard deviation than the clock: a band of 0.10 costs 1.2% for 8.6%, where hedging every two hours costs 1.5% for 8.5%.
s2_eventvol.hedging(False).4.2 Implied moves around events
An earnings announcement comes on a known day and adds a lump of variance on that day. An expiry after the event carries it; an expiry before does not. For an expiry after the event, with diffusive implied vol and event variance ,
so the event variance lifts short expiries’ vols more than long ones’, and two expiries after the event are enough to solve for both and . Dubinsky, Johannes, Kaeck and Seeger built reduced-form models and estimators on this idea to separate the uncertainty about earnings announcements from day-to-day volatility. The anticipated uncertainty was quantitatively large, varied over time and was informative about future volatility.
Definition 4.1 (Implied move)
The implied move of a scheduled event is the expected absolute return on the event day that option prices imply. Under a normal event return with the event variance extracted from the term structure it is . Traders often approximate it by the price of the at-the-money straddle expiring just after the event, as a share of the stock price.
On one of the chapter’s stocks, with a diffusive implied variance and an implied event variance of 0.00135, a 5-day expiry trades at 39.5% and a 21-day expiry at 32.3%. The two vols give the event variance back exactly (event_variance): an event standard deviation of 3.67%.
Definition 4.2 (Event straddle)
An event straddle is a long at-the-money straddle bought shortly before a scheduled event and sold soon after it, usually delta-hedged, which profits when the move delivered on the event exceeds the implied move by more than the time decay and costs of holding it.
The synthetic market plants the mispricing. Each event’s true move has a standard deviation around 5%, drawn event by event. The market prices an implied event variance equal to the true one times 0.70, times a lognormal error: the implied move is too low on average, and wrong by a different amount each time. Across the 2 000 events the average absolute gap was 4.35% and the average implied move 3.62%. The median implied move was 0.81 of the true one. The book buys the 21-day straddle at the close three days before the event, hedges it by a rule, and sells it at the event day’s close. Options cost 2% of the premium for the round trip, and hedges two basis points.
| 2 000 events | mean (%) | sd (%) | mean/sd | hedging cost (%) | 200 events a year |
|---|---|---|---|---|---|
| never hedged | 2.0 | 31 | 0.064 | 0.00 | 0.91 |
| daily | 2.1 | 29 | 0.073 | 0.06 | 1.04 |
| twice a day | 2.0 | 28 | 0.071 | 0.18 | 1.00 |
| every two hours | 1.8 | 27 | 0.064 | 0.23 | 0.91 |
| hourly | 1.7 | 27 | 0.063 | 0.30 | 0.89 |
| when delta moves 0.05 | 1.7 | 27 | 0.063 | 0.24 | 0.89 |
| when delta moves 0.10 | 2.0 | 28 | 0.070 | 0.18 | 1.00 |
| when delta moves 0.20 | 1.9 | 28 | 0.068 | 0.13 | 0.96 |
The last column scales the per-event ratio by , a book of fifty names with four reports each, and assumes the events are independent, which they are in this simulation and are not in a market. The gap arrives at the open, before anyone can hedge, so no hedging rule captures it. Hedging only trims the noise of the days around it. Daily hedging does best after costs: hedging more often cuts the standard deviation from 29% to 27% and costs more than it saves.
Planting the effect matters more than any rule. With the implied event variance right on average, the daily-hedged book loses 2.2% per event. Priced 15% too low, it loses 0.1%. Only at 30% too low does it earn its 2.1%. The straddle has to beat its own theta, the diffusive premium and its costs before the event pays anything.
4.3 The volatility crush after events
Definition 4.3 (Volatility crush)
The volatility crush is the fall in implied volatility after a scheduled event, when the event’s variance leaves the options’ remaining life; it is largest for the shortest expiries, whose vol the event had lifted most.
On the synthetic stocks the median 21-day implied vol was 36.6% when the straddle was bought and 32.0% after the event, a median fall of 8.6%. The straddle holder loses that vega on the event day whatever the stock does, so the gap must pay for it.
The same pattern shows on the index around scheduled Federal Reserve statements. On the 125 scheduled FOMC statement days from January 2011 to September 2026, the S&P 500’s mean absolute log return was 0.83%, against 0.71% on other days. Its mean squared return was 1.146 times larger, an extra event move with a standard deviation of about 0.41%. Cboe’s 9-day VIX fell on 65.6% of statement days, against 53.1% of other days, by 3.05% on average (log change), against a rise of 0.09% on other days. The 30-day VIX, which the statement lifts less, fell by 1.10% on average. A macro event is small next to an earnings report, and the crush it leaves in the shortest vol is still visible.
4.4 Hedging frequency and path
The implied move’s error decides each event (Figure 4.2). Sorted into fifths by the error, the log of the implied move over the true one, the daily-hedged straddle earned 8.0% of its premium when the implied move was 0.46 too low in logs. Where the implied move was about right (an error of 0.05), it lost 4.5%. The correlation between the error and the return, event by event, is only , because the move delivered is a single draw: a well-priced event can still gap three standard deviations.
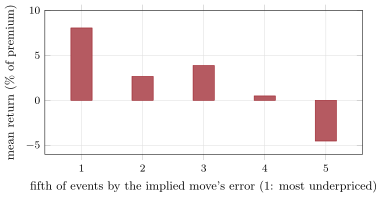
s2_eventvol.by_error.The path matters as well as the frequency. A clock rule hedges quiet days and busy days alike, while a band rule waits for the delta to move. Around an event the path has a structure: the diffusive days before, then the gap at the open. The gap cannot be hedged, so any rule that hedges the days before it is paying to trim variance it could have left alone. That is why the daily rule and the 0.10 band tie, and why hourly hedging loses 0.4% of the premium to the daily rule over three days.
4.5 Strategy files
Strategy file 4.1 — Earnings event straddle
Who pays you, and why. Option sellers who underestimate the uncertainty of an announcement, more so when a firm’s signals are noisy and its options costly to trade.
Instruments and venues. Listed single-stock options, at-the-money straddles with the first expiry after the report.
Signal. Implied move against a forecast of the move: past surprises, kurtosis, size, dispersion of analysts.
Sizing and execution. Many small positions across names and reporting seasons; bought a few days ahead, sold after the report.
Costs. Option spreads, widest where the effect is largest.
How it dies. Crowding that raises implied moves; costs that absorb the premium.
Horizon, capacity, infrastructure. Days per trade; an earnings calendar and option surfaces for hundreds of names.
Backtest honestly. Quoted spreads, not mid prices; announcement dates as known then; the crush in the exit price.
Sources. Gao, Xing and Zhang (2018): 3.34% on average from three days before to the announcement date; Dubinsky, Johannes, Kaeck and Seeger (2019); this chapter: 2.1% per event, about 1.0 for 200 events a year.
Strategy file 4.2 — Post-event volatility sale
Who pays you, and why. Holders of event options who sell after the event, and the diffusive variance premium that remains.
Instruments and venues. Single-stock or index options after the report or the statement.
Signal. Remaining implied vol against the forecast diffusive vol once the event is past.
Sizing and execution. Delta-hedged short straddles or variance, sized by a gap stress.
Costs. Option spreads; hedging.
How it dies. Follow-on news (guidance, restatements) that brings a second event.
Horizon, capacity, infrastructure. Days to weeks; surfaces updated after each event.
Backtest honestly. Exit and entry at quoted prices after the event, not at the close before.
Sources. No performance figure verified.
Strategy file 4.3 — Gamma scalping with hedge bands
Who pays you, and why. Option sellers who price vol below what the path delivers.
Instruments and venues. Long options on liquid underlyings; the stock or future for hedges.
Signal. Forecast realised against implied vol.
Sizing and execution. Delta bands set by cost against variance; hedging on moves, not on the clock.
Costs. Stock or futures trading at every hedge.
How it dies. Implied above realised on average (the variance premium): a long gamma book loses it.
Horizon, capacity, infrastructure. Days to weeks; a hedging engine with live deltas.
Backtest honestly. Intraday paths; hedging costs per trade.
Sources. This chapter: without an event, the long straddle loses 12% to 14% of its premium whatever the rule; hedging sets the noise.
Strategy file 4.4 — Macro-event variance
Who pays you, and why. Buyers of protection over central-bank decisions and data releases, and the crush afterwards.
Instruments and venues. Short-dated index options and weekly expiries around statement days.
Signal. The event variance in the short expiries against the index’s past moves on such days.
Sizing and execution. Small; sized by the largest past event-day moves.
Costs. Short-dated index option spreads.
How it dies. A surprise decision; an unscheduled meeting.
Horizon, capacity, infrastructure. Days; a calendar of scheduled events.
Backtest honestly. Scheduled dates as published then; unscheduled meetings excluded from the signal and kept in the risk.
Sources. Federal Reserve calendars and Cboe histories (this chapter: 125 statement days, VIX9D down 3.05% on average).
4.6 Tutorial: the move priced and the move delivered
Goal. Simulate event windows, price and hedge event straddles by several rules, and measure the crush and the FOMC-day statistics. End state: the two tables and the two figures.
The straddle and its hedges.
def straddle_pnl(w: dict, cfg: EventConfig | None = None, every: int = 0, band: float = 0.0) -> dict:
    """Long one at-the-money straddle per window, delta-hedged every `every` steps (0: never) or, if band > 0, whenever
    the position's delta has moved more than band since the last hedge; per unit of stock price at purchase."""
    cfg = cfg or EventConfig()
    S = w["S"]
    n, k = S.shape[0], S.shape[1] - 1
    dt = 1 / (YEAR * cfg.steps)
    tau0 = cfg.expiry / YEAR
    K = np.ones(n)
    v0 = _iv(w, cfg, 0, tau0)
    prem = bs_price(1.0, K, tau0, v0, "C") + bs_price(1.0, K, tau0, v0, "P")
    hedge = np.zeros(n)                                  # shares held short against the straddle's delta
    pnl_h, cost = np.zeros(n), np.zeros(n)
    for j in range(k):
        tau = tau0 - j * dt
        v = _iv(w, cfg, j, tau)
        d = bs_delta(S[:, j], K, tau, v, "C") + bs_delta(S[:, j], K, tau, v, "P")
        if band > 0:
            move = np.abs(d - hedge) > band
        else:
            move = np.full(n, every > 0 and j % every == 0)
        trade = np.where(move, d - hedge, 0.0)
        cost += cfg.hedge_cost * np.abs(trade) * S[:, j]
        hedge += trade
        pnl_h -= hedge * (S[:, j + 1] - S[:, j])
    tk = max(tau0 - k * dt, 1e-8)
    vk = _iv(w, cfg, k, tk)
    end = bs_price(S[:, k], K, tk, vk, "C") + bs_price(S[:, k], K, tk, vk, "P")
    opt_cost = cfg.option_cost * prem
    total = end - prem + pnl_h - cost - opt_cost
    return {"total": total, "premium": prem, "option": end - prem, "hedge": pnl_h, "hedge_cost": cost,
            "option_cost": opt_cost, "iv_before": v0, "iv_after": vk}
Listing 4.1. A long straddle per window, delta-hedged by clock or band, with costs. code/firm/eventvol/firm_eventvol.py The hedging rules.
@functools.lru_cache(maxsize=4)
def paths(event: bool = True, bias: float = -0.30):
    cfg = EventConfig(bias=bias)
    return cfg, windows(cfg, 3 if event else 20, event)


@functools.lru_cache(maxsize=8)
def hedging(event: bool = True, bias: float = -0.30):
    """Return on premium per window under each hedging rule: mean, sd, mean/sd, hedge cost, and a 200-a-year Sharpe."""
    cfg, w = paths(event, bias)
    out = {}
    for name, every, band in RULES:
        b = straddle_pnl(w, cfg, every, band)
        x = b["total"] / b["premium"]
        out[name] = {"mean": float(x.mean()), "sd": float(x.std(ddof=1)), "per_event": float(x.mean() / x.std(ddof=1)),
                     "hedge_cost": float((b["hedge_cost"] / b["premium"]).mean()),
                     "annual": float(x.mean() / x.std(ddof=1) * math.sqrt(EVENTS_A_YEAR))}
    return out
Listing 4.2. Each rule’s return, noise and cost. code/strategies-2/04-gamma-scalping-and-event-volatility/python/s2_eventvol.py - Run
s2_fetch_fomc.pyonce, thenhedging(),hedging(False),by_error(),crush()andfig_eventvol.py.
What to change next. Let the implied move’s error depend on something observable (past surprises) and trade only the fifth most likely underpriced; make events correlated across names in a season; add a gap at the open on non-event days.
4.7 Build: event volatility
Purpose. Event variance from the term structure, implied moves, event windows with gaps at the open, and discretely hedged straddles.
Interface. EventConfig(…), event_variance(v1, t1, v2, t2), implied_move(event_var), windows(cfg, days, event), straddle_pnl(w, cfg, every, band).
Rules. The gap happens at the event day’s open, between two hedges; the event variance leaves the implied vol after the gap; costs on every hedge and on the options.
Acceptance tests. code/firm/eventvol/tests/: the event variance recovered exactly from two expiries; the crush after every event and none without one; on a still path, only time decay and costs.
Stretch. Several events per window; jumps on non-event days; stochastic diffusive vol.
Sources and further reading
- A. Dubinsky, M. Johannes, A. Kaeck and N. J. Seeger, “Option pricing of earnings announcement risks”, Review of Financial Studies 32(2), 2019.
- C. Gao, Y. Xing and X. Zhang, “Anticipating uncertainty: straddles around earnings announcements”, Journal of Financial and Quantitative Analysis 53(6), 2018.
- Federal Reserve, FOMC meeting calendars, 2011–2026.
- Cboe Global Markets, daily histories of SPX, VIX and VIX9D.
4.8 Exercises
Exercise 4.1 ★
An event’s variance is 0.0025. What is its implied move?
Solution
Solution of Exercise 4.1.
.
Exercise 4.2 ★
A stock’s diffusive implied vol is 30% and an event adds variance 0.0025. What is the implied vol of an expiry 10 trading days away, after the event?
Solution
Solution of Exercise 4.2.
, so .
Exercise 4.3 ★
Why can no hedging rule capture an earnings gap?
Solution
Solution of Exercise 4.3.
The announcement comes outside market hours and the price gaps at the open: there is no trading between the last hedge before the report and the first price after it, so the whole move is taken at the delta held overnight.
Exercise 4.4 ★★
Gao, Xing and Zhang found that straddles generally lose but event straddles gain. Reconcile the two.
Solution
Solution of Exercise 4.4.
Most straddles pay the variance premium on diffusive days, which sellers are paid to bear. Around announcements, sellers underestimate the event’s uncertainty, more so for small, volatile, costly-to-trade firms; the event premium runs the other way for a few days.
Exercise 4.5 ★★
Why does a band rule get less noise for the same cost than a clock rule?
Solution
Solution of Exercise 4.5.
It hedges when the delta has moved, which is when the path has delivered variance worth banking, and not on quiet intervals when a hedge trades for little benefit.
Exercise 4.6 ★★
The S&P 500’s mean squared return on FOMC days is 1.146 times that of other days. Why is the macro-event trade small next to the earnings trade?
Solution
Solution of Exercise 4.6.
The extra event move is a standard deviation of about 0.41%, against an index’s daily moves of about 0.7%; an earnings gap on a stock is often several times its daily move. The event variance priced in short index options is small and the trade’s margin is correspondingly thin.
Exercise 4.7 ★★★
Coding. Run hedging(True, 0.0) and hedging(True, -0.15). How mispriced must the event be for the daily-hedged straddle to break even, and why is the answer not zero?
Solution
Solution of Exercise 4.7.
Right on average, the daily-hedged straddle loses 2.2% per event; 15% too low, 0.1%; 30% too low, it earns 2.1%. Break-even is a little beyond 15% too low. The answer is not zero because the straddle pays three days of theta at a vol that carries the diffusive premium, the round-trip option cost and the hedges before the event pays anything.
Exercise 4.8 ★★★
Find the flaw. “Our event straddles earn 2.1% per event with a Sharpe ratio of 1.04 a year, so we can size the book on that Sharpe ratio.”
Solution
Solution of Exercise 4.8.
The 1.04 assumes 200 independent events a year. Earnings seasons bunch reports in a few weeks and events share market and sector moves, so the effective number of independent bets is smaller and the Sharpe ratio lower; and one event’s standard deviation is 29% of the premium. Size on a stress of a bad season, not on the Sharpe ratio.
4.9 Problem: The Move Priced and the Move Delivered
Problem 4.1
Weekend problem — trading events
The chapter’s synthetic events, the FOMC record and the public research.
Part I — Gamma.
- Write the hedged option’s P&L over a short interval and explain it.
- Why does hedging not change what a long straddle expects to earn?
- What did the no-event straddle earn under each hedging rule?
- Define a band rule and compare it with a clock rule.
Part II — Events.
- How is the event variance extracted from the term structure?
- Define the implied move and the event straddle.
- What did Dubinsky and co-authors, and Gao, Xing and Zhang, find?
- How does the synthetic market misprice events?
Part III — The crush.
- Define the volatility crush and give its size on the synthetic stocks.
- What happens to the S&P 500 and to VIX9D on FOMC days?
- Why does the 30-day VIX fall less than the 9-day?
- What does the crush cost the straddle holder?
Part IV — The verdict.
- State the named result: the event straddle’s return per event against the implied move’s error, and the hedging frequency that maximises it after costs.
- Give the return by fifth of the implied move’s error.
- Why is the event-by-event correlation only ?
- How mispriced must events be for the trade to pay?
- What does the 200-events-a-year Sharpe ratio assume?
- How would you backtest an earnings straddle book honestly?
- Which strategy file is closest to the variance premium of chapter 1?
- In one sentence: what does an event straddle buy?
Solution
Solution of Problem 4.1.
- : gamma times the variance delivered less the variance paid for through theta.
- The expectation is set by implied against realised variance; hedging only changes how the path’s variance is collected, hence the noise.
- unhedged to hourly, with standard deviations from 62.4% down to 6.7% and hedging costs up to 2.1%.
- A band rule hedges when the delta has moved by more than a threshold; a clock rule at fixed times. Bands give less noise for the cost.
- Two expiries after the event: , two equations in and .
- The implied move is the expected absolute event return, ; the event straddle is bought before the event and sold after.
- The anticipated uncertainty is large, time-varying and informative (Dubinsky and co-authors); event straddles earned 3.34% on average from three days before to the announcement date (Gao, Xing and Zhang).
- Implied event variance is the true one times 0.70 times a lognormal error: the implied move is too low on average and wrong by a varying amount.
- The fall in implied vol once the event is past; a median 36.6% to 32.0%, 8.6%.
- Mean absolute return 0.83% against 0.71%; VIX9D fell on 65.6% of statement days, by 3.05% on average.
- The event’s variance is a smaller share of 30 days’ variance than of 9 days’.
- The vega lost on the event day, whatever the stock does.
- Named result. The event straddle earns 2.1% of its premium per event with a standard deviation of 29%, from in the fifth of events most underpriced to in the fifth priced about right; daily hedging maximises the return after costs (1.04 a year for 200 events).
- 8.0, 2.7, 3.9, 0.5 and from the most underpriced fifth to the least.
- The delivered move is one draw from its distribution.
- About 15% too low in variance just to break even; 30% for 2.1%.
- Independent events.
- Quoted option prices at entry and exit, announcement dates as known then, the crush in the exit, costs, seasons that bunch events.
- The post-event volatility sale.
- The chance that the event moves the stock more than the market expects.
4.10 Interview questions
Interview question 4.1 ★ trader
What is gamma scalping, and when does it make money?
Solution
Solution of Interview question 4.1.
Owning options and delta-hedging them, so that the hedges bank the path’s variance while theta pays for the implied variance; it makes money when realised volatility exceeds implied by more than the hedging costs.
Interview question 4.2 ★★ trader
A stock reports tomorrow. How do you read the implied move from the option chain?
Solution
Solution of Interview question 4.2.
From the at-the-money straddle expiring just after the report, as a share of the stock price; or, better, extract the event variance from two expiries after the report and take .
Interview question 4.3 ★★ researcher
How would you test whether earnings moves are underpriced?
Solution
Solution of Interview question 4.3.
Compare implied moves with realised event-day moves across many reports, controlling for size and volatility; trade event straddles at quoted prices with costs; check stability across years and firm types.
Interview question 4.4 ★★ risk
A book is short event straddles across 200 names in earnings season. What is its risk, and how would you stress it?
Solution
Solution of Interview question 4.4.
Gaps larger than implied on many names at once (a season of surprises), sector-wide moves, and correlated gaps; stress with the largest past seasons and a joint gap across a sector.
Interview question 4.5 ★★ developer
Design a delta-hedging engine with band rules. What must it know, and what can go wrong at the open?
Solution
Solution of Interview question 4.5.
Live positions and deltas, prices, costs and the band per book; at the open prices gap and the first quotes are wide, so a hedge on the first print can trade at a poor price; the engine needs rules for auctions and stale quotes.
Interview question 4.6 ★★★ researcher
Two expiries after an event, , have implied vols and . Derive the event variance and the diffusive vol, and say what goes wrong if an expiry falls before the event.
Solution
Solution of Interview question 4.6.
and . An expiry before the event carries no event variance, so the formula would treat its lower vol as diffusive and the extracted would be wrong.