Strategies II: Volatility, Relative Value, Macro and the Bank Desks · Strategies
6Zero-Day Options and Dealer-Gamma Flows
In 2025, S&P 500 options that expire the day they trade made up 59% of all SPX option volume, by Cboe’s count. The dealers who take the other side hedge within the day, and their hedging can push the index further or hold it back. Baltussen, Da, Lammers and Martens found that the return in the last 30 minutes before the close is predicted by the return over the rest of the day, in more than 60 futures markets over 1974 to 2020. They linked it to the gamma hedging of option market makers and leveraged funds. The trade that follows is easy to write: follow the day’s move when dealers are short gamma, fade it when they are long. The hard part is knowing which. This chapter simulates zero-day options whose customer side is drawn each day, estimates dealer gamma from open interest the way analysts do, and measures what that estimate costs. On the synthetic market the trade earns a Sharpe ratio of 1.68 when the dealers’ side is known and 0.40 when it is guessed. After costs, the guess loses. The build is firm.gammaflow.
6.1 Zero-day options and who trades them
A zero-day option (Book 1, chapter 26) is an option on its expiry day. Its gamma is concentrated near the strike and grows without bound as the close approaches. A move of a few points at 3:45 p.m. changes its delta far more than the same move at 10 a.m. Whoever is short these options holds a position whose hedge changes quickly and whose size depends on where the index is.
As of September 2026 — Zero-day option volume
Cboe reported that SPX zero-day options averaged a record 2.3 million contracts a day in 2025, 59% of all SPX option volume. In August 2025 their share reached a record 62.4%, about 2.4 million contracts a day, with retail traders an estimated 53% of that volume.
Who holds which side matters more than the volume. If customers buy the options, dealers are short gamma: they buy the index after it rises and sell after it falls, and their hedging adds to the move. If customers sell them, dealers are long gamma and lean against the move. Ni, Pearson, Poteshman and White found evidence of this channel in single stocks. Option market makers’ hedge rebalancing, with no information behind it, affected stock return volatility and the probability of large price moves.
6.2 Estimating dealer gamma
Open interest by strike is public. The side of each contract, and so who is long and who is short, is not. An analyst who wants dealer gamma must assume it.
Definition 6.1 (Gamma exposure estimate)
A gamma exposure estimate is the dealers’ total gamma computed from open interest by strike and an assumption about which side dealers hold, usually that they are long the calls customers sell and short the puts customers buy: under that convention.
Definition 6.2 (Gamma flip level)
The gamma flip level is the index level at which an estimate of the dealers’ total gamma changes sign: above it dealers are estimated long gamma, below it short.
firm.gammaflow simulates 2 000 days. The index opens at 100, and zero-day calls and puts are listed on 61 strikes every 0.1 from 97 to 103. Call open interest is centred above the open and put open interest below. Each is scaled by a daily random amount, with more on round strikes. Each day the customers’ net position in calls and in puts is drawn as a share of open interest between (short) and 1 (long). On average customers are short 0.2 of the calls and long 0.3 of the puts, with a standard deviation of 0.5 from day to day, and the dealers hold the opposite. The dealers’ options gain delta as the index moves. Dealers trade a tenth of that unhedged delta every five minutes and all that remains over the last 30 minutes, and each trade moves the next bar’s price (Listing 6.1).
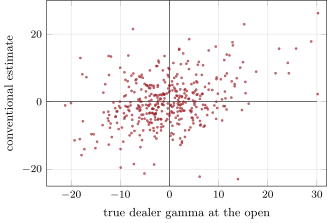
The truth has dealers short gamma at the open on 56.4% of days. The conventional estimate (dealers long every call, short every put) calls 51.5% of days short. It agrees with the truth’s sign on 56.0% of days, and its correlation with the true gamma is 0.23 (Figure 6.1). Knowing the customers’ average sides does barely better, 57.5% and 0.24, because what the estimate misses is the day’s own side, not the average. The conventional estimate finds a flip level between 97 and 103 on 96.0% of the first 200 days, with a median of 100.28. The truth has one on only 36.5% of them: on most days the dealers’ true gamma has the same sign across the whole range.
s2_gammaflow.days.6.3 Pinning and pushing
Definition 6.3 (Pinning)
Pinning is the tendency of an underlying to close near a strike with large open interest on the options’ expiry day, attributed to the hedging of dealers who are long gamma at that strike: they sell as the price rises through it and buy as it falls.
Pushing is the other regime: short-gamma dealers amplify moves. The simulation shows it clearly. On days when dealers were truly short gamma at the open, the day’s log return had a standard deviation of 1.48%. On long-gamma days it was 0.81%, against 0.99% for the same shocks without any hedging feedback.
Pinning is another matter. The share of closes within 0.05 of a round strike (a multiple of 0.5) is 21.4% on long-gamma days, 20.4% on short-gamma days and 21.4% without feedback. Chance alone gives 20%. The model damps moves when dealers are long gamma, but nothing in it pulls the price to a particular strike: dealers here hedge a share of their unhedged delta, which leans against the move wherever the index is. A pin needs gamma concentrated at one strike in the last minutes and hedging that tracks it closely. Before trading a pin, check that your model, or your market, produces one.
6.4 Trading the hedging flow
The trade follows Baltussen and co-authors: at 3:30 p.m. go long if the index is up since the open, short if it is down, and close at 4:00 p.m. Its return in basis points of the index, by the dealers’ gamma at the open, and a rule that follows the move on short-gamma days and fades it on long-gamma days:
| 2 000 days, bp a day | short gamma (t) | long gamma (t) | rule | Sharpe | after 1 bp |
|---|---|---|---|---|---|
| true side | 3.12 (3.0) | () | 3.24 | 1.68 | 1.16 |
| conventional estimate | 1.02 (1.0) | () | 0.78 | 0.40 | |
| average sides | 1.08 (1.3) | () | 1.28 | 0.66 | 0.14 |
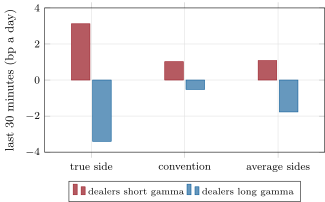
s2_gammaflow.regimes.With the true side the regime split is sharp (Figure 6.2): momentum on short-gamma days, reversal on long-gamma days, and a rule that uses both earns 3.24 basis points a day. The conventional estimate keeps a quarter of it, 0.78 basis points a day, a Sharpe ratio of 0.40 before costs and after one basis point a round trip. Without any regime, following the day’s move earns 0.27 basis points a day, a Sharpe ratio of 0.14. The mechanism is real in the simulation. Most of its value lies in information the public data do not contain.
6.5 Strategy files
Strategy file 6.1 — Long gamma below the flip level
Who pays you, and why. Nobody pays; the position is protection bought where dealer hedging is estimated to amplify moves.
Instruments and venues. Short-dated index options or futures options.
Signal. The index below an estimated flip level.
Sizing and execution. Small; the estimate’s sign is wrong on many days.
Costs. Option spreads; time decay when nothing happens.
How it dies. A flip level that is an artefact of the side convention: in the chapter’s simulation the convention finds one on 96% of days and the truth on 36.5%.
Horizon, capacity, infrastructure. Intraday to days; open interest by strike.
Backtest honestly. Use open interest as it was known before the session.
Sources. No performance figure verified.
Strategy file 6.2 — Pin trade near large strikes
Who pays you, and why. Buyers of expiring options near a strike where dealers are long gamma, if the index is held there.
Instruments and venues. Short straddles or butterflies at the strike with the largest open interest, late on expiry day.
Signal. Large open interest at a nearby strike and dealers estimated long gamma there.
Sizing and execution. Small; the loss if the index breaks away is fast and large.
Costs. Spreads on expiring options.
How it dies. No pin: in the chapter’s model closes land near round strikes as often as chance says.
Horizon, capacity, infrastructure. The last hour of expiry day.
Backtest honestly. Compare with the share of closes near a strike by chance.
Sources. No performance figure verified.
Strategy file 6.3 — Intraday dealer-hedging momentum
Who pays you, and why. Dealers and leveraged funds who must trade with the day’s move near the close to rebalance their hedges.
Instruments and venues. Index futures in the last 30 minutes.
Signal. The sign of the day’s return to 3:30 p.m., conditioned on estimated dealer gamma.
Sizing and execution. Enter at 3:30 p.m., exit at the close.
Costs. Two futures trades a day.
How it dies. A wrong estimate of the dealers’ side; crowding into the same close.
Horizon, capacity, infrastructure. Thirty minutes; intraday data.
Backtest honestly. Costs on every day; the regime estimate as it could have been made that morning.
Sources. Baltussen, Da, Lammers and Martens (2021); this chapter: 1.68 with the true side, 0.40 with the convention, after costs.
6.6 Tutorial: who is short gamma
Goal. Simulate zero-day options with random customer sides, estimate dealer gamma from open interest, and trade the hedging flow by regime. End state: the table and the two figures.
The days.
def simulate_days(cfg: FlowConfig | None = None) -> dict:
    cfg = cfg or FlowConfig()
    rng = np.random.default_rng(cfg.seed)
    D, B = cfg.days, cfg.bars
    amt = np.exp(cfg.oi_dispersion * rng.standard_normal((2, D, 1)))
    oi_c = amt[0] * open_interest(cfg, 100 + cfg.oi_shift)
    oi_p = amt[1] * open_interest(cfg, 100 - cfg.oi_shift)
    c_call = np.clip(rng.normal(cfg.call_side, cfg.side_sd, D), -1, 1)
    c_put = np.clip(rng.normal(cfg.put_side, cfg.side_sd, D), -1, 1)
    pos_c, pos_p = -c_call[:, None] * oi_c, -c_put[:, None] * oi_p      # dealers hold the opposite
    est_c, est_p = -cfg.conv_call * oi_c, -cfg.conv_put * oi_p
    dt = 6.5 / B / YEAR_HOURS
    eps = cfg.vol * math.sqrt(dt) * rng.standard_normal((D, B))
    S, S0 = np.full((D, B + 1), 100.0), np.full((D, B + 1), 100.0)
    unhedged, push = np.zeros(D), np.zeros(D)
    trades = np.zeros((D, B))
    for b in range(B):
        tau = (B - b) * dt
        S[:, b + 1] = S[:, b] * (1 + eps[:, b]) + push
        S0[:, b + 1] = S0[:, b] * (1 + eps[:, b])
        G = dealer_gamma(S[:, b], tau, pos_c, pos_p, cfg)
        unhedged += G * (S[:, b + 1] - S[:, b])                       # the options' delta drifts with the index
        frac = 1.0 / (B - b) if b >= B - cfg.close_bars else cfg.intraday_hedge
        trade = -frac * unhedged                                        # dealers trade to offset it
        unhedged += trade
        trades[:, b] = trade
        push = cfg.impact * trade                                      # and move the next bar
    tau0 = B * dt
    return {"S": S, "S_free": S0, "true_gamma": dealer_gamma(np.full(D, 100.0), tau0, pos_c, pos_p, cfg),
            "est_gamma": dealer_gamma(np.full(D, 100.0), tau0, est_c, est_p, cfg), "call_side": c_call,
            "put_side": c_put,
            "trades": trades, "pos_c": pos_c, "pos_p": pos_p}
Listing 6.1. Open interest, customer sides, dealer hedging with lags, and the estimate under the convention. code/firm/gammaflow/firm_gammaflow.py The trade by regime.
def trade():
    """Last-30-minute return times the sign of the day's move so far, in basis points, per day."""
    _, d = days()
    S = d["S"]
    return 1e4 * np.sign(S[:, LAST] / S[:, 0] - 1) * (S[:, -1] / S[:, LAST] - 1)


def regimes(cost: float = 1.0):
    """The momentum trade by regime (true and estimated), and the rule 'follow if short, fade if long', gross and net
    of a round-trip cost in basis points."""
    _, d = days()
    x = trade()
    out = {}
    for name, g in (("true", d["true_gamma"]), ("convention", d["est_gamma"]), ("average sides", d["avg_gamma"])):
        short, rule = g < 0, np.where(g < 0, x, -x)
        out[name] = {"short_mean": float(x[short].mean()), "short_t": float(x[short].mean() / x[short].std(ddof=1)
                                                                            * math.sqrt(short.sum())),
                     "long_mean": float(x[~short].mean()), "long_t": float(x[~short].mean() / x[~short].std(ddof=1)
                                                                           * math.sqrt((~short).sum())),
                     "rule_mean": float(rule.mean()), "rule_sr": float(rule.mean() / rule.std(ddof=1) * math.sqrt(252)),
                     "net_sr": float((rule.mean() - cost) / rule.std(ddof=1) * math.sqrt(252))}
    out["unconditional"] = {"mean": float(x.mean()), "sr": float(x.mean() / x.std(ddof=1) * math.sqrt(252))}
    return out
Listing 6.2. The last-30-minute trade, split by true and estimated regime. code/strategies-2/06-zero-day-options-and-dealer-gamma-flows/python/s2_gammaflow.py - Run
estimates(),regimes(),day_vol(),pinning(),flips()andfig_gammaflow.py.
What to change next. Let dealers hedge each option’s delta at every bar and see whether pinning appears; give the analyst a noisy signal of the day’s customer side and measure the trade as the signal improves; add leveraged funds’ close rebalancing.
6.7 Build: gamma flow
Purpose. Zero-day open interest by strike, customer sides, dealer gamma and its conventional estimate, flip levels, and an intraday simulator in which dealer hedging moves prices.
Interface. FlowConfig(…), strikes(cfg), open_interest(cfg, centre), gamma(S, K, tau, vol), dealer_gamma(S, tau, pos_c, pos_p, cfg), flip_level(pos_c, pos_p, cfg, tau), simulate_days(cfg).
Rules. Dealers hold the opposite of customers; hedge trades move the next bar; the estimate sees open interest only.
Acceptance tests. code/firm/gammaflow/tests/: gamma peaks at the strike and grows near expiry; no impact gives the free paths; a flip level between long calls and short puts.
Stretch. Per-option hedging; leveraged-fund flows; a noisy side signal.
Sources and further reading
- Cboe, trading volume reports and Cboe Insights on SPX zero-day options, 2025.
- G. Baltussen, Z. Da, S. Lammers and M. Martens, “Hedging demand and market intraday momentum”, Journal of Financial Economics 142(1), 2021.
- S. X. Ni, N. D. Pearson, A. M. Poteshman and J. White, “Does option trading have a pervasive impact on underlying stock prices?”, Review of Financial Studies 34(4), 2021.
6.8 Exercises
Exercise 6.1 ★
Dealers are short gamma of 5 index units per index point. The index rises 2 points. What do they trade to stay hedged?
Solution
Solution of Exercise 6.1.
Their options’ delta changes by index units; to stay hedged they buy 10 units, after the rise.
Exercise 6.2 ★
Why does a zero-day option’s gamma near the strike grow as the close approaches?
Solution
Solution of Exercise 6.2.
Gamma at the money is with : it grows like . With little time left, a small move decides whether the option ends in or out of the money, so its delta swings from near 0 to near 1.
Exercise 6.3 ★
Chance alone puts 20% of closes within 0.05 of a multiple of 0.5. Why?
Solution
Solution of Exercise 6.3.
Round strikes are 0.5 apart and the window is 0.05 on either side, 0.1 of every 0.5: for a close spread evenly over a range much wider than 0.5, the share is .
Exercise 6.4 ★★
Why does the conventional estimate find a flip level on almost every day?
Solution
Solution of Exercise 6.4.
The convention puts dealers long all calls, which sit above the open, and short all puts, which sit below: gamma is negative below the open and positive above by construction, so a sign change near the open is built into the assumption rather than found in the data.
Exercise 6.5 ★★
Knowing the customers’ average sides improves the estimate only a little. Why?
Solution
Solution of Exercise 6.5.
The average sides are the same every day; what decides a day’s dealer gamma is that day’s customer sides, which vary with a standard deviation of 0.5 around the average. Open interest carries no information about them.
Exercise 6.6 ★★
Why does the day’s volatility differ between short-gamma and long-gamma days, and what does Ni and co-authors’ result say about it?
Solution
Solution of Exercise 6.6.
Short-gamma dealers buy after rises and sell after falls, adding to moves (1.48% a day against 0.99% without feedback); long-gamma dealers lean against moves (0.81%). Ni and co-authors found this noninformational channel in single stocks: hedge rebalancing raised volatility and the probability of large moves.
Exercise 6.7 ★★★
Coding. Set FlowConfig(impact=0.0) and rerun the trade. What should it earn, and why?
Solution
Solution of Exercise 6.7.
Nothing: without impact the index is a random walk. The rule by true regime earns 0.03 basis points a day ( = 0.05). The unconditional trade shows with on these 2 000 days, a reminder that a of 2 appears by chance in a series whose true mean is zero.
Exercise 6.8 ★★★
Find the flaw. “Our gamma estimate says dealers are short today, so the last 30 minutes will follow the morning’s move.”
Solution
Solution of Exercise 6.8.
The estimate’s sign agrees with the truth on only 56% of days, and the trade conditioned on it earns 1.02 basis points on estimated short-gamma days ( = 1.0) against 3.12 on true ones. The statement treats an assumption about sides as a measurement.
6.9 Problem: Who Is Short Gamma
Problem 6.1
Weekend problem — trading dealers’ hedges
The chapter’s simulated days, Cboe’s figures and the public research.
Part I — The options.
- What is a zero-day option, and how does its gamma behave through the day?
- Give Cboe’s volume figures for 2025.
- How do short-gamma and long-gamma dealers hedge?
- What did Ni, Pearson, Poteshman and White find?
Part II — The estimate.
- Define a gamma exposure estimate and the flip level.
- What convention do analysts use, and what does it assume?
- How often does the estimate get the sign right, and how does it correlate with the truth?
- How often does each find a flip level?
Part III — The market.
- How do dealers hedge in the model, and how does their hedging move prices?
- Give the day’s volatility in each regime.
- Define pinning. Does the model pin?
- What would a model need to produce a pin?
Part IV — The verdict.
- State the named result: the error of the gamma estimate when the dealers’ side is guessed, and the hedging-flow trade’s return by regime.
- What did Baltussen and co-authors find?
- What does the trade earn without a regime?
- What survives costs?
- Where would better information about sides come from?
- How would you backtest the trade honestly?
- Which strategy file depends most on the flip level?
- In one sentence: what is the trade really betting on?
Solution
Solution of Problem 6.1.
- An option on its expiry day; its gamma near the strike grows like towards the close.
- 2.3 million contracts a day, 59% of SPX volume in 2025; a record 62.4% in August 2025.
- Short gamma: buy after rises, sell after falls; long gamma: the reverse.
- Market makers’ hedge rebalancing raises stock volatility and the probability of large moves, with no information behind it.
- Dealer gamma from open interest and an assumed side; the level where that estimate changes sign.
- Dealers long every call and short every put: customers sell calls and buy puts.
- On 56.0% of days, with a correlation of 0.23.
- The convention on 96.0% of the first 200 days, the truth on 36.5%.
- A tenth of the unhedged delta every five minutes, the rest in the last 30 minutes; each trade moves the next bar.
- 1.48% on short-gamma days, 0.81% on long-gamma days, 0.99% without feedback.
- A close drawn to a large strike by long-gamma hedging; no: 21.4% of closes near a round strike on long-gamma days, 20% by chance.
- Gamma concentrated at one strike late in the day and hedging that tracks each option’s delta closely.
- Named result. The conventional gamma estimate gets the sign wrong on 44% of days (correlation 0.23 with the truth); the last-30-minute trade earns 3.12 basis points a day on true short-gamma days and on long ones, a rule using the true side earns a Sharpe ratio of 1.68, and the same rule on the estimate 0.40 before costs and after.
- The last 30 minutes’ return is predicted by the rest of the day’s, in more than 60 futures markets, linked to gamma hedging.
- 0.27 basis points a day, a Sharpe ratio of 0.14.
- The rule with the true side (1.16 after costs); on the estimate, nothing.
- Trade-level data with initiator flags, dealer surveys, or exchange data on customer and market-maker volume.
- Open interest as known before the session, costs every day, the regime estimate made that morning.
- Long gamma below the flip level.
- On knowing which side of the options the dealers hold.
6.10 Interview questions
Interview question 6.1 ★ trader
What does it mean for dealers to be short gamma, and why would it matter for the index?
Solution
Solution of Interview question 6.1.
Their options lose delta as the index rises and gain it as it falls, so to stay hedged they buy after rises and sell after falls. Their trades add to the move, more so when zero-day gamma is large late in the day.
Interview question 6.2 ★★ researcher
How would you estimate dealer gamma, and how would you know whether the estimate is any good?
Solution
Solution of Interview question 6.2.
Sum open interest times gamma by strike under an assumption about sides. Test it against anything that reveals the truth: signed volume by participant type, the realised volatility and autocorrelation of intraday returns by estimated regime, and the stability of the estimate’s sign.
Interview question 6.3 ★★ trader
The index is near a strike with huge open interest an hour before expiry. What might happen, and how would you trade it?
Solution
Solution of Interview question 6.3.
If dealers are long gamma there, the index may be held near it; if short, a break away may accelerate. Trade small, with defined risk (butterflies rather than naked straddles), and only if the history shows pinning beyond chance.
Interview question 6.4 ★★ risk
A desk sells zero-day options every day. What is its risk, and how do you limit it?
Solution
Solution of Interview question 6.4.
Large gamma near the close: a move of a few points changes the hedge sharply and a gap cannot be hedged. Limit by strike concentration, by the loss on a move of several points in the last hour, and by hedging capacity near the close.
Interview question 6.5 ★★ developer
Design a system that computes a gamma exposure estimate every minute from open interest and quotes.
Solution
Solution of Interview question 6.5.
Open interest from the morning’s file, intraday volume by strike, live quotes for implied vols, a gamma per strike on a grid of index levels, the side assumption as a configuration, and alerts when the estimate’s sign or flip level moves; with checks on stale quotes.
Interview question 6.6 ★★★ researcher
Show that the gamma of an at-the-money option is , and find how it scales as .
Solution
Solution of Interview question 6.6.
At the money with zero rates, , and . As , , so : it grows like .