Research Craft: Predictors, Backtests, Measurement, Portfolios · Research
19Simulation Versus Live
The research replay of a quoting strategy, the level-3 simulation of chapter 18 run on the same hours the strategy then traded, said it would lose about $50 an hour. Live, it lost $491 an hour, and filled twice as many lots. Nothing was wrong with the replay’s code; its fills were reproduced in three languages. What went wrong is what every firm meets on its first live month: the simulator answered a slightly different question from the one the market asked. This chapter builds the reconciliation (firm.simlive): match the live fills to the simulated ones, walk the simulated P&L to the live one an assumption at a time, locate the fills the simulator could not produce, and decide what to change so that the next estimate is closer. The “live” market is a stand-in that can be rerun: firm.tape with the strategy trading inside it as an agent, its orders real orders that other traders see and trade against.
19.1 Reconciling fills
Definition 19.1 (Sim-to-live reconciliation, shadow trading)
Sim-to-live reconciliation is the systematic comparison of a strategy’s live orders, fills and P&L with what its simulator produces on the same market data and the same signals. Shadow trading runs the simulator in parallel with live trading, on the live feed, so that the comparison is available every day.
The chapter’s quoter keeps one lot on the best bid and one on the best ask within five lots of inventory. Live, inside firm.tape, it draws its own latencies (market data 0.02 seconds plus an exponential of mean 0.02; order entry 0.03 plus an exponential of mean 0.02) and pays 0.1 tick a share. Its orders are matched in time priority, count in the book that informed traders and liquidity providers react to, and are never cancelled by the background flow. The research estimate is the replay of chapter 18 (fifo queue model) on the same hour without the quoter: the same seed and the same efficient-price path, as a researcher would have run it the day before. Over six one-hour sessions the quoter filled 597 lots an hour live; the replay, on the live hour’s messages without the quoter’s own and with the live latencies, 305.
Definition 19.2 (Replay parity test)
A replay parity test replays a live session through the simulator, with the live orders’ decisions and timings, and measures the share of live fills the simulator reproduces (same side, price and time within a tolerance) and the share of simulated fills that happened live.
firm.simlive.match_fills pairs each live fill with a simulated fill of the same side and price within a second. Only 27% of the live lots have a simulated counterpart, and 54% of the simulated lots happened live. A parity this low says the simulator is not a noisy version of live; it is a different model of it.
19.2 Reconciling P&L
Definition 19.3 (Divergence decomposition)
A divergence decomposition walks the simulated P&L to the live P&L through a sequence of intermediate estimates, each changing one assumption to its live value, and attributes each step’s change to that assumption.
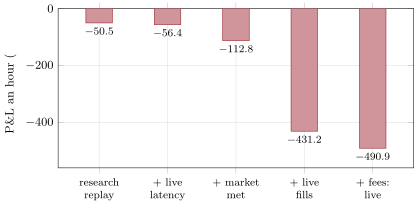
The order of the steps matters (changing latency first and the market second is not the same as the reverse), and each step must be a run of the simulator, not an estimate. The chapter’s sequence, averaged over the six sessions (Figure 19.1):
- the research replay: no latency, no fees, the hour without the quoter: an hour;
- with the live mean latencies: (latency: );
- on the market the quoter actually met, the live hour’s messages without its own: (the market: );
- the live fills themselves, before fees: (the fills: );
- live, after fees: (fees: ).
The market step compares two different realisations of the hour’s order flow, with and without the quoter, and part of it is chance. A second realisation of each hour without the quoter (the same efficient-price path, another order-flow seed) differs from the first by $62.8 an hour on average: the market step is within its chance. Latency and fees are small and known; the gap is in the fills.
rs_simlive.decomposition.19.3 Locating the divergence
Two mechanisms produce the live fills the replay cannot. They are visible only in the live messages, with the quoter’s own orders in them.
Trades that stopped at the quoter. An aggressive order that meets the quoter’s lot at the front of the queue is filled by it and may stop there. In the live messages without the quoter’s, that trade does not exist; a replay of them cannot fill the shadow with volume it never sees. 68% of the live lots came from aggressive orders that executed only against the quoter. The market after a firm trades is not the market without the firm.
The last order at a price. When the other orders at a price are cancelled as the price moves away, the quoter, whose cancellation is still travelling to the exchange, is left alone at a stale price, and the next aggressor takes it. In the replay the level simply empties, and nothing trades there. 21% of the live lots were filled with no other order resting at their price, and their mark-out after ten seconds was ticks, against for the other live fills: the worst fills of the day are the ones the simulator never shows.
19.4 Keeping the simulator honest
Definition 19.4 (Simulator calibration, implementation shortfall, arrival price)
Simulator calibration adjusts a simulator’s parameters (latency, queue model, fill probabilities) so that its output matches live outcomes. The implementation shortfall of an order (Perold, 1988) is the difference between the P&L of a paper portfolio traded in full at the decision time’s price and the P&L actually realised; the price at the decision time, or at the order’s arrival in the market, is its arrival price.
Calibration is the obvious response, and here it fails instructively. No latency makes the replay fill as many lots as live did: even at zero latency the replay on the live messages fills 1 898 lots over the six sessions against live’s 3 582. Switching to the front-of-queue model fills 8 886, more than live, with a P&L of against live’s . A simulator tuned to match the fill count would have tripled the error in P&L. The divergence is structural, and the fix is structural too: a reactive simulation, in which the strategy’s orders are part of the market (as the agent here, and as the exchange simulator of Book 10), for strategies whose orders are a noticeable share of the flow at their prices; and for the rest, a replay kept honest by the numbers this chapter produces every day.
The standing reconciliation is a report, produced daily from shadow trading: parity of fills (both shares), the decomposition’s steps, the mark-outs of live fills by group (matched, live only, alone at the price), and the implementation shortfall of every parent order against its arrival price, split into execution, opportunity and fees (firm.simlive.implementation_shortfall). A simulator that has not been reconciled with live is a hypothesis; one that is reconciled every day is an instrument.
rs_simlive.decomposition.19.5 Tutorial: ten times the simulated loss
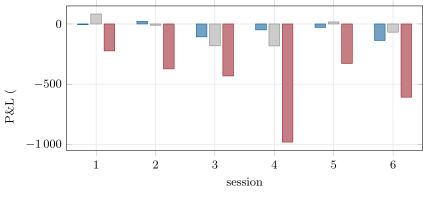
Goal. Trade the quoter live inside firm.tape, replay the same hours, and reconcile: parity, decomposition, the location of the divergence, and a calibration that fails. End state: Figures 19.1 and 19.2; the numbers of this chapter.
Match the fills: greedy, in time order, by side and price within a tolerance.
def match_fills(live, sim, tol: float = 1.0):
    """Greedy matching in time order: each live fill takes the earliest unmatched simulated quantity of the same side
    and price within `tol` seconds; partial quantities match partially."""
    live, sim = np.asarray(live, dtype=FILL), np.asarray(sim, dtype=FILL)
    left = sim["qty"].astype(float).copy()
    pairs, live_left = [], 0.0
    for i in np.argsort(live["t"], kind="stable"):
        need = float(live["qty"][i])
        cand = np.flatnonzero((sim["side"] == live["side"][i]) & (sim["price"] == live["price"][i])
                              & (np.abs(sim["t"] - live["t"][i]) <= tol) & (left > 0))
        for j in cand[np.argsort(sim["t"][cand], kind="stable")]:
            q = min(need, left[j])
            if q <= 0:
                continue
            pairs.append((int(i), int(j), q))
            left[j] -= q
            need -= q
            if need <= 0:
                break
        live_left += need
    return pairs, live_left, float(left.sum())
Listing 19.1. Matching live fills to simulated ones. code/firm/simlive/firm_simlive.py The agent: the quoter inside the market, with its own latencies.
class LiveQuoter:
    """The agent: one lot on the best bid and one on the best ask, within five lots of inventory."""

    def __init__(self, seed: int):
        self.rng = np.random.default_rng(seed + 500)
        self.cid, self.pos = 0, 0
        self.quote = {1: None, -1: None}

    def delay_data(self) -> float:
        return 0.02 + self.rng.exponential(0.02)

    def delay_entry(self) -> float:
        return 0.03 + self.rng.exponential(0.02)

    def on_market(self, t, top):
        _, bid, _, ask, _ = top
        acts = []
        for side, px in ((1, int(bid)), (-1, int(ask))):
            cur = self.quote[side]
            allowed = self.pos < MAX_LOTS * LOT if side > 0 else self.pos > -MAX_LOTS * LOT
            if cur is not None and (cur[1] != px or not allowed):
                acts.append(("cancel", cur[0]))
                self.quote[side] = cur = None
            if cur is None and allowed:
                self.cid += 1
                acts.append(("limit", self.cid, side, px, LOT))
                self.quote[side] = (self.cid, px)
        return acts

    def on_fill(self, t, cid, side, px, qty, passive):
        self.pos += side * qty
        for s in (1, -1):
            if self.quote[s] is not None and self.quote[s][0] == cid:
                self.quote[s] = None
        return []
Listing 19.2. The live quoter as a firm.tape agent. code/research/19-simulation-versus-live/python/rs_simlive.py - Run
decomposition(),steps(),vanished_volume(),alone_at_price(),effective_latency(),model_calibration()andfig_simlive.py.
What to change next. Make the quoter cancel as soon as the other orders at its price fall below a threshold, and watch the “alone” fills and the gap shrink; restore the executions against the quoter in the replay’s input as executions against an anonymous order, and measure the parity again.
19.6 Build: the reconciliation toolkit
Purpose. The daily comparison of every live strategy with its simulator, and the evidence for changing the simulator.
Interface. FILL, as_fills, match_fills(live, sim, tol), parity, fill_pnl(fills, mark), waterfall(steps), calibrate(grid, metric, target), implementation_shortfall(side, qty, decision_px, fills, end_px, fee_per_unit); firm.tape.simulate(cfg, agent) for the reactive stand-in.
Rules. Every step of a decomposition is a run, in a stated order; parity is reported both ways; calibration is judged on P&L and mark-outs, not on fill counts alone.
Acceptance tests. code/firm/simlive/tests/: matching with partial quantities and a tolerance; parity both ways, and perfect on identical fills; per-fill P&L summing to the marked total; the waterfall’s steps; calibration on a grid; the implementation shortfall of a buy and a sell by hand.
Stretch. Matching by order identifier with the exchange’s acknowledgements; decomposition by time of day; recalibration of a probabilistic queue model on live fills.
Sources and further reading
- A. F. Perold, “The implementation shortfall: paper versus reality”, Journal of Portfolio Management 14(3), 1988.
19.7 Exercises
Exercise 19.1 ★
Live fills: buy 100 at 50.00 at 10.2 s, sell 100 at 50.02 at 14.0 s. Simulated fills: buy 100 at 50.00 at 10.9 s, buy 100 at 49.99 at 12.0 s. With a one-second tolerance, what are the two parity shares?
Solution
Solution of Exercise 19.1.
The live buy at 50.00 (10.2 s) matches the simulated buy at 50.00 (10.9 s); the live sell has no simulated counterpart and the simulated buy at 49.99 no live one. 100 of 200 live shares matched and 100 of 200 simulated: both shares are 50%.
Exercise 19.2 ★
A decision to buy 10 000 shares is taken at 20.00. 6 000 fill at an average of 20.04 and the rest is cancelled; the price ends at 20.30. Fees are 0.2 cents a share. Compute the implementation shortfall and its three parts.
Solution
Solution of Exercise 19.2.
Execution: . Opportunity: . Fees: . Shortfall: $1 452, most of it the shares not bought.
Exercise 19.3 ★
Why must each step of a divergence decomposition be a run of the simulator rather than an estimate?
Solution
Solution of Exercise 19.3.
Assumptions interact: the effect of latency depends on the queue model and on the market, so an estimate of one step with the others held at research values misattributes. A run changes exactly one input and keeps the simulator’s own consistency, so the steps add up to the whole gap.
Exercise 19.4 ★★
Why can the market step of the decomposition be within chance even when the strategy’s impact is real? How would you separate the two?
Solution
Solution of Exercise 19.4.
The market step compares two realisations of the hour’s order flow, with and without the strategy; they differ by the strategy’s impact and by chance. Estimate the chance part from realisations without the strategy (another order-flow seed with the same efficient price: $62.8 an hour here), and the impact from many sessions or from a controlled experiment (trading on randomly chosen days, chapter 21).
Exercise 19.5 ★★
Explain why a replay of the live session without the strategy’s own messages undercounts its fills, and what share of the chapter’s live lots it cannot see.
Solution
Solution of Exercise 19.5.
Aggressive orders that met the strategy’s order and stopped there do not appear once the strategy’s messages are removed; a shadow order can be filled only by executions the replay contains. In the chapter’s sessions 68% of the live lots came from aggressive orders that executed only against the quoter.
Exercise 19.6 ★★
Why are fills that happen when the strategy is the last order at its price worse than the others?
Solution
Solution of Exercise 19.6.
The other orders at the price left because the price was leaving: stale-quote cancellations as the efficient price moved, as in the simulator’s mechanism. The order still resting is filled by traders who know the price has moved: on the synthetic sessions, a mark-out of ticks against .
Exercise 19.7 ★★★
Coding. With rs_simlive.effective_latency, confirm that no latency closes the fill gap. Which of the chapter’s two mechanisms would a latency change affect, and why not the other?
Solution
Solution of Exercise 19.7.
rs_simlive.effective_latency: the replay fills 1 898 lots at zero latency, fewer at every larger latency, against 3 582 live: no latency closes the gap. Latency affects when the quoter’s orders arrive and leave, so it bears on the fills where the quoter was left alone at a price; but in the replay that price level simply empties, and the trades that stopped at the quoter are absent from its input whatever the latency.
Exercise 19.8 ★★★
Find the flaw. “Live fills were double the simulator’s, so we switched the simulator to optimistic fills; now the fill counts match and the backtest is calibrated.”
Solution
Solution of Exercise 19.8.
Matching the count with the wrong fills: the optimistic model adds the benign fills a real order does not get, while live’s extra fills are the worst ones. On the chapter’s sessions, front-of-queue fills (8 886 lots) overshoot the live count (3 582) and turn a live loss of $2 587 into a simulated profit of $2 207. Calibrate on P&L and mark-outs by fill group, and fix the structural cause (a reactive simulation).
19.8 Problem: Ten Times the Simulated Loss
Problem 19.1
Weekend problem — a live strategy against its simulator
The chapter’s quoter, live inside firm.tape for six one-hour sessions, and its level-3 replays.
Part I — Fills.
- How many lots an hour did the quoter fill live, and how many did the replay fill on the live messages without its own?
- What are the two parity shares?
- What does a parity this low say about the simulator?
- Which live latencies did the quoter have, and what does the research replay assume?
Part II — P&L.
- Give the P&L an hour at each step of the decomposition.
- How large is each step?
- How much of the market step can chance explain?
- Which steps are known in advance, and which had to be measured?
Part III — The divergence.
- What share of the live lots came from aggressive orders that executed only against the quoter, and why can the replay not see them?
- What share of the live lots were filled with no other order at their price, and what were their mark-outs against the others’?
- Why does the quoter end up alone at a price?
- What would reduce those fills?
Part IV — The verdict.
- State the named result: the decomposition of the gap between live and simulated P&L into latency, the market, the fills and fees.
- What does calibrating latency achieve?
- What does switching to the front-of-queue model do to fills and P&L?
- What is the structural fix?
- What should the daily reconciliation report contain?
- How would you use the implementation shortfall for this strategy’s inventory unwinds?
- What changes if the strategy trades 1% of the volume at its prices instead of 10%?
- In one sentence: what makes a simulator an instrument rather than a hypothesis?
Solution
Solution of Problem 19.1.
- 597 lots an hour live; 305 in the replay.
- 27% of the live lots were matched; 54% of the simulated lots happened live.
- It is not a noisy copy of live but a different model: it produces different fills, not the same ones with errors.
- Market data 0.02 s plus an exponential of mean 0.02 s, order entry 0.03 s plus an exponential of mean 0.02 s; the research replay assumes none.
- , , , and an hour.
- Latency , the market , the fills , fees .
- All of it: a second realisation of the hour differs from the first by $62.8 an hour on average.
- Latency and fees are known in advance; the market and the fills had to be measured live.
- 68%: those trades exist only with the quoter’s order in the book; the replay’s input, the market without it, does not contain them.
- 21%, with a 10-second mark-out of ticks against for the other live fills.
- Its cancellation is in flight when the others leave the price, which they do because the price is moving away.
- Cancelling when the other orders at its price thin out, or quoting one tick behind the best when the queue is short.
- Named result. From the research replay’s an hour to live’s : latency , the market met (within chance), the live fills , fees . The gap is in the fills: 68% of live lots came from trades that stopped at the quoter and 21% were taken while it was alone at its price.
- Nothing: no latency makes the replay fill as many lots as live.
- It fills more lots than live (8 886 against 3 582 over the sessions) and shows a profit ($2 207 against a live loss of $2 587).
- A reactive simulation in which the strategy’s orders are part of the market, for strategies that are a noticeable share of the flow at their prices.
- Parity both ways, the decomposition’s steps, mark-outs by fill group, and the implementation shortfall of each parent order.
- Take each unwind’s decision price (when the inventory limit is hit) as the arrival price, and split its cost into execution, opportunity (the part not unwound) and fees.
- Fewer trades stop at it and fewer levels are left to it alone: the replay’s blind spots shrink, and the replay becomes a better estimate.
- Being reconciled with live every day, with the reconciliation’s numbers deciding what changes in it.
19.9 Interview questions
Interview question 19.1 ★ researcher, trader
Your strategy makes half in production what it made in simulation. Where do you look first?
Solution
Solution of Interview question 19.1.
Match fills first (parity both ways): missing or extra fills point to the fill model and latency; then decompose the P&L gap with runs (latency, market, fills, fees, costs); then look at the mark-outs of the unmatched fills. Check the simple things too: fees, borrow, corporate actions, clock alignment.
Interview question 19.2 ★★ researcher
What is implementation shortfall, and how do you decompose it?
Solution
Solution of Interview question 19.2.
The difference between the P&L of a paper portfolio traded in full at the decision prices and the P&L realised (Perold, 1988). Decompose it into delay (decision to arrival), execution cost of the filled part against the arrival price, opportunity cost of the unfilled part, and fees.
Interview question 19.3 ★★ developer, researcher
Describe a replay parity test and what it catches.
Solution
Solution of Interview question 19.3.
Replay a live session through the simulator with the live orders and their actual timings, and compare fills: the share of live fills reproduced and the share of simulated fills that happened. It catches bugs in the fill logic, clock misalignments, wrong latency assumptions and structural blind spots (like trades that only exist because of the strategy).
Interview question 19.4 ★★ researcher, trader
Why does a backtest on market data recorded while you were trading misstate your fills?
Solution
Solution of Interview question 19.4.
The recorded market contains the consequences of your orders: trades that stopped at your orders, other traders’ reactions. Removing your messages leaves a market that neither existed nor would have existed without you; keeping them double counts liquidity. In the chapter’s sessions 68% of the live lots came from trades absent from the market without the quoter.
Interview question 19.5 ★★ researcher
How would you calibrate a fill simulator on live fills without overfitting it?
Solution
Solution of Interview question 19.5.
Fit few parameters, with physical meaning (latency, a queue-model parameter), on one period and check on another; judge on P&L and mark-outs by fill group as well as counts; refuse parameters that match counts by adding the wrong fills; and prefer a structural change when the parity shows different fills rather than noisy ones.
Interview question 19.6 ★★★ researcher, developer
Design a daily sim-to-live reconciliation for a firm with fifty strategies.
Solution
Solution of Interview question 19.6.
Shadow-run every strategy’s simulator on the live feed; each night, for each strategy, compute parity, the decomposition’s steps, mark-outs by fill group and implementation shortfall; alert on drifts beyond each strategy’s own noise; store all of it with the simulator’s version, so that a change to the simulator can be checked against its history (chapter 29).