Research Craft: Predictors, Backtests, Measurement, Portfolios · Research
4Universe, Symbology and Corporate Actions
Before the market opened on 9 June 2022, the Class A shares of the company formerly called Facebook began trading on Nasdaq under a new ticker, META; the ticker FB, used since the listing in 2012, was retired. A research table keyed on tickers either loses ten years of history at that date or, if the old ticker is later given to someone else, splices two companies into one series. Tickers are not the only thing that moves: companies list and delist, split their shares, merge and spin off, and the set of stocks a strategy could have traded changes every month. This chapter builds the objects that keep all of this straight: a universe defined through time, a security master keyed by permanent identifiers, adjustments that do not leak the future, and delisting returns. Its data are a simulated market of about 1 500 listings over ten years, in which tickers change and are reused, shares split and companies fail or are bought.
4.1 A tradable universe through time
Definition 4.1 (Tradable universe, universe membership, liquidity filter)
A tradable universe is the set of securities a strategy may hold at a given date, defined by rules evaluated on data known at that date. Universe membership is the resulting table of (date, security) pairs. A liquidity filter is a membership rule on tradability: a minimum average daily traded value, a minimum price, a minimum free-float capitalisation, a rank by any of these.
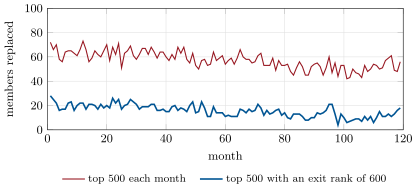
A universe is a research decision with consequences. It fixes which names the predictors are measured on (chapter 6), which the optimiser may buy (chapter 25) and how much capital the strategy can take (chapter 28). Two properties make it honest: its rules use only data known at each date, and it does not change more than the underlying liquidity does. The second is not automatic. A rule that takes the 500 names with the largest traded value each month replaces every name whose rank wanders across 500, although nothing about the name has changed; each replacement is a pair of trades the strategy then pays for.
Method 4.2 (A buffered membership rule)
At each rebalance date, rank the candidates by the liquidity measure known that day. A member keeps its place while its rank is within an exit rank wider than the target size (say 600 for a universe of 500); the free places go to the best-ranked non-members. Index providers use the same device (buffer rules, One Quant Book 1, chapter 15).
In the chapter’s simulated market, a universe of the 500 largest names by traded value replaces 11.5% of its members each month without a buffer and 3.1% with an exit rank of 600 (Figure 4.1). The buffered universe is not less liquid in any way that matters: its members are all within the top 600.
4.2 Identifiers that change
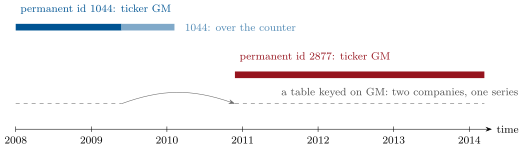
One Quant Book 1, chapter 28, made the rule: a ticker is not an identifier. Tickers are changed when a company renames itself, freed when it delists, and given to a new company later. The example is not rare. After General Motors Corporation filed for Chapter 11 on 1 June 2009, its shares traded over the counter (as MTLQQ by the end of that year) and the ticker GM was free; the new General Motors Company, which had bought most of the old company’s assets, listed on the New York Stock Exchange under GM in November 2010. A table keyed on GM holds two different companies, separated by a bankruptcy.
National identifiers are more stable but not permanent. A CUSIP is a 9-character code for US and Canadian securities, and an ISIN (ISO 6166) a 12-character code made of a two-letter country prefix, a national identifier and a check digit; both identify an issue, not a company, and belong to the external symbols a firm must map rather than trust. The Financial Instrument Global Identifier (FIGI) is designed not to change: once assigned it is never changed, and when the instrument ceases to exist the FIGI is retired and never reused.
Definition 4.3 (Permanent identifier, identifier mapping, ticker change)
A permanent identifier is an identifier assigned to a security when it enters the firm’s data and never changed or reused, whatever happens to its external symbols. An identifier mapping is the table that links each external symbol (ticker, CUSIP, ISIN, vendor code) to a permanent identifier over a date range. A ticker change ends one row of that mapping and starts another for the same permanent identifier.
4.3 The security master
Definition 4.4 (Security master)
A security master is the firm’s reference table of securities: for each permanent identifier, its issuer, its listing and delisting dates, its external identifiers over time, its corporate actions and its delisting reason and return; every other table refers to securities by permanent identifier only.
The security master answers, as of any date, three questions every research table asks: which security did this ticker mean on that date, what was this security’s ticker then, and what was listed. It is built from events, not from a snapshot: a listing creates an identifier, a rename ends a mapping and starts another, a delisting closes the security and records how it ended, and a split or a dividend becomes an adjustment factor (Book 1, chapter 8) attached to the identifier, with its announcement and ex-dates.
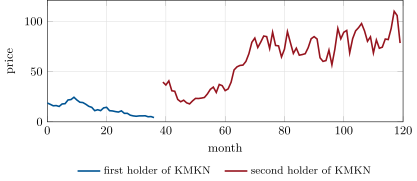
The simulated market shows what joining on tickers does. Over ten years it has 1 471 listings, of which 471 end: 113 for performance (a delisting return) and 358 in cash mergers (at a premium); 158 tickers are reused. A price file keyed on tickers therefore contains 164 returns that run from one company’s last price to another’s first, with an average absolute size of 164%. Ticker KMKN is an example (Figure 4.3): its first holder last traded at 4.23 before its delisting; three months later a new company listed under KMKN at 39.55. In the ticker file, KMKN “rose” 835% in three months.
4.4 Adjusting without leaking
Prices are adjusted so that splits and dividends do not look like returns: the adjusted series is the traded price divided by the product of the adjustment factors of all later actions (Book 1, chapter 8). The adjustment is exact for returns and wrong for levels, and the difference leaks.
Proposition 4.5 (What adjusted prices may and may not be used for)
Returns computed from an adjusted series are the total returns of holding the security. A level of the adjusted series at a past date, however, depends on the actions that happened after that date: a rule applied to it at date uses information from after .
Proof. Between two actions the adjustment divides all prices by the same constant, which cancels in a ratio; at an action’s ex-date the factor removes the mechanical price change. The level at is the traded price divided by the product of the factors of the actions after , which are not known at . ∎
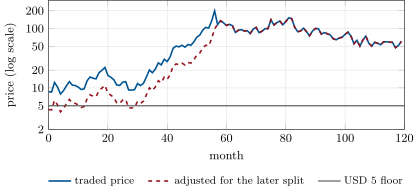
A price floor is the classic case. A research universe excludes stocks under USD 5, and the floor is applied to the adjusted prices of a vendor file. A stock that later splits two-for-one had, in the adjusted file, half its traded price: at 8.65 it traded comfortably above the floor, but its adjusted price, 4.32, sits below it (Figure 4.4). Why did it split? Because its price rose. The floor on adjusted prices therefore excludes, from the early universe, stocks selected for their future rise. In the simulated market it wrongly drops 0.3% of the name-months above the floor, and the stocks it drops return 71% over the next twelve months, against 15% for the universe. A strategy that looks good at buying low-priced stocks, or bad at it, may be measuring this leak.
The rule that follows is simple. Returns from adjusted prices; every rule on a level (a price floor, a capitalisation cut-off, a distance from a past high) on the price that traded that day, with the shares outstanding known that day.
4.5 Delistings and the delisting return
Definition 4.6 (Delisting return)
The delisting return of a security is the return from its last regular trading price to the value its holders actually received or could realise: the cash of a merger, the price of the shares on the market where they continued to trade, or what a bankruptcy left.
The delisting return is the last return of a security’s history, and it is the one most often missing. For a cash merger it is known and usually small (the price had converged to the deal). For a performance delisting it is large and negative: Shumway (1997) found the returns of NYSE and AMEX stocks delisted for performance reasons mostly missing from the standard US research database, and, recovering 71% of them from over-the-counter prices, an average of . A backtest that lets the position vanish at its last regular price has treated as zero, for exactly the positions that were losing. With a security master the rule is mechanical: every delisting has a reason and a return; if the return is not known, an estimate by reason is used and flagged, never zero.
4.6 Tutorial: a market with changing names
Goal. Simulate ten years of listings, build their security master and universes, and measure what tickers and adjusted prices do to a research table. End state: Figures 4.1, 4.3 and 4.4; 164 spliced returns; churn 11.5% and 3.1%; the dropped names’ 71% against 15%.
Resolve as of a date. A ticker belongs to one permanent identifier on a date; a listing has one ticker on a date, or none before its listing and after its delisting.
    def resolve(self, ticker: str, date):
        for span in self._by_ticker.get(ticker, []):
            if self._covers(span, date):
                return span[2]
        return None

    def ticker(self, pid: int, date):
        if pid not in self._start or date < self._start[pid]:
            return None
        if pid in self._end and date > self._end[pid][0]:
            return None
        rows = self._tick[pid]
        i = bisect.bisect_right([d for d, _ in rows], date) - 1
        return rows[i][1]

    def listed(self, date) -> set:
        return {p for p in self._start if self.ticker(p, date) is not None}
Listing 4.1. As-of resolution in both directions. code/firm/secmaster/firm_secmaster.py Universes. Rank by the traded value known each month; keep members within the exit rank; fill with the best non-members.
def buffered_universe(dates, scores, n: int, exit_rank: int | None = None) -> dict:
    """At each date, rank the names by score (liquidity known at that date, highest first). Members keep
    their place while their rank is at most exit_rank (n by default: no buffer); the free places go to the
    best-ranked non-members, so the universe has n names whenever n are available."""
    exit_rank = exit_rank or n
    out, members = {}, set()
    for d in dates:
        s = scores(d)
        ranked = sorted(s, key=lambda k: (-s[k], k))
        rank = {k: i + 1 for i, k in enumerate(ranked)}
        keep = {k for k in members if k in rank and rank[k] <= exit_rank}
        keep = set(sorted(keep, key=lambda k: rank[k])[:n])
        for k in ranked:
            if len(keep) >= n:
                break
            keep.add(k)
        out[d], members = keep, keep
    return out
Listing 4.2. A buffered membership rule. code/firm/secmaster/firm_secmaster.py - The two leaks. Build the ticker-keyed price file with
ticker_paneland count the returns that span two listings; apply the USD 5 floor to adjusted and to traded prices withprice_filter_leak.
What to change next. Set reuse_prob=0 and check that the spliced returns disappear; add a minimum history of twelve months to the universe rule and measure how many new listings it delays.
4.7 Build: the security master
Purpose. The miniature firm’s one reference table: every price, feature, position and trade in later chapters refers to a permanent identifier, and every symbol is resolved through here as of the date of use. The synthetic universe of chapter 5 and the backtesters of Part IV use it.
Interface. SecurityMaster().list(pid, ticker, date), rename(pid, ticker, date), delist(pid, date, reason, ret); resolve(ticker, date), ticker(pid, date), listed(date), spans(pid), delisting(pid), reused(); buffered_universe(dates, scores, n, exit_rank); churn(universe).
Rules. A permanent identifier is used once; a ticker is held by at most one listing on any date; a rename takes effect on its date (the old ticker is not held that day), a delisting on its date is the last day held; universes read only the scores of their date.
Acceptance tests. code/firm/secmaster/tests/: a ticker change resolved on both sides of its date; a reused ticker resolved to two listings, with the delisting recorded; a held ticker refused; a buffer cuts churn.
Stretch. Corporate actions attached to identifiers with announcement dates (wrapping Book 1’s firm.corpactions); several external identifier types with their own date ranges; mergers that map one listing into another (a stock merger).
Sources and further reading
- Meta Platforms, Inc., “Meta Platforms, Inc. to change ticker symbol to ‘META’ on June 9”, press release, 31 May 2022 (SEC filing, exhibit 99.1).
- General Motors Company, Form S-1/A registration statement, November 2010 (listing under “GM”; Motors Liquidation Company shares trading as MTLQQ).
- ISO TC 68, “What is ISIN?”; CUSIP Global Services, identifier descriptions; OpenFIGI, “About FIGI”.
- T. Shumway, “The delisting bias in CRSP data”, Journal of Finance 52(1), 1997.
4.8 Exercises
Exercise 4.1 ★
A stock trades at USD 12 and splits three-for-one a year later. What is its adjusted price today for that date, and does a USD 5 floor on adjusted prices include it?
Solution
Solution of Exercise 4.1.
: the adjusted price is USD 4, so a floor on adjusted prices excludes a stock that traded at USD 12, because it later split (after rising).
Exercise 4.2 ★
A table keyed on tickers holds a company that was delisted at USD 0.80 and, two months later, another listed under the same ticker at USD 24. What return does the table show?
Solution
Solution of Exercise 4.2.
, a return of between two different companies.
Exercise 4.3 ★
An equally weighted universe of 500 names replaces 11.5% of its members a month; each replaced name is sold and its replacement bought, at 20 basis points of the traded value on each side. What does membership churn alone cost a year, as a share of capital? And with the buffer’s 3.1%?
Solution
Solution of Exercise 4.3.
Each month 11.5% of the capital is sold and 11.5% bought, at 0.2% each: of capital a year. With the buffer, .
Exercise 4.4 ★★
In a year, 2% of a universe’s names are delisted for performance with no delisting return in the data, and a strategy holds them at average weight. By how much does ignoring a delisting return overstate the equal-weighted return?
Solution
Solution of Exercise 4.4.
points a year: the missing delisting return is lost on exactly the positions that fail.
Exercise 4.5 ★★
Why does an exit rank wider than the target size lower churn more than it lowers liquidity? Give an argument in terms of how ranks move from month to month.
Solution
Solution of Exercise 4.5.
Ranks near the boundary move by a few places a month in both directions; a name at rank 499 is as likely to be at 502 next month as at 496, and without a buffer every such crossing is a replacement. With an exit rank of 600 a member must fall a hundred places to leave, which takes a real change in its liquidity. The members kept are still in the top 600, so the universe’s liquidity is almost unchanged while the pointless replacements disappear.
Exercise 4.6 ★★
A signal uses the distance of a price from its 52-week high. On which series should it be computed: traded, split-adjusted or total-return adjusted prices? What goes wrong with each of the others?
Solution
Solution of Exercise 4.6.
The split-adjusted series: the distance is a ratio of two prices in the window, and later factors cancel in it, while splits inside the window are removed. Traded prices turn a split inside the window into an apparent fall of 50% or more; a total-return series mixes dividends into a price level, so a high-dividend stock looks further below its high than its price is.
Exercise 4.7 ★★★
Coding. Rerun the simulated market with reuse_prob 0, 0.35 and 0.7. How do the number of spliced returns and their mean and median absolute size change? Why is the mean so much larger than the median?
Solution
Solution of Exercise 4.7.
With probability 0, no reused ticker and no spliced return; with 0.35, 164 spliced returns (158 tickers reused), mean absolute size 164% and median 71%; with 0.7, 398 (371 tickers), mean 259% and median 90%. The number grows with the probability; each size is the ratio of two unrelated prices, and the mean is dominated by the few cases where the old holder’s last price was near zero (a performance delisting), which the median ignores.
Exercise 4.8 ★★★
Find the flaw. “Our universe is the stocks in our vendor’s current file with an adjusted price above USD 5 and a history of at least three years. We rebuild it every month back to 2010 from the same file.”
Solution
Solution of Exercise 4.8.
The current file contains only today’s survivors (survivorship bias) and its adjusted prices carry later splits into the past (the floor drops future winners); rebuilding back to 2010 from it applies both biases at every date. The universe must come from a point-in-time security master with delisted names, the floor on traded prices, and the history requirement counted from each date backwards.
4.9 Problem: The Ticker That Changed Hands
Problem 4.1
Weekend problem — what a ticker-keyed table and an adjusted price floor do to a universe
The chapter’s simulated market: 1 000 listings at any time over 120 months, performance delistings at a cumulative log return of with , cash mergers at 0.3% a month with a 25% premium, splits above USD 200, renames at 0.2% a month, and freed tickers reused by 35% of new listings, seed 4.
Part I — The market.
- How many listings are there over the ten years, and how many end?
- How many end for performance and how many by merger?
- How many splits are there, in how many names?
- How many tickers are reused, out of how many tickers ever used?
Part II — The ticker-keyed file.
- How many returns in the ticker file span two listings?
- What is their average absolute size?
- What return does the file show for KMKN between months 36 and 39?
- What share of the (month, ticker) pairs of the buffered universe have a twelve-month history mixing two listings?
- Why is that share much smaller than the share of reused tickers?
Part III — The adjusted floor.
- What share of the name-months above USD 5 does a floor on adjusted prices wrongly drop?
- What is the next-twelve-month return of the dropped names, and of the universe?
- Why are the dropped names future winners?
- What is the example stock’s traded and adjusted price at month 0, and when does it split?
- Which other level-based rules share the defect?
Part IV — Universes.
- What are the monthly churns of the 500-name universe without and with an exit rank of 600?
- What does the buffer cost in liquidity?
- Where do the delisted names’ last returns come from in the simulation, and in real data?
- State the named result: the number and average size of the spliced returns, and the forward return of the names the adjusted floor drops against the universe’s.
- Which two tables does a security master make unnecessary?
- In one sentence: why must a research table never be keyed on a ticker?
Solution
Solution of Problem 4.1.
1. 1 471 listings, 471 of which end. 2. 113 for performance, 358 by merger. 3. 335 splits in 231 names. 4. 158 of 1 549 tickers. 5. 164. 6. 164% (median 71%). 7. . 8. 0.30%. 9. The spliced windows are only those that straddle a switch, and the liquid universe rarely holds the failing companies before their delisting or the new listings soon after theirs. 10. 0.34%. 11. 71% against 15%. 12. A stock splits because its price rose; the adjusted price divides the early prices by the later split, so the stocks pushed below the floor are the ones that went on to rise. 13. 8.65 traded and 4.32 adjusted at month 0; a two-for-one split in month 57. 14. Any rule on a level: a capitalisation cut-off computed with adjusted prices and current shares, a minimum price for short sales, a distance from a past high computed with total-return prices. 15. 11.5% and 3.1% a month. 16. Almost nothing: every member is within the top 600 by traded value. 17. The simulation books the reason’s return on the delisting month ( or the merger price); in real data from the security master’s delisting record, with an estimate by reason when the return is missing. 18. Named result: joined on tickers, the simulated market’s price file contains 164 returns spanning two companies, of 164% in absolute size on average; a USD 5 floor on adjusted prices drops 0.34% of name-months whose next-year return is 71%, against 15% for the universe. 19. Any table keyed on tickers, and any “current” constituent list used for the past. 20. A ticker names a listing only for a date range, and the key must not change meaning over time.
4.10 Interview questions
Interview question 4.1 ★ developer, researcher
Why is a ticker not a good key for a research table? What would you use instead?
Solution
Solution of Interview question 4.1.
Tickers change (renames) and are reused after delistings, so one ticker can name several companies over time and one company several tickers. Key everything on a permanent internal identifier, with a mapping from each external symbol to it by date range.
What the interviewer is looking for: renames and reuse; a dated mapping to a permanent key.
Interview question 4.2 ★★ researcher
You filter your universe with a USD 5 minimum price on adjusted data. What bias did you just introduce?
Solution
Solution of Interview question 4.2.
Look-ahead through later splits: the adjusted price at an early date is divided by the splits that followed, which happen after prices rise, so the floor excludes future winners. Apply level rules to the price that traded that day.
What the interviewer is looking for: that adjustment factors come from the future.
Interview question 4.3 ★★ developer
Design the schema of a security master that answers “which security had ticker X on date D?” efficiently.
Solution
Solution of Interview question 4.3.
A securities table (permanent id, issuer, listing and delisting dates, delisting reason and return) and a symbol table (symbol type, symbol, permanent id, start date, end date) indexed on (symbol, start date); the query takes the row with start end. Add a corporate-actions table keyed on permanent id with announcement and ex-dates.
What the interviewer is looking for: date-ranged rows and an index on (symbol, start).
Interview question 4.4 ★★ researcher, trader
How do you choose the size and the rebalancing rule of a stock universe for a daily strategy?
Solution
Solution of Interview question 4.4.
From capacity and costs: large enough for breadth (chapter 15) and small enough that every name can be traded at the strategy’s size, with liquidity measured as known at each date; a buffer (exit rank wider than the size) and a minimum history to limit churn and cold starts; no rules on adjusted levels.
What the interviewer is looking for: liquidity versus breadth, a buffer, point-in-time rules.
Interview question 4.5 ★★ researcher, risk
Your backtest holds a stock that is delisted after a bankruptcy filing. What return do you book, and why?
Solution
Solution of Interview question 4.5.
The return to what a holder could realise: the over-the-counter price after delisting, or the recovery. If it is missing, an estimate by delisting reason (such as the Shumway recovered for performance delistings), flagged; never zero, which is the optimistic error on the losing positions.
What the interviewer is looking for: the delisting return, and not booking zero.
Interview question 4.6 ★★★ researcher
Prove that returns computed from split-adjusted prices equal holding returns, and show a rule on adjusted levels that looks into the future.
Solution
Solution of Interview question 4.6.
Between actions all prices are divided by one constant, which cancels in a return; at an ex-date the factor removes the mechanical price change, so the adjusted return equals the holding return. A floor on adjusted prices at date uses the split factors of actions after , which are more likely for stocks that later rose.
What the interviewer is looking for: the cancellation argument and a concrete leak.