Markets I: The Ecosystem and Exchange-Traded Markets · Markets
1What a Trading Firm Does
At 10:31:04 one hundred shares of a large company change hands at $50.01. The buyer is a dentist in Ohio who tapped a button on a phone; the seller is a firm in a data centre that has never heard of her and held the shares for eleven seconds. Between them, a broker, an exchange and a clearing house each handled the order, and each was paid. The print lasted a microsecond on the tape. This chapter is about who these firms are, how each of them earns a living from that print, and why none of them is doing the same job.
1.1 Five business models
Every firm in this book lives from trading, but “trading firm” covers at least five different businesses. They differ in three things: whose money is at risk, who pays them, and how long they hold a position.
Definition 1.1 (Market maker)
A market maker is a firm that continuously offers to buy and to sell the same instrument, at a lower price to buy (its bid) than to sell (its ask), and trades with whoever accepts. It risks its own capital and aims to end each day with little or no position.
Definition 1.2 (Bid–ask spread and mid price)
For a best bid and a best ask , the bid–ask spread is and the mid price is . The half-spread is what one market order pays relative to the mid.
Example 1.3 (The dentist’s order)
The market is bid, ask: , , and the spread is of the price. The dentist’s market order buys at the ask and pays the half-spread, $0.01 a share, that is $1.00 on her hundred shares. That dollar is the market maker’s gross revenue on the trade — before the price has had a chance to move.
Definition 1.4 (Proprietary trading firm)
A proprietary trading firm trades only its owners’ capital, has no clients and charges no fees: its entire revenue is its trading profit. Most electronic market makers are proprietary firms; many proprietary firms also run strategies that take liquidity instead of providing it.
Definition 1.5 (Hedge fund and multi-manager platform)
A hedge fund is a privately offered investment vehicle that trades outside investors’ capital with few constraints on instruments, leverage or short selling, and is paid a fee on the assets plus a share of the profits. A multi-manager platform is a hedge fund organised as many independent teams (“pods”), each given capital and tight risk limits by a central allocator that nets and manages the sum.
Definition 1.6 (Asset manager and assets under management)
An asset manager invests clients’ money under a written mandate — typically to track or to beat a benchmark — and is paid a percentage of the assets under management (AUM), the market value of the portfolios it runs.
The fifth model is the bank’s trading desk: a dealer that makes prices to clients in exchange for their business, studied in Chapter 2. Example 1.7 puts the five side by side.
Example 1.7 (Five firms, one table)
| Whose capital | Paid by | Holding period | Main cost | |
|---|---|---|---|---|
| Market maker | owners’ | the spread | seconds to hours | technology |
| Proprietary firm | owners’ | trading profit | seconds to weeks | technology, people |
| Hedge fund | investors’ | fees on assets and profits | days to years | people |
| Asset manager | clients’ | fee on assets | months to years | distribution |
| Bank desk | shareholders’ | spread and client business | minutes to months | capital |
The rest of the series keeps returning to this table: a technique that is central to one row (speed, for the first) is irrelevant to another (the fourth).
Remark 1.8 (Where “two and twenty” comes from)
The hedge fund’s fee structure is as old as the hedge fund. Alfred Winslow Jones, who started the first one in 1949 with $100 000, took 20% of the profits and at first nothing else; an annual fee on assets came later, and “2 and 20” — 2% of assets, 20% of profits — became the reference from which every fund now negotiates downward or, for the most sought-after, upward.
As of September 2026 — How large the industry is
Professionally managed assets worldwide were about $147 trillion at the end of 2025, up from $128 trillion a year earlier, by the most widely quoted industry count. Most of that year’s growth came from rising markets, not from new money.
1.2 Where the money comes from
Strip away the vocabulary and a trading business has only five sources of revenue.
Method 1.9 (Classifying a trading revenue)
Ask of any dollar of trading revenue which of these it is:
- Spread: paid by someone who wanted to trade now.
- Fee or commission: paid for a service (managing, executing, clearing, lending, publishing data) whatever the market does.
- Risk premium: paid, on average, for holding a risk others want to shed — equity risk, illiquidity, the short side of an insurance.
- Carry and financing: the difference between what a position yields and what it costs to fund.
- Alpha: profit from being right about a price when others were wrong.
A market maker lives on 1; an asset manager on 2; an index investor collects 3; a bank’s financing desk lives on 4; hedge funds sell 5 and often deliver a mixture of 3 and 5.
Definition 1.10 (Alpha)
The alpha of a strategy is the part of its expected return that is not compensation for bearing risks available cheaply elsewhere: in a regression of its returns on those of the tradable risk factors, the intercept.
Source 1 looks like free money: buy at the bid, sell at the ask, repeat. It is not, and the reason is the most important idea of the chapter.
Definition 1.11 (Adverse selection)
A market maker suffers adverse selection when the counterparties who choose to trade with its quotes are, more often than chance, those who know the price is about to move against it. Its cost is measured as the average move of the mid against the market maker’s new position after a trade.
Proposition 1.12 (Net capture)
A market maker quotes . A fraction of the orders it fills are informed: after each, the mid moves by against the market maker. The other orders carry no information. With a rebate and a clearing fee per share, the expected profit per share traded, the net capture, is
Proof. A customer buy of one share at leaves the market maker short one share at that price. Marked at the mid it has gained . With probability the mid then rises by and the short position loses ; otherwise the expected move is zero. Sells are symmetric. Rebate and fee are paid per share, whatever happens next. Positions inherited from earlier trades have zero expected profit, because the side of the next order is independent of them. ∎
Example 1.13 (One cent is not one cent)
Take cent, , cents, cent and cent. Then cent: almost half of the spread earned is handed back to better-informed counterparties. If rises to , cent; at the business loses money on every share while still “earning the spread” on each.
Proposition 1.14 (Break-even volume)
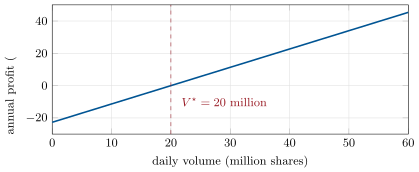
A firm with fixed costs per day and net capture per share breaks even at a daily volume , and its daily profit at volume is .
Proof. Daily profit is . ∎
The proposition is trivial and it is the whole economics of electronic market making: costs are fixed (people, machines, data, connectivity) and revenue is a tiny number multiplied by a very large one. Above nearly every extra share is profit; below it the firm bleeds. This is why the industry concentrates, and why public market makers’ results swing with market volumes.
As of September 2026 — Two listed market makers, in their own numbers
Most market makers are private, but two large ones publish results. Virtu Financial reported total revenues of $3 632 million and adjusted net trading income of $2 145 million for 2025 ($1 598 million for 2024). Flow Traders, a specialist in exchange-traded products, reported net trading income of € 486 million for 2025 with 635 employees at year end; for 2024 it reported € 468 million, 609 employees, and € 1 545 billion of exchange-traded products traded. Exercise 1.6 turns these into a capture in basis points.
1.3 Principal and agent
Definition 1.15 (Principal and agent)
A firm trades as principal when it is itself the buyer or the seller: the position, and its risk, land on its own balance sheet. It trades as agent when it arranges a trade between its client and a third party: it never owns the position and is paid a commission.
Example 1.16 (The same sale, twice)
A client wants to sell 500 000 shares trading around $50. As agent, the broker works the order in the market over the day for a commission of 1 cent a share: it earns $5 000 whatever price the client obtains, and the client bears the risk that the price falls during the day. As principal, the dealer buys the whole block now at $49.80: the client is done, and the dealer owns $24.9 million of stock that it must sell. If it sells at an average of $49.92 it makes $60 000; at $49.70 it loses $50 000. The 20-cent discount is the price of transferring the risk.
Remark 1.17 (Why the distinction is policed)
An agent owes its client the best result it can obtain; a principal is the client’s counterparty and profits from a worse price for the client. A firm that does both — most banks and most retail brokers’ execution partners — must tell the client in which capacity it acted on each trade, and regulators on both sides of the Atlantic examine how it chose. The rules are the subject of Chapters 10 and 11.
1.4 A map of one trade
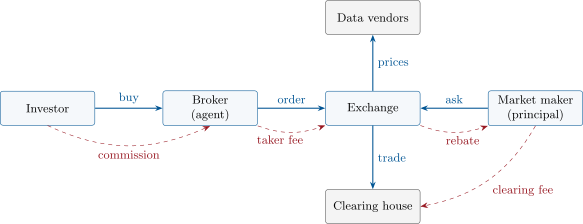
Follow the dentist’s hundred shares. Her broker, acting as agent, routes the order to an exchange and charges a commission (often zero to her face, and recovered elsewhere, as Chapter 10 explains). The exchange matches it against the market maker’s resting ask; under the common maker–taker schedule it charges the side that took liquidity and pays part of that to the side that provided it (Chapter 9). The clearing house steps between the two sides and guarantees settlement, for a fee (Chapter 5). The exchange sells the record of the trade to data vendors and directly to firms (Chapter 4). And the market maker, now short a hundred shares it sold at $50.01, waits for a seller to arrive at $49.99 — and hopes the dentist knew nothing.
1.5 Tutorial: who earned what today?
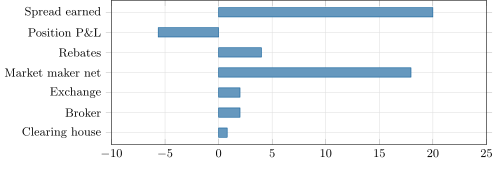
Goal. Simulate one day of trading in one stock and split every dollar that changed hands between the market maker, the exchange, the broker and the clearing house. End state: the bar chart that follows this tutorial, and a check of Proposition 1.12 against simulation.
Read the model. Twenty thousand customer orders of 100 shares hit a quote of cent; 15% of them are informed and move the mid by 3 cents. Fees follow a maker–taker schedule.
def simulate_day(seed: int, day: Day = BASE) -> dict[str, float]:
    rng = np.random.default_rng(seed)
    mid, inventory, cash = 50.0, 0, 0.0
    shares = day.n_orders * day.size
    for _ in range(day.n_orders):
        side = 1 if rng.random() < 0.5 else -1          # customer buys (+1) or sells
        price = mid + side * day.half_spread            # customer pays the spread
        cash += side * price * day.size                 # market maker takes the other side
        inventory -= side * day.size
        if rng.random() < day.informed:
            mid += side * day.jump                      # the informed were right
        mid += rng.normal(0.0, day.noise)
Listing 1.1. The trading loop: the market maker takes the other side of every order, and the informed move the price afterwards. code/markets-1/01-what-a-trading-firm-does/python/whoearns.py Split the market maker’s result. The position is marked at the closing mid. Whatever is not spread earned is the profit or loss of holding inventory while prices moved: mostly adverse selection.
    trading = cash + inventory * mid                    # marked at the closing mid
    spread = day.half_spread * shares
    return {
        "mm_spread_earned": spread,
        "mm_position_pnl": trading - spread,
        "mm_rebates": day.maker_rebate * shares,
        "mm_clearing": -day.clearing_fee * shares,
        "mm_net": trading + (day.maker_rebate - day.clearing_fee) * shares,
        "exchange_net": (day.taker_fee - day.maker_rebate) * shares,
        "broker_commission": day.commission * shares,
        "clearing_house": 2 * day.clearing_fee * shares,
        "customers_cost": -(day.half_spread + day.commission) * shares,
        "shares": float(shares),
    }
Listing 1.2. Who receives what. The customers’ cost equals the spread plus the commission; the professionals then share it out. code/markets-1/01-what-a-trading-firm-does/python/whoearns.py - Run it. From a Python prompt in the chapter’s
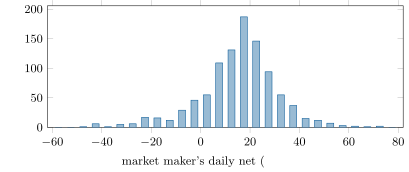
python/directory, importwhoearnsand printsimulate_day(1). You should see a spread earned of $20 000, a position loss near $5 600 and a market-maker net near $18 000. - Compare with theory. The proposition predicts a position loss of cent a share, $9 000 on two million shares. One day is one draw: run a thousand seeds and the mean converges to it, with a standard deviation of about $17 000 a day (the histogram below).
What to change next. Set informed=0.35: the firm still earns $20 000 of spread a day and now barely breaks even. Then make the market maker widen its quote after each informed trade, and watch volume — which the model holds fixed — become the thing you would need to model.
1.6 Build: the firm’s ledger
Purpose. The miniature trading firm assembled across this series needs one place where every dollar earned or spent is recorded and classified. Every later component — the P&L keeper of Chapter 7, the fee engines, the financing calculator — posts to it.
Interface. An immutable Entry(ts, account, category, currency, amount, ref) and a Ledger with post(entry), balance(account_prefix, currency) and by_category(account_prefix, currency). Accounts are dotted paths (desk.mm.equities); a prefix selects a subtree. Categories are spread, position, fee, rebate, commission, financing, other.
Rules. Amounts are signed integers in ten-thousandths of the currency unit, so that a rebate of 0.2 cent is exactly 20 units: never floating point for money that must add up. Entries are posted in time order; unknown categories, malformed currencies and non-integer amounts are rejected. Currencies are never added together.
Acceptance tests. code/firm/ledger/tests/test_ledger.py: ten thousand sub-cent rebates sum exactly; prefixes and categories aggregate; bad entries raise.
Stretch. Post the tutorial’s simulated day trade by trade and reproduce the tutorial’s bar chart from the ledger alone.
Sources and further reading
- Virtu Financial, Fourth Quarter 2025 Results, press release, 29 January 2026; Fourth Quarter 2024 Results, 29 January 2025.
- Flow Traders, 4Q and FY 2025 Results, 12 February 2026; 4Q and FY 2024 Results, 13 February 2025.
- Boston Consulting Group, Global Asset Management Report 2026; Global Asset Management Report 2025.
- “Alfred Winslow Jones”, Institutional Investor, Hall of Fame profile.
- L. Harris, Trading and Exchanges, Oxford University Press, 2003, chapters 3, 13 and 14 — the classic taxonomy of traders and of dealers’ revenues.
1.7 Exercises
Exercise 1.1 ★
A stock is quoted bid, ask. Give the spread, the mid, the spread in basis points of the mid, and the cost relative to the mid of a market order for 300 shares.
Solution
Solution of Exercise 1.1.
Spread ; mid ; . A market order pays the half-spread, a share: .
Exercise 1.2 ★
A market maker trades 2 million shares a day with a net capture of 0.1 cent a share. What does it earn in a day, and in a year of 252 trading days?
Solution
Solution of Exercise 1.2.
a day, and a year: a tenth of a cent is not a business at this volume, which is the point of Proposition 1.14.
Exercise 1.3 ★
For each activity say whether the firm acts as principal or as agent, and which of the five revenue sources of Method 1.9 pays it: (a) a broker routes a client’s order to an exchange for a commission; (b) a dealer buys a block from a client at a discount; (c) a manager runs a pension fund’s equity portfolio for 0.15% a year; (d) a firm quotes both sides of an exchange-traded fund all day; (e) a fund buys a stock because its model predicts a rise.
Solution
Solution of Exercise 1.3.
(a) Agent; fee. (b) Principal; spread (the discount), with position risk. (c) Agent in the economic sense — the client owns the portfolio; fee. (d) Principal; spread. (e) Principal for the fund’s investors; alpha — and, if the model merely loads on market risk, risk premium.
Exercise 1.4 ★★
A hedge fund starts the year with $500 million and earns 12% before fees. It charges a 2% management fee on opening assets and 20% of the profit remaining after that fee. Compute both fees, the investors’ net return, and the share of the gross profit that went to the manager.
Solution
Solution of Exercise 1.4.
Gross profit million. Management fee $10 million; performance fee million. Investors keep $40 million: a net return of 8%. The manager received , one third of the gross profit.
Exercise 1.5 ★★
A market maker earns a half-spread of 1 cent; 14% of its fills are informed and are followed by a 5-cent adverse move; it receives a rebate of 0.20 cent and pays 0.05 cent in clearing per share. Compute its net capture. Its fixed costs are $90 000 a day: find its break-even volume.
Solution
Solution of Exercise 1.5.
cent. million shares a day.
Exercise 1.6 ★★
Use the 2024 figures of Box 1.2. (a) Express Flow Traders’ net trading income as basis points of the value of exchange-traded products it traded. Why is this an upper bound on its capture in those products? (b) Compute net trading income per employee. (c) On a € 50 product, how many cents is the capture of (a)?
Solution
Solution of Exercise 1.6.
(a) . It is an upper bound because net trading income also includes the firm’s trading in other asset classes, while the denominator counts exchange-traded products only. (b) million per employee. (c) : a cent and a half.
Exercise 1.7 ★★★
Coding. With the tutorial’s simulator, run simulate_day(7). (a) Report the market maker’s spread earned, position P&L and net. (b) The position P&L is far from its expectation of on many days. Without running anything, explain which term of the model creates this dispersion, and how it would scale if each order were for 400 shares and there were 5 000 of them.
Solution
Solution of Exercise 1.7.
(a) Spread earned $20 000; position P&L ; net $14 427 (after $4 000 of rebates and $400 of clearing). (b) The dispersion comes from inventory: the market maker’s position is a random walk of one order size per trade, and that position is exposed to every later move of the mid, informed jumps included. Quadrupling the order size while dividing the number of orders by four keeps the volume but makes the inventory walk times larger at any given time of day: the standard deviation of the daily result roughly doubles, with the same mean.
Exercise 1.8 ★★★
Find the flaw. A pitch deck reads: “Our strategy earns the bid–ask spread. The average spread in our universe is 6 basis points, we trade our capital ten times a day, so we earn 60 basis points a day before costs. We execute with market orders to guarantee our fills.” Find two independent errors, and say what the daily figure is likely to be.
Solution
Solution of Exercise 1.8.
First, market orders pay the half-spread; only resting orders earn it, and they are not guaranteed to fill: the strategy as described loses 6 basis points per round trip. Second, even a passive strategy does not keep the spread: adverse selection returns a large part of it (Proposition 1.12), and fills are more likely exactly when they are unprofitable. With ten round trips a day at market the likely figure is about basis points a day before fees.
1.8 Problem: A Week at Quad Street Markets
Problem 1.1
Weekend problem — a week at a small market maker
Quad Street Markets is a fourteen-person proprietary firm making markets in forty large stocks. Its owner asks you one question: “how much do we have to trade to survive?”
Part I — What a share earns. The average stock trades at $40 with a spread of 2 cents. Quad Street trades 6 million shares a day, always passively.
- Give the half-spread in cents and in basis points of the price.
- 12% of Quad Street’s fills are informed and are followed by a 5-cent adverse move. What does adverse selection cost per share?
- The exchanges pay a rebate of 0.20 cent; clearing costs 0.02 cent. Compute the net capture.
- Compute the expected daily trading revenue.
- And the expected annual revenue, for 252 days.
Part II — What the firm costs.
- Fourteen people cost $350 000 each per year all-in; technology, colocation and data cost $2.1 million; everything else $0.56 million. Give the annual cost and the cost per trading day.
- Give the expected daily and annual profit.
- Give the cost-to-income ratio.
Part III — Breaking even.
- Find the break-even daily volume .
- A new aggressive fund becomes active in Quad Street’s stocks and the informed share of its fills rises to 16%. Find the new net capture and the new .
- At 6 million shares a day, what is the daily result now?
- What half-spread would restore the original net capture? The minimum price increment is 1 cent: what can Quad Street actually do?
- Independently of question 10, the exchanges cut the rebate to 0.15 cent. Find .
Part IV — Risk. Return to the original figures. The daily result has a standard deviation of $22 000 and days are independent and roughly normal.
- What is the probability of a losing day?
- Compute the annualised Sharpe ratio (mean over standard deviation of the daily result, times ).
- What is the probability of a losing year?
- The owners keep $5 million of capital in the firm. What is the expected annual return on it?
- Volumes double in a volatile quarter and costs do not move. By what factor does the daily profit grow?
- Explain in two sentences why a market maker’s owners like volatile markets and its risk manager does not.
- State the answer to the owner’s question in one sentence, naming the three numbers he should watch every day.
Solution
Solution of Problem 1.1.
1. 1 cent; . 2. cent. 3. cent. 4. . 5. . 6. million; $30 000 a day. 7. $4 800 a day; $1 209 600 a year. 8. . 9. shares: the firm runs 16% above break-even. 10. cent; . 11. a day. 12. A half-spread of 1.2 cents, a spread of 2.4 cents, which cannot be quoted. Quad Street can quote 3 cents and lose most of its fills to competitors still at 2, or stay at 2 and quote only when its own signals say the flow is benign: selecting when to be in the market is the only continuous control it has. 13. cent; . 14. . 15. . 16. : about one year in 3 700. 17. . 18. . 19. Volatile markets bring volume and wider spreads, and with fixed costs almost all of the extra revenue is profit (question 18). They also bring larger moves against inventory and more informed flow, so the standard deviation of the daily result and the adverse-selection term rise with them. 20. Quad Street survives above about 5.2 million shares a day, and the three numbers to watch are its volume, its net capture per share (above all the adverse-selection part) and its cost per day.
1.9 Interview questions
Interview question 1.1 ★ trader, researcher, developer
How does a market maker make money, and how does it lose money?
Solution
Solution of Interview question 1.1.
It earns the half-spread on each fill, plus any exchange rebate, by selling immediacy to those who want to trade now. It loses in two ways: adverse selection — the fills it gets are disproportionately those just before the price moves against it — and inventory risk on the position it accumulates in the meantime. It pays fixed technology and people costs, so profit is a small net capture times a large volume, less those costs.
What the interviewer is looking for: both losses named without prompting, and the sense that the spread is a gross figure, not the profit.
Interview question 1.2 ★ trader, researcher, developer, mle
What is the difference between a proprietary trading firm and a hedge fund? Why might the same strategy be run differently in each?
Solution
Solution of Interview question 1.2.
A proprietary firm trades its owners’ money and earns its trading profit; a hedge fund trades investors’ money and earns fees on assets and on profits. Consequences: the fund wants capacity (fees scale with assets) and smooth monthly returns that investors will tolerate; the proprietary firm wants return on a small capital base and can run strategies with little capacity, more volatile results, and no obligation to explain them to anyone.
What the interviewer is looking for: incentives derived from who owns the capital, not a list of firm names.
Interview question 1.3 ★★ trader, researcher
You are quoting / and someone sells you 100 shares at . A minute later the market is / . How much have you made or lost, and how would you split that number into two parts?
Solution
Solution of Interview question 1.3.
You bought 100 at 49.99 and the mid is now 49.97: . Split: of spread earned (you bought 1 cent below the then mid of 50.00) and from the 3-cent fall of the mid afterwards. The second part, averaged over many fills, is your adverse selection.
What the interviewer is looking for: marking at the mid, and the decomposition offered unprompted.
Interview question 1.4 ★★ researcher, developer
A firm nets one basis point on the $2 billion it trades each day. Estimate its annual trading revenue in your head. Is one basis point a plausible number?
Solution
Solution of Interview question 1.4.
One basis point of $2 billion is $200 000 a day; times about 250 days, $50 million a year. It is plausible: the published figures of listed market makers imply a few basis points of value traded at most, and much less in the most liquid products.
What the interviewer is looking for: fast arithmetic () and a sanity check against something known.
Interview question 1.5 ★★ bank, trader
A client calls to sell a block worth ten days of average volume. Describe two ways your desk can help, how the desk is paid in each, and who bears the price risk.
Solution
Solution of Interview question 1.5.
As agent: work the order over several days with an execution algorithm for a commission; the client keeps the price risk and the information-leakage risk. As principal: bid for the block at a discount to the last price; the desk takes the risk and is paid by the discount, which must cover the expected cost of unwinding ten days of volume plus the volatility over that period. Hybrids exist: a guaranteed benchmark price for part, agency for the rest.
What the interviewer is looking for: the risk transfer stated explicitly, and a discount that grows with size and volatility.
Interview question 1.6 ★★★ trader, researcher
Last month the spreads you quoted were twice as wide as the month before, your volume was the same, and you made less money. Give two explanations and the measurement that would tell them apart.
Solution
Solution of Interview question 1.6.
(i) Spreads widened because flow became more informed or more volatile: adverse selection per share rose by more than the half-spread. (ii) You were wider than competitors, so you were filled only when everyone else had pulled away — the worst fills — and your volume was kept up by exactly those. Measurement: the markout of your fills (the mid a few seconds and minutes after each fill, signed by your side), split by whether you were alone at the best price.
What the interviewer is looking for: the idea that fills are selected, and a concrete measurement rather than a story.