Markets I: The Ecosystem and Exchange-Traded Markets · Markets
11European Equity Market Structure
A share of a large French company trades this morning on the Paris exchange that listed it, on several pan-European platforms, in a handful of banks’ own books, in auctions that last a tenth of a second, and in dark pools that match at a midpoint nobody publishes in one place. In July 2026 about € 80 billion of European shares changed hands each day; barely half of what traded on venues did so in a continuous, visible order book. And until September 2026 the continent had never had what the United States has long had: a single public tape saying what the best price is. This chapter describes a market that solved the same problems as the American one with opposite choices.
11.1 One directive, four kinds of place
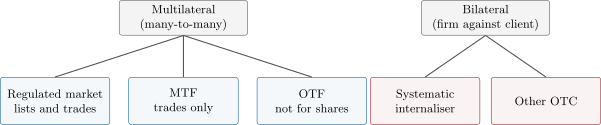
The Markets in Financial Instruments Directive ended the national exchanges’ monopolies in 2007; its second version, MiFID II, with the accompanying regulation MiFIR, has governed European trading since January 2018. It sorts every place where a share can trade into legal categories.
Definition 11.1 (Regulated market and organised trading facility)
A regulated market is a multilateral system, operated by a market operator, that brings together multiple third-party buying and selling interests under non-discretionary rules and admits instruments to trading: the European legal form of an exchange. An organised trading facility (OTF) is a multilateral system whose operator may exercise discretion in matching; it exists for bonds and derivatives and may not trade shares.
Between the two sits the multilateral trading facility (Definition 4.13), which has the regulated market’s rules without its listing function: the pan-European platforms are MTFs.
Definition 11.2 (Systematic internaliser)
A systematic internaliser (SI) is an investment firm that, on an organised, frequent and substantial basis, deals on its own account when executing client orders outside a trading venue. It is a counterparty, not a venue: every trade is bilateral, against the firm’s own book, and the firm must publish firm quotes in liquid shares up to a standard size.
Definition 11.3 (Best execution)
Best execution is the obligation of a firm executing client orders to take all sufficient steps to obtain the best possible result, taking into account price, costs, speed, likelihood of execution and settlement, size and nature of the order.
This is the European answer to fragmentation, and it is the opposite of the American one. There is no order protection rule (Definition 9.1): no venue is obliged to route to a better price elsewhere, and a trade at an inferior price breaks no market rule. The duty sits with the broker, as a policy it must write, follow and be able to demonstrate. Venues connect to whom they like; brokers’ routers are what ties the market together.
11.2 Fragmentation without a tape
Definition 11.4 (Consolidated tape provider)
A consolidated tape provider (CTP) is an entity authorised to collect trade reports, and for shares the best bids and offers, from all venues and publication arrangements, and to disseminate them as one continuous stream.
As of September 2026 — A tape, at last
For eighteen years after competition began, Europe had no consolidated tape for shares: each firm built its own view from venue feeds, or bought a vendor’s. In December 2025 ESMA selected a consortium of exchanges, EuroCTP, as the first provider for shares and exchange-traded funds, and later authorised it for five years under its direct supervision. The tape’s launch was set for 14 September 2026, with a transition period to 30 September 2026. Its data are free of charge for retail investors, academics and regulators.
The absence of an official best price had practical consequences that persist. “The European best bid and offer” is a number each firm computes for itself, from the venues it has chosen to connect to, with no round-lot filter and no protected status; two brokers can honestly disagree about it. Transaction-cost analysis must state which venues its benchmark included. And the primary exchange’s price keeps a privileged role out of habit: when the national exchange halts, volume on the platforms that copy its price often dries up too.
Definition 11.5 (Effective number of venues)
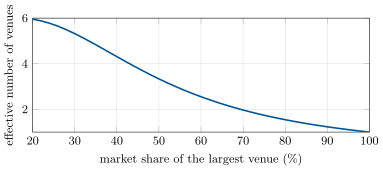
If venues have market shares summing to one, the Herfindahl index is and the effective number of venues is : the number of equal-sized venues that would produce the same concentration.
Example 11.6 (Fragmented, but how much?)
A stock trades 60% on its primary exchange, 20% on one platform and 10% on each of two others. : an effective 2.4 venues, although there are four. If the primary’s share falls to 40% and the others take 20% each, and the effective number is 3.6. The measure moves mostly with the leader’s share (Figure 11.2).
11.3 The mechanisms: lit, dark, periodic, close
As of September 2026 — How European shares traded in July 2026
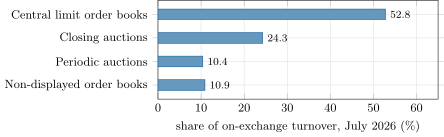
By one pan-European operator’s monthly statistics, on-exchange turnover in European equities averaged € 57.5 billion a day in July 2026, out of € 80 billion of addressable activity including off-exchange trading. Of the on-exchange part, continuous central limit order books were 52.8%, closing auctions 24.3%, periodic auctions 10.4% and non-displayed order books 10.9%. Systematic internalisers accounted for € 14.3 billion a day, 17.8% of addressable volume.
MiFID II requires pre-trade transparency: a venue must publish its bids and offers. Dark trading exists by waiver from that rule.
Definition 11.7 (Reference price waiver and large-in-scale waiver)
Under the reference price waiver a venue need not display orders that execute at a price taken from another market, in practice the midpoint of the primary exchange’s quote. Under the large-in-scale waiver it need not display an order that is large compared with normal market size for that share.
Definition 11.8 (Volume cap)
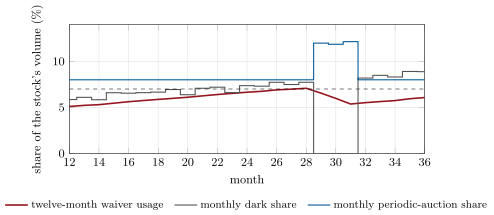
The original double volume cap suspended trading of a share under the reference price waiver when, over twelve months, such trading exceeded 4% of the share’s total volume on any one venue or 8% across the Union. Since October 2025 it is replaced by a single volume cap: 7% across the Union, with a three-month suspension of the waiver in that share when it is exceeded.
As of September 2026 — The cap in operation
ESMA published the first single-volume-cap results on 9 October 2025 and publishes calculations and suspensions quarterly; the double-volume-cap system was scheduled for decommissioning in January 2026. Large-in-scale trading is outside the cap.
Definition 11.9 (Periodic auction)
A periodic auction is a short call auction, typically lasting a fraction of a second, that starts when two orders in the book could match, publishes an indicative price and size during its brief life, and uncrosses at a single price, often constrained to lie within the best bid and offer of the reference market.
Periodic auctions grew when the first caps suspended dark trading in many shares: a share suspended from midpoint dark trading could still be traded at, or near, the midpoint in an auction that is “lit” by the letter of the law and gives almost as little information as a dark pool. Every rule in this market has produced the mechanism that routes around it; the reader who wants to predict the next one should ask what the new single cap makes expensive.
11.4 The close, and the tick
A quarter of on-exchange turnover in the closing auction is not an accident of taste. Index funds must trade at the closing price they are measured against (Chapter 3); the primary exchange owns that price; and as more volume goes there, the intraday book thins, which sends more volume there. The auction mechanism itself is the subject of Chapter 13.
Unlike the American one-cent increment, European tick sizes are set by a table. Under the tick-size regime (RTS 11) the minimum increment of a share depends on two things: its price, and a liquidity band given by its average daily number of transactions on its most relevant market, recalculated once a year. More liquid shares get smaller ticks at the same price. The design aims at a spread of a few ticks everywhere; it also means that one share’s tick can change on the first Monday of April with no change in its price, shifting queue lengths and market makers’ economics overnight.
11.5 Tutorial: measuring fragmentation
Goal. Build a European best bid and offer, measure concentration, and monitor a volume cap. End state: Figures 11.2 and 11.4.
Concentration and the best quote. There is no round-lot filter and no protected status: the best price is simply the best price among the venues you chose to look at.
def herfindahl(shares) -> float:
    s = np.asarray(list(shares), dtype=float)
    s = s / s.sum()
    return float((s * s).sum())


def effective_venues(shares) -> float:
    """1 / HHI: the number of equal-sized venues that would give the same concentration."""
    return 1.0 / herfindahl(shares)


def ebbo(quotes: dict[str, tuple[float, float]]) -> tuple[float, float, list[str], list[str]]:
    """European best bid and offer from {venue: (bid, ask)}; no protection rule, no size filter."""
    bid = max(b for b, _ in quotes.values())
    ask = min(a for _, a in quotes.values())
    return (bid, ask, sorted(v for v, (b, _) in quotes.items() if b == bid),
            sorted(v for v, (_, a) in quotes.items() if a == ask))
Listing 11.1. Herfindahl index, effective number of venues, and a best bid and offer across venues. code/markets-1/11-european-equity-market-structure/python/euro_frag.py - Try it. With Paris at and two platforms at and , the best quote is : tighter than the primary exchange’s own, and invisible to anyone who watches only the primary.
The cap is a rolling ratio.
def cap_usage(waiver_volume: np.ndarray, total_volume: np.ndarray, window: int = 12) -> np.ndarray:
    """Rolling share of volume traded under the reference price waiver over `window` months."""
    w = np.convolve(waiver_volume, np.ones(window), mode="valid")
    t = np.convolve(total_volume, np.ones(window), mode="valid")
    return w / t
Listing 11.2. Twelve-month usage of the reference price waiver. code/markets-1/11-european-equity-market-structure/python/euro_frag.py - Simulate a breach. In the chapter’s scenario the usage crosses 7% in month 28; the dark book is empty in months 29 to 31 and the periodic-auction share jumps from 8% to about 12%.
What to change next. Make usage a forecast: given the last eleven months, what dark share next month triggers a suspension? A broker’s router needs exactly that number. Then recompute Example 11.6 counting systematic internalisers as one more “venue”.
11.6 Build: the fragmentation monitor
Purpose. The miniature firm’s router and its cost analysis both need to know, per instrument, where volume trades and by which mechanism, and how close each share is to losing its dark liquidity.
Interface. Monitor.add(trade) with a trade carrying instrument, venue code (Section 4.6), mechanism (lit, dark_rpw, dark_lis, periodic, auction, si), value and month; shares(instrument, by) with by in venue or mechanism; effective_venues(instrument); cap_usage(instrument, month); headroom(instrument, month) returning the waiver volume that would bring next month’s usage to the cap.
Rules. Values are integers in ledger units. Only dark_rpw counts toward the cap; large-in-scale does not. Usage needs twelve full months: before that the monitor returns no figure, not a partial one.
Acceptance tests. code/firm/fragmentation/tests/: shares sum to one; the example’s Herfindahl index; cap usage on a constant series; the large-in-scale exclusion; headroom brings usage exactly to 7%.
Stretch. A suspension calendar: given quarterly publication dates, the months in which each instrument’s waiver is unavailable.
Sources and further reading
- Directive 2014/65/EU (MiFID II), article 4(1)(20)–(24) and article 27; Regulation (EU) No 600/2014 (MiFIR) as amended in 2024.
- ESMA, ESMA selects EuroCTP to become the first Consolidated Tape Provider for shares and ETFs, 19 December 2025; ESMA authorises EuroCTP as the Consolidated Tape Provider for shares and exchange-traded funds, 2026.
- ESMA, ESMA prepares for switch toward single volume cap in October 2025; Double Volume Cap Mechanism (discontinued).
- Commission Delegated Regulation (EU) 2017/588 (RTS 11), tick size regime for shares, depositary receipts and exchange-traded funds.
- Cboe Global Markets, Market Metrics That Matter: European Equities July Volume Briefing, 17 August 2026.
- C.-A. Lehalle and S. Laruelle (eds.), Market Microstructure in Practice, 2nd ed., World Scientific, 2018, chapter 1.
11.7 Exercises
Exercise 11.1 ★
Classify each as regulated market, MTF, OTF, systematic internaliser or other: (a) the exchange on which a German company is listed; (b) a pan-European platform trading 3 000 shares it did not list; (c) a bank filling its clients’ share orders from its own book all day; (d) a broker’s system matching bond orders with discretion.
Solution
Solution of Exercise 11.1.
(a) Regulated market. (b) Multilateral trading facility. (c) Systematic internaliser. (d) Organised trading facility, permitted because the instruments are bonds.
Exercise 11.2 ★
A share’s volume splits 45%, 25%, 15%, 10%, 5% across five venues. Compute the Herfindahl index and the effective number of venues.
Solution
Solution of Exercise 11.2.
; effective number 3.33.
Exercise 11.3 ★
From Box 11.2, compute in euros per day the turnover of closing auctions, of periodic auctions and of non-displayed books, and the off-exchange activity that is not systematic internalisers’.
Solution
Solution of Exercise 11.3.
Closing auctions billion a day; periodic auctions € 6.0 billion; non-displayed books € 6.3 billion. Off-exchange , of which € 14.3 billion systematic internalisers and € 8.2 billion other.
Exercise 11.4 ★★
Three venues quote a share: X , Y , Z . Give the best bid and offer and their venues. A broker connected only to X and Y buys at 18.355. Has it broken a market rule? Has it failed its client?
Solution
Solution of Exercise 11.4.
Best bid 18.350 (Z), best offer 18.355 (Y). Buying at 18.355 on Y is at the best offer: no issue this time. Had Z offered lower, the broker would still have broken no market rule — there is no trade-through prohibition — but it would have to justify under its best-execution policy why Z is not among its venues (cost of connection against expected price improvement). The obligation is about the policy and its review, not about each fill.
Exercise 11.5 ★★
Over the last eleven months a share traded € 4 400 million in total, of which € 300 million under the reference price waiver. Next month’s total is expected to be € 400 million. What waiver volume next month brings the twelve-month usage exactly to 7%? Express it as a share of that month’s volume.
Solution
Solution of Exercise 11.5.
million, that is 9% of next month’s volume: a share can run above 7% in a month as long as the year stays below.
Exercise 11.6 ★★
A share at € 12.40 has a tick of € 0.005 and a typical spread of two ticks. After the annual recalculation its liquidity band changes and the tick becomes € 0.01. Give the spread in basis points before, and the minimum possible spread after. What happens to the queue at the best price?
Solution
Solution of Exercise 11.6.
Before: two ticks of 0.005, € 0.01, that is . After: the minimum spread is one tick, again € 0.01, : the quoted spread need not change, but it is now one tick. Prices that used to sit on two levels each side collapse onto one; the queue at the best price becomes much longer, time priority becomes valuable, and a market maker earns a full tick per round trip but waits longer for each fill.
Exercise 11.7 ★★★
Coding. With simulate_cap, find the first month of breach for seeds 0 to 49 and report the median. Then set the upward drift of the dark share to zero and report how many of the fifty paths still breach.
Solution
Solution of Exercise 11.7.
Median month of first breach: 28, and all fifty paths breach. With zero drift the dark share stays near 4.5%, its starting level, and no path breaches: the cap binds on trends, not on noise, because a twelve-month sum averages the monthly noise away.
Exercise 11.8 ★★★
Find the flaw. A transaction-cost report states: “Our algorithm achieved an average fill 0.4 basis point better than the European best bid and offer.” The benchmark is built from the three venues the algorithm trades on; the stock also trades on four other venues and with seven systematic internalisers. Explain what the figure does and does not show, and how to repair it.
Solution
Solution of Exercise 11.8.
It shows that fills were slightly better than the best quote on the three venues the algorithm already uses: a benchmark built from its own opportunity set, which it can hardly fail to match. It does not show that a better price was unavailable on the four other venues or from the systematic internalisers, which is the best-execution question. Repair: benchmark against a best bid and offer built from all lit venues with a material share (or, now, the consolidated tape), state the venue list in the report, and add the midpoint as a second benchmark, since much of the volume trades there.
11.8 Problem: Where Did the Volume Go?
Problem 11.1
Weekend problem — a share loses its dark pool
A large-capitalisation share trades € 500 million a day on average, 21 days a month. Its turnover splits as follows: primary exchange’s continuous book 38%, primary’s closing auction 20%, three MTFs’ lit books 9% each (27%), midpoint dark books under the reference price waiver 7.5%, periodic auctions 4%, large-in-scale blocks 3.5%. (Systematic internalisers are ignored here.)
Part I — Before.
- Give the monthly turnover and the monthly value traded in midpoint dark books.
- By venue operator the shares are: primary 60% (its book, its auction and 2% of the dark and periodic volume), and the rest split equally among four platform operators. Compute the effective number of operators.
- By mechanism, compute the Herfindahl index over the six categories above and the effective number of mechanisms.
- The twelve-month waiver usage stands at 7.5%. What happens, and for how long?
Part II — The suspension. During the suspension the 7.5% that traded in midpoint dark books goes: 45% to periodic auctions, 25% to large-in-scale blocks, 20% to lit continuous books (split between primary and MTFs in proportion to their lit shares), and 10% is not traded at all.
- Give the new share of each mechanism as a percentage of the original turnover.
- Renormalise to the new, lower turnover and give the new percentages.
- By how many percentage points did periodic auctions gain?
- Recompute the effective number of mechanisms.
- An institutional broker’s midpoint fills saved it half the spread, 2 basis points, on the volume it traded dark, which was 12% of its € 40 million a day in this share. If only the periodic-auction and block fractions of that flow still execute at the midpoint, what does the suspension cost it per month?
Part III — Coming back.
- After three months the waiver is restored. With zero dark volume for three months and 7.5% a month before that, what is the twelve-month usage on the day of restoration?
- If dark trading resumes at 7.5% a month, how many months until usage exceeds 7% again?
- What monthly dark share keeps usage at exactly 7% forever?
- Why might the operators of dark books collectively prefer to stay under that level, and why can they not easily coordinate to do so?
Part IV — Judgement.
- Who is protected by the cap, in the legislator’s reasoning?
- Who bears its cost, according to question 9?
- Periodic auctions display an indicative price for a fraction of a second. In what sense are they lit, and in what sense dark?
- Why does the large-in-scale waiver escape the cap?
- With a consolidated tape now publishing the best bid and offer, which statistics of this problem become easier to compute, and which do not change?
- State the named result: the periodic auctions’ market share during the suspension, as a percentage of the renormalised turnover.
- In one sentence: what is the general law of market structure this problem illustrates?
Solution
Solution of Problem 11.1.
1. € 10 500 million a month; € 787.5 million dark. 2. : 2.5 effective operators. 3. : 3.76 effective mechanisms. 4. Usage exceeds 7%: the reference price waiver is suspended in this share for three months on every venue. 5. Primary book ; closing auction 20; MTF lit ; dark 0; periodic ; blocks ; total 99.25 (0.75 not traded). 6. 39.2%, 20.2%, 27.8%, 0, 7.4%, 5.4%. 7. points. 8. 3.57: fewer effective mechanisms, since one of six has disappeared. 9. Dark flow € 4.8 million a day; 30% of it (€ 1.44 million) no longer gets the midpoint and pays 2 basis points: € 288 a day, € 6 048 a month in this one share. 10. . 11. The three empty months stay in the window until they are twelve months old. Usage is 5.6% for nine months, then 6.25%, 6.875%, and 7.5% in the twelfth month after restoration: a cycle of twelve months on, three months off. 12. 7%. 13. Below 7% nobody is ever suspended and the total dark volume over a cycle is larger ( against followed by three months of nothing, that is 90 over fifteen months, or 72 per twelve). But each operator gains by taking more share while the waiver lasts, and would let the others bear the restraint: a commons problem. 14. Participants in the lit market: the legislator’s view is that too much dark trading degrades the public price everyone uses. 15. The institutional investor who loses midpoint executions, and ultimately the savers behind it; part of the flow also stops trading. 16. Lit: an indicative price and quantity are published before the uncrossing, and any participant may join. Dark: the publication lasts milliseconds, reveals no individual order, and the price is usually pinned inside the reference market’s quote, so the information content is close to that of a midpoint cross. 17. Because displaying a very large order would move the price against it; the waiver protects the order, and blocks are too lumpy and too rare to substitute for the lit market. 18. Easier: anything measured against a best bid and offer, such as question 9’s spread saving and any effective-spread statistic. Unchanged: market shares by venue and mechanism and cap usage, which come from trade reports, not quotes. 19. 7.4%. 20. Order flow is conserved, and migrates to the closest legal substitute for whatever a rule has just made expensive.
11.9 Interview questions
Interview question 11.1 ★ trader, researcher, developer
Name the main differences between US and European equity market structure.
Solution
Solution of Interview question 11.1.
No order protection rule in Europe: best execution is a broker-level policy, not a venue-level routing obligation. No consolidated tape until 2026, so no official best bid and offer. Many listing exchanges and currencies instead of one national market, with the primary exchange dominant in its own stocks. Tick sizes by table (price and liquidity), not a uniform cent. Dark trading by waiver, with a volume cap; large closing auctions and periodic auctions. No payment for order flow in most jurisdictions; bilateral trading through systematic internalisers instead of wholesalers.
What the interviewer is looking for: the routing/best-execution contrast first; the rest is detail.
Interview question 11.2 ★ trader, bank
What is a systematic internaliser, and how does it differ from a multilateral trading facility?
Solution
Solution of Interview question 11.2.
An investment firm dealing on own account against client orders outside a venue, on an organised, frequent and substantial basis. Every trade has the firm as counterparty and the firm chooses its clients; an MTF is a neutral multilateral system where participants’ orders interact under non-discretionary rules and the operator takes no position.
What the interviewer is looking for: bilateral and principal versus multilateral and neutral.
Interview question 11.3 ★★ researcher, trader
Why is a quarter of European on-exchange volume traded in the closing auction, and what does that do to intraday liquidity?
Solution
Solution of Interview question 11.3.
Index funds and benchmarked managers are measured against the close and want zero tracking error against it; derivatives, funds and indices settle on it; and the auction offers large size with no spread. As volume concentrates there, the continuous book thins, intraday impact rises, and still more participants wait for the close: a self-reinforcing migration that also hands the listing exchange pricing power over its auction.
What the interviewer is looking for: the feedback loop, not only “because of passive”.
Interview question 11.4 ★★ developer, researcher
You must compute a European best bid and offer for transaction-cost analysis. What decisions do you have to make that a US analyst does not?
Solution
Solution of Interview question 11.4.
Which venues to include (listing exchange only, all lit venues, those above a market-share threshold, systematic internalisers’ quotes or not); how to treat periodic-auction indications; currency conversion for multi-listed shares; clock synchronisation across venues in different data centres; how to handle a primary-exchange halt or auction while other venues keep trading; whether to include sizes and what minimum size. None of this is prescribed, so the choices must be documented and kept fixed across the analysis.
What the interviewer is looking for: the benchmark as a modelling choice that must be declared.
Interview question 11.5 ★★ trader, researcher
A share is about to be suspended from midpoint dark trading under the volume cap. How does that change the way you execute a large order in it?
Solution
Solution of Interview question 11.5.
Midpoint dark liquidity disappears for three months. Shift the passive, spread-saving part of the order to periodic auctions and to conditional block venues under the large-in-scale waiver; expect lower fill rates at the midpoint and therefore either a longer schedule or more lit, spread-paying execution; use the close more. Before the suspension date, if the forecast is reliable, accelerate the dark-eligible part of the order.
What the interviewer is looking for: substitution toward periodic auctions and blocks, and the cost in fill probability.
Interview question 11.6 ★★★ researcher, trader
A share’s tick size doubles after the annual recalculation. Predict the effect on spread, depth, queue times and a market maker’s profitability, and say how you would test your predictions.
Solution
Solution of Interview question 11.6.
If the old spread was two or more old ticks, it can now be one new tick: the quoted spread stays the same or widens to the new minimum; depth at the best price rises sharply because orders pile onto fewer levels; queue times lengthen and cancellations fall; price-improvement inside the spread becomes impossible. For a market maker, revenue per fill rises and fills per unit of time fall, and the advantage shifts from pricing skill to queue position and speed; trading migrates toward midpoint and periodic venues that escape the tick. Test with a difference-in-differences on the annual recalculation: shares that changed band against similar shares that just did not, comparing spread, depth, realised spread and venue shares before and after.
What the interviewer is looking for: queue priority as the new scarce resource, and a clean identification strategy.