Markets I: The Ecosystem and Exchange-Traded Markets · Markets
10Retail Flow and Wholesaling
You open a brokerage application, tap “buy”, and ten shares appear in your account a quarter of a second later at a price a fraction of a cent better than the one on the screen. You paid no commission. Your order never reached a stock exchange: your broker sent it to a trading firm, which sold you the shares from its own inventory and paid your broker for the privilege. Dealers trading as principal away from exchanges account for roughly four in ten shares traded in the United States (Box 9.3), and retail orders handled this way are a large part of that. This chapter explains why a trading firm pays to trade against you, how the quality of what you received is measured, and what the arrangement does to everyone else.
10.1 The path of a retail order
Definition 10.1 (Wholesaler and internalisation)
A wholesaler is a market-making firm that receives the marketable orders of retail brokers’ customers and executes most of them as principal, against its own account, away from any exchange. Internalisation is the execution of a client order against the executing firm’s own inventory instead of against other investors’ orders on a venue.
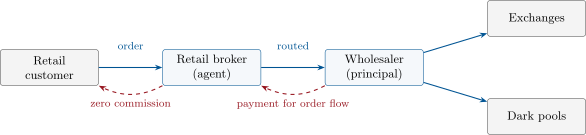
The broker remains an agent: it owes its customer best execution, and the choice of wholesaler is its routing decision. The wholesaler is a principal: it owes the customer nothing beyond the price it promised the broker it would deliver, and competes with other wholesalers on that promise.
Definition 10.2 (Payment for order flow and price improvement)
Payment for order flow (PFOF) is a payment by an executing firm to a broker in return for the broker routing its customers’ orders to that firm. Price improvement is the amount by which an execution is better than the national best quote on the customer’s side at the time: for a purchase, the national best offer less the price paid.
As of September 2026 — The scale of the arrangement, and the reports about it
By a trade publication’s compilation of brokers’ public routing reports, US retail brokers received about $950 million of payment for order flow in the second quarter of 2025 alone, in stocks and options together. Amendments to the SEC’s execution-quality rule (Rule 605), adopted on 6 March 2024, extend monthly reporting to large broker-dealers and add a plain summary report; their compliance date was moved from 14 December 2025 to 1 August 2026, with price-improvement statistics against the best displayed price following in November 2026.
10.2 Measuring what the customer received
Definition 10.3 (Effective spread and realised spread)
For an order of side executed at price when the mid was , the effective half-spread is : what the order paid relative to the mid. The realised half-spread at horizon is : what the liquidity provider kept once the price had moved. Both are usually quoted doubled, as spreads, and in cents or basis points.
Proposition 10.4 (The spread identity)
For every trade and every horizon,
Averaged over an order flow, the price impact term is the adverse selection that flow inflicts (Definition 1.11), and the realised spread is the liquidity provider’s gross revenue per share.
Proof. Add and subtract . ∎
The identity turns the central idea of Chapter 1 into something measurable from a file of trades and quotes. It also shows what an execution-quality statistic can and cannot say: the effective spread is what the customer paid; the split between the two terms on the right describes the flow, not the quality of the execution.
Definition 10.5 (Rule 605 and Rule 606 reports)
A Rule 605 report is the monthly public disclosure by which a US market centre states, by stock and order type and size, its execution speed, effective and realised spreads and price improvement. A Rule 606 report is the quarterly public disclosure by which a broker states to which venues it routed its customers’ orders and what payments it received from each.
Example 10.6 (Reading one fill)
The national best quote is ; a customer’s market purchase of 100 shares is filled at 20.018. Price improvement: 0.2 cent a share, 20 cents on the order. Effective half-spread: cent. Five minutes later the mid is 20.013: the realised half-spread is cent and the price impact 0.3 cent. The wholesaler’s gross revenue on this fill was 50 cents, out of which it pays the broker and its own costs.
10.3 Why uninformed flow is valuable
Proposition 10.7 (What a wholesaler can afford to pay)
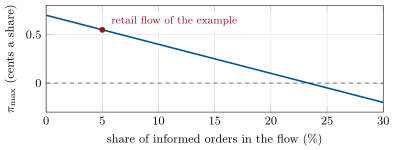
Let the quoted half-spread be . A flow whose orders are informed with probability , each informed order being followed by a move , and which is given a price improvement of a fraction of , yields an expected realised half-spread of . A wholesaler with operating costs per share breaks even paying the broker at most
Proof. Effective half-spread less expected price impact is the realised half-spread by Proposition 10.4; subtract costs. ∎
Example 10.8 (The same cent, two flows)
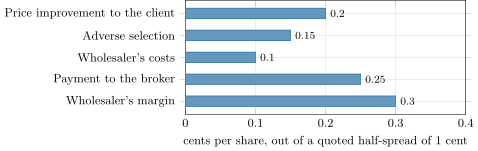
Take cent, cents, cent. On an exchange, where 35% of the orders hitting a quote are informed, a market maker earns before costs: the quoted spread is, in equilibrium, barely enough. For retail flow with and : cent. The wholesaler can pay the broker 0.25 cent and keep 0.30 (Figure 10.2). Nothing here depends on speed or on being cleverer than the customer: the value lies entirely in the segmentation of orders by how much they know.
Remark 10.9 (Who pays)
The retail customer is better off than on an exchange by the price improvement and the absent commission. The cost falls elsewhere. Exchange quotes are set for the flow that reaches exchanges; if the mildest orders are removed from it, rises there and so does the spread (Remark 9.14). Price improvement is then measured against a benchmark that the arrangement itself has widened. How large this effect is, and whether order-by-order competition would serve customers better than wholesaling, has long been argued before the SEC without a settled answer.
10.4 When the arrangement is tested
Example 10.10 (An enforcement case)
In December 2020 the SEC charged Robinhood Financial with misleading customers about its revenue sources and with failing its duty of best execution; the firm agreed to pay $65 million without admitting or denying the findings. The order found that between 2015 and late 2018 the broker’s customer communications omitted payment for order flow, its largest source of revenue, and that it had accepted unusually high payments in exchange for lower price improvement: its customers’ executions were $34.1 million worse than at competing brokers, even after allowing for the commissions they did not pay.
The case states the conflict precisely: Proposition 10.7 fixes the total, , and leaves its division between the customer (), the broker () and the wholesaler to negotiation between the last two. The customer is not at the table; the Rule 605 and 606 reports, and the broker’s best-execution duty, are there on its behalf.
The week of 28 January 2021 tested the chain at a different link: not pricing but plumbing. The purchase restrictions that made headlines came from clearing-house collateral (Chapter 5), not from the wholesalers; the SEC staff’s report on the episode concluded that “it was the positive sentiment, not the buying-to-cover, that sustained the weeks-long price appreciation” of the stock at its centre. It is the first case study of Chapter 31.
10.5 Tutorial: measuring execution quality
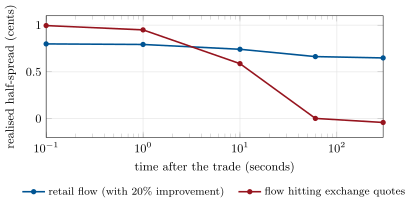
Goal. Compute effective spread, realised spread and price impact on two simulated order flows and reproduce Figure 10.3. End state: a realised half-spread after five minutes of 0.65 cent for retail flow and about zero for exchange flow.
The flows. Orders are informed with probability 5% (retail) or 35% (exchange); an informed order is followed by a 3-cent move that unfolds over about a minute; noise is added at every horizon.
class Flow:
    name: str
    informed: float          # probability that an order predicts the move
    drift_cents: float       # size of the predicted move, reached gradually over ~60 s
    improvement: float       # price improvement given, as a fraction of the quoted half-spread


RETAIL = Flow("retail", 0.05, 3.0, 0.20)
EXCHANGE = Flow("exchange", 0.35, 3.0, 0.0)


def simulate(flow: Flow, n: int, seed: int, half_spread: float = 1.0, noise_per_sqrt_s: float = 0.35):
    rng = np.random.default_rng(seed)
    side = rng.choice([-1, 1], size=n)
    price_vs_mid = side * half_spread * (1.0 - flow.improvement)          # p - m
    informed = rng.random(n) < flow.informed
    moves = {}
    for tau in HORIZONS_S:
        learned = flow.drift_cents * (1.0 - np.exp(-tau / 20.0))
        moves[tau] = side * informed * learned + rng.normal(0.0, noise_per_sqrt_s * np.sqrt(tau), n)
    return side, price_vs_mid, moves
Listing 10.1. Two flows that differ only in how much they know and in the price improvement they are given. code/markets-1/10-retail-flow-and-wholesaling/python/execq.py The statistics: three means, and the identity between them.
def stats(side, price_vs_mid, move) -> dict[str, float]:
    effective = side * price_vs_mid
    impact = side * move
    realised = effective - impact
    return {"effective": float(effective.mean()), "realised": float(realised.mean()),
            "impact": float(impact.mean())}
Listing 10.2. Effective, realised, impact. code/markets-1/10-retail-flow-and-wholesaling/python/execq.py - Run. Effective half-spreads are 0.80 and 1.00 cent. At 300 seconds the price impacts are 0.15 and 1.05 cents, the products ; the realised half-spreads are what remains.
- Choose the horizon. At 100 milliseconds both flows look equally profitable; the difference appears only over tens of seconds. A horizon shorter than the time over which information reaches the price flatters every flow.
What to change next. Give retail orders in one stock (a “meme” stock in a frenzy) and recompute . Then make the noise ten times larger and see how many trades the means need before the two flows can be told apart.
10.6 Build: the execution-quality report
Purpose. Every execution of the miniature firm, whether it provides or takes liquidity, is scored the same way. The report is the firm’s own Rule 605 table and the raw material of the transaction-cost analysis of One Quant Book 10.
Interface. Fill(ts, symbol, side, quantity, price, bid, ask) with the quote at execution; a mid_at(symbol, ts) callback; report(fills, horizons, by=(symbol, size_bucket)) returning, per group: number of fills and shares, share-weighted effective, realised and impact half-spreads in basis points, price improvement in cents, and the fraction of shares executed at, inside and outside the quote.
Rules. Integer prices; the identity of Proposition 10.4 must hold exactly per fill. A fill with a crossed or missing quote is excluded and counted separately, never silently dropped. Size buckets follow the customary order size ranges (1–99, 100–499, 500–1 999, 2 000–4 999, 5 000 and more).
Acceptance tests. code/firm/execquality/tests/: the single-fill example of this chapter; the identity on random fills; weighting by shares, not by fills; exclusions counted.
Stretch. Add the markout curve: realised spread at a list of horizons, with a standard error per point.
Sources and further reading
- US Securities and Exchange Commission, SEC Charges Robinhood Financial With Misleading Customers About Revenue Sources and Failing to Satisfy Duty of Best Execution, press release 2020-321, 17 December 2020, and administrative order 33-10906.
- US Securities and Exchange Commission, Disclosure of Order Execution Information, adopting release of 6 March 2024; Extension of Compliance Date, Federal Register, 2 October 2025.
- US Securities and Exchange Commission, Staff Report on Equity and Options Market Structure Conditions in Early 2021, October 2021.
- Global Trading, “Robinhood, Schwab led retail order flow payment bonanza”, 2025 (compilation of Rule 606 reports).
- R. Huang and H. Stoll, “Dealer versus auction markets: a paired comparison of execution costs on NASDAQ and the NYSE”, Journal of Financial Economics 41 (1996) — effective and realised spreads.
- R. Battalio, S. Corwin and R. Jennings, “Can brokers have it all? On the relation between make-take fees and limit order execution quality”, Journal of Finance 71 (2016).
10.7 Exercises
Exercise 10.1 ★
The quote is . A customer sells 200 shares at 35.405. Compute the price improvement per share and in dollars, and the effective half-spread.
Solution
Solution of Exercise 10.1.
A sale is compared with the best bid: improvement cent a share, $1.00 on the order. Mid 35.42: effective half-spread cents.
Exercise 10.2 ★
For the sale of the previous exercise the mid one minute later is 35.412. Compute the realised half-spread and the price impact, and check the identity.
Solution
Solution of Exercise 10.2.
For a sale . Realised: cent. Impact: cent. : the price moved the seller’s way, against the buyer who provided the liquidity.
Exercise 10.3 ★
A broker receives 0.18 cent a share of payment for order flow on 60 million shares a day. What is that per year (252 days)? Express it per customer if the broker has 12 million funded accounts.
Solution
Solution of Exercise 10.3.
million a year, about $2.27 per account.
Exercise 10.4 ★★
With cents, cents, cent and a price improvement of 15% of : compute for flows with and . At what does the wholesaler stop bidding for the flow?
Solution
Solution of Exercise 10.4.
: 0.995 cent at , 0.355 cent at , zero at .
Exercise 10.5 ★★
Broker A takes 0.30 cent of payment and its customers get 10% of the half-spread as improvement; broker B takes 0.10 cent and its customers get 30%. With cent, how much better off per share is B’s customer? If B charges a commission of $1 per order, for what order sizes is A cheaper?
Solution
Solution of Exercise 10.5.
B’s customer receives 0.30 cent of improvement against 0.10: 0.20 cent a share better. B’s $1 commission equals that advantage on 500 shares: A is cheaper for orders below 500 shares, B above. The “free” broker is the expensive one for large orders.
Exercise 10.6 ★★
A wholesaler measures realised spreads of 0.70 cent at one second and 0.20 cent at five minutes on a broker’s flow, with an effective half-spread of 0.75. Compute the price impact at both horizons. What does the pattern say about this broker’s customers, and what will the wholesaler do?
Solution
Solution of Exercise 10.6.
Impact 0.05 cent at one second and 0.55 cent at five minutes: the information in this flow reaches the price slowly — customers who follow news or momentum over minutes, not machines. At five minutes the wholesaler keeps 0.20 cent, probably less than its payment and costs: it will give less improvement on this broker’s flow, pay less for it, or decline the most toxic symbols.
Exercise 10.7 ★★★
Coding. With simulate and stats, estimate for the retail flow the standard error of the mean realised half-spread at 300 seconds from trades, and deduce how many trades are needed to distinguish from at two standard errors.
Solution
Solution of Exercise 10.7.
The per-trade standard deviation at 300 seconds is about 6.1 cents (the noise dominates), so the standard error from 10 000 trades is 0.061 cent. Moving from 5% to 8% lowers the mean by cent. Two standard errors below that difference requires trades: toxicity is measurable per broker per day, and barely per stock.
Exercise 10.8 ★★★
Find the flaw. A wholesaler’s marketing states: “We delivered $1.2 billion of price improvement to retail investors last year.” Give three reasons why this number, even if exactly computed, does not measure the benefit to those investors.
Solution
Solution of Exercise 10.8.
(i) It is measured against the national best quote, which excludes odd lots and hidden or midpoint liquidity and, being taken from the consolidated tape, is stale when prices move: the true alternative was often better than the benchmark. (ii) The benchmark spread is itself wider because retail flow has been removed from exchanges: part of the “improvement” returns a cost the arrangement created. (iii) A gross total scales with volume and spread and says nothing per share or relative to the realisable alternative, the midpoint; nor does it net off what the same investors pay indirectly through the payment to their broker. The relevant statistic is the effective spread as a fraction of the quoted spread, by order size, across wholesalers.
10.8 Problem: Pricing Retail Flow
Problem 10.1
Weekend problem — bidding for a broker’s order flow
You run the wholesaling desk of a market-making firm. A retail broker routing 40 million shares a day invites you to bid. Its flow is in stocks with an average quoted half-spread of 1.2 cents. From a sample you estimate that 6% of its orders are informed, with an average subsequent move of 3.5 cents. Your costs are 0.11 cent a share.
Part I — The economics of the flow.
- Compute the expected price impact per share.
- With a price improvement of 20% of the half-spread, give the effective and the realised half-spread.
- Compute .
- Give your daily gross revenue and daily margin if you pay 0.30 cent.
- And per year of 252 days.
Part II — The auction. The broker ranks wholesalers by price improvement delivered, and sets the payment itself at 0.30 cent for all.
- What is the largest improvement fraction at which you break even?
- A competitor has costs of 0.06 cent. What can it offer?
- You can hedge residual inventory more cheaply than it can, which lowers your effective price impact by 0.08 cent. Who wins now?
- Why does the broker route to several wholesalers at once and reshuffle shares monthly?
Part III — The flow changes.
- During a speculative frenzy the informed share of orders in twenty stocks rises to 25% and the move to 6 cents. Compute the realised half-spread in those stocks at and unchanged spreads.
- Those stocks are 15% of the broker’s volume. Give your new daily margin, paying 0.30 cent.
- Spreads in those stocks widen to a half-spread of 3 cents. Redo question 10.
- List three things you can do, within your agreement with the broker, when one segment of a flow turns toxic.
Part IV — The other parties.
- What does the broker earn per year from your payment?
- What do its customers receive per year in price improvement?
- The broker could instead send all orders to an exchange charging a taker fee of 0.30 cent. What would the customers pay relative to the mid, and what would the broker pay?
- Compare the customers’ all-in cost in the two arrangements. What has been assumed about the exchange’s quoted spread?
- Under Remark 10.9, how might that assumption fail if all retail flow moved to exchanges?
- State the named result: the maximum payment per share at which you break even on this flow, in cents.
- In one sentence: what exactly is the wholesaler buying?
Solution
Solution of Problem 10.1.
1. cent. 2. Effective cent; realised cent. 3. cent. 4. Gross a day; margin . 5. $75.6 million gross, $34.3 million of margin. 6. gives . 7. With costs of 0.06: . It outbids you. 8. Your impact falls to 0.13: . You win. Risk management is a competitive weapon here exactly like cost. 9. Competition is its only lever: the payment being fixed, the wholesalers can compete only on improvement, and the monthly reallocation turns measured improvement into market share. It also protects the broker’s best-execution defence and avoids dependence on one firm. 10. cent: a loss before costs. 11. Normal stocks: . Toxic stocks: margin cent on 6 million shares, . Total $58 600. 12. Effective , realised cent; after costs and payment, cent. The widening of public quotes restores the wholesaler’s economics: the benchmark does the repricing. 13. Reduce price improvement in those symbols; route more of them to exchanges instead of internalising; hedge faster and carry less inventory; ask the broker to renegotiate payment by symbol class. What it cannot do is refuse individual customers’ orders it dislikes while keeping the others. 14. million. 15. cent a share: $24.2 million. 16. Customers would pay the full half-spread, 1.2 cents; the broker would pay 0.30 cent a share in taker fees, $30.2 million a year, instead of receiving the same amount. 17. 0.96 cent against 1.20: the customers are better off by the improvement, assuming the exchange spread stays at 1.2 cents. 18. With 40 million mostly uninformed shares a day added to the exchange’s flow, there falls and competition among market makers narrows the quoted spread, possibly by more than the improvement now received. The comparison cannot be made at today’s spread. 19. 0.64 cent per share. 20. The right to trade against orders known in advance to carry little information: a low .
10.9 Interview questions
Interview question 10.1 ★ trader, researcher, developer
What is payment for order flow, and why would a market maker pay for orders?
Solution
Solution of Interview question 10.1.
A payment from a market maker to a broker for routing customer orders to it. The market maker pays because retail orders are, on average, uninformed: the price moves little against it afterwards, so it keeps most of the spread it earns, unlike on an exchange where the quoted spread is just enough to cover adverse selection. Part of that surplus goes back to the customer as price improvement and part to the broker.
What the interviewer is looking for: adverse selection as the reason, and the three-way split.
Interview question 10.2 ★ trader, researcher
Define the effective spread and the realised spread. Which one measures the customer’s cost and which one the market maker’s revenue?
Solution
Solution of Interview question 10.2.
Effective: signed difference between the execution price and the mid at execution; it is the customer’s cost. Realised: the same against the mid some time later; it is the liquidity provider’s revenue. Their difference is the price impact, the information in the order.
What the interviewer is looking for: the identity, and “some time later” questioned immediately.
Interview question 10.3 ★★ researcher, mle
You are given a year of a broker’s fills with quotes. How do you decide whether its flow is “toxic”, and at which horizon do you measure?
Solution
Solution of Interview question 10.3.
Compute the markout curve: share-weighted signed mid change after each fill, at horizons from milliseconds to tens of minutes, with standard errors, by symbol class, order size and time of day. Toxic flow has a markout that grows with the horizon up to the size of the spread or beyond. Measure at the horizon where the curve flattens — which also approximates how long the inventory is actually held before it is hedged. Too short a horizon shows every flow as benign; too long adds noise without signal.
What the interviewer is looking for: a curve rather than a single number, and standard errors.
Interview question 10.4 ★★ trader, researcher
A retail order and an institutional algorithm’s child order are both for 100 shares at market. Why does a market maker treat them differently, and how can it tell them apart on an anonymous exchange?
Solution
Solution of Interview question 10.4.
The retail order is a one-off with little information; the child order is one of hundreds from a parent that will keep pushing the price the same way. On an anonymous book the market maker infers the type statistically: order size patterns, regular timing, persistence of same-side flow, reaction to its own quotes, venue and order type used. Off-exchange it does not need to infer: the broker’s identity is the label, which is exactly what wholesaling monetises.
What the interviewer is looking for: autocorrelation of order flow as the signature of a parent order.
Interview question 10.5 ★★ researcher, bank
Make the case that payment for order flow is good for retail investors, then the case that it is bad for markets.
Solution
Solution of Interview question 10.5.
Good: zero commissions and measurable price improvement, fast fills for small orders, competition among wholesalers on execution quality, and a best-execution duty policed through public reports. Bad: the broker’s revenue depends on a counterparty rather than its customer; improvement is measured against a benchmark the practice itself widens; segmenting uninformed flow away from exchanges degrades public price formation and raises costs for everyone who trades there, including the funds that hold retail savers’ pensions; and order flow concentrates in a few firms.
What the interviewer is looking for: the benchmark problem and the externality on lit markets.
Interview question 10.6 ★★★ researcher, trader
Your wholesaling desk’s realised spread on one broker’s flow has halved over six months while its effective spread is unchanged. Give three hypotheses and the data that would discriminate between them.
Solution
Solution of Interview question 10.6.
(i) The customers changed: more active or news-driven traders, or a shift toward volatile symbols — check impact by symbol class, customer cohort and time of day. (ii) The broker changed its routing, sending the benign orders elsewhere and the rest to you — compare your share of its flow by order type and the mix against its Rule 606 report. (iii) Your own hedging got worse or slower, so the horizon at which you realise the spread lengthened — compare markouts at fixed horizons (unchanged under this hypothesis) with realised P&L per share. A fourth: quoted spreads fell while improvement stayed fixed in cents.
What the interviewer is looking for: hypotheses that make different predictions, each tied to a dataset.